City, University of London Institutional Repository
Citation
:
Rahman, E., Powner, M. B. ORCID: 0000-0003-4913-1004, Kyriacou, P. A.
ORCID: 0000-0002-2868-485X and Triantis, I. ORCID: 0000-0002-8900-781X (2018).
Assessment of the Complex Refractive Indices of Xenopus Laevis Sciatic Nerve for the
Optimisation of Optical (NIR) Neurostimulation. IEEE Transactions on Neural Systems and
Rehabilitation Engineering, doi: 10.1109/TNSRE.2018.2878107
This is the accepted version of the paper.
This version of the publication may differ from the final published
version.
Permanent repository link:
http://openaccess.city.ac.uk/20936/
Link to published version
:
http://dx.doi.org/10.1109/TNSRE.2018.2878107
Copyright and reuse:
City Research Online aims to make research
outputs of City, University of London available to a wider audience.
Copyright and Moral Rights remain with the author(s) and/or copyright
holders. URLs from City Research Online may be freely distributed and
linked to.
Assessment of the Complex Refractive Indices of
Xenopus Laevis Sciatic Nerve for the Optimisation
of Optical (NIR) Neurostimulation
Enayetur Rahman, Michael B. Powner, Panayotis A. Kyriacou and Iasonas F. Triantis
Abstract—Despite an increasing interest in the use of light for neural stimulation there is little information on how it interacts with neural tissue. The choice of wavelength in most of the optical stimulation literature is based on already available light sources designed for other applications. This paper is the first one to report the complex refractive index of the Sciatic nerve of Xenopus laevis, which is a crucial parameter for identifying the optimal wavelength of optical stimuli. The Xenopus laevis
neural tissue is the most widely used tissue type in peripheral neurostimulation studies. In this work, the Reflectance (R) and the Transmittance (T) of theSciaticnerve were measured over a wavelength range of 860 nm to 2250 nm, and the corresponding real (n) and the imaginary (k) refractive indices were calculated using appropriate formulae in a novel way. The reportednvalues were between 1.3-1.44 and thekvalues are of the order of10−5 over the full wavelength range. The absorption coefficient, α
was found to be 100-500 cm−1. Several localised wavelength ranges were identified that can offer a maximised power coupling between potential optical stimuli and the neural tissue (1150-1200 nm, 1500-1700 nm and 1900-2050 nm). The narrower regions of 1400-1600 nm and 1850-2150 nm were found to exhibit maximised absorbance. Separately, three regions were identified, where the penetration depths are the greatest (950-1000 nm, 1050-1350 nm and 1600-1900 nm). This paper provides, for the first time, the fundamental specifications for optimising the parameters of optical neurostimulation systems.
Index Terms—Spectrophotometry, Neurostimulation, Optical Stimulation, Sciatic nerve, Complex refractive index, Xenopus laevis.
I. INTRODUCTION
A
RTIFICIAL stimulation of peripheral nerves, either for activation or for inhibition or blocking has an increasing range of therapeutic applications, respectively ranging from restoration of function by functional electrical stimulation (FES) following spinal cord injury (SCI) [1]–[3] to pain relief and seizure suppression action in treatment-resistant epilepsy [4]. Electrical Nerve Stimulation (ENS) is the benchmark modality for artificial intervention to neural signalling and altering stimulus waveform parameters in combination with electrode topology variations allow its use towards either the generation of action potentials (AP) - e.g. with well reported biphasic waveforms [5] - or towards stopping ongoing neural activity - e.g. through the use of high-amplitude long duration pulses or high-frequency waveforms [6]. AlthoughDr E. Rahman is with the NIBEC, School of Engineering, Ulster University, Prof. P.Kyriacou and Dr I. Triantis are with the Department of EEE and Dr M. Powner is with the Centre for Applied Vision Research at City, University of London, UK. E-mails: [[email protected], enayet.rahman / michael.powner / p.kyriacou / i.triantis] @city.ac.uk
some very well performing systems have been presented [3], [5], [7]–[13], there are still some challenges that ENS has not addressed satisfactorily i.e. limited fascicle selectivity due to poor localization or lack of directional selectivity - the separate addressing of afferent and efferent pathways [14], and the presence of stimulus artefacts [15]. As a result the therapeutic potential of artificial neurostimulation cannot be reached by the current ENS methods alone, as their use entails side-effects including the activation of non-targeted structures and the inability to fully block neural activity when required. Optical and more specifically Infrared Nerve Stimulation (INS) of unmodified peripheral nerves (as opposed to the case of Optogenetics [16]) is increasingly been considered as an alternative or a complementary modality to electrical neurostimulation as it has the potential to offer a much more localised and thus selective effect. Recent studies [17]–[19] have investigated the effects of light in stimulating peripheral and central nervous system (PNS and CNS) tissue, mainly exploring wavelengths in the Near Infra-red (NIR) region of the light spectra [17], [19]. Similar to its electrical counterpart, optical stimulation has been shown to achieve neural activation [10], [18], [20], [21] and blocking [22], with both effects at-tributed to localized temperature rise due to infrared radiation absorption by water molecules. Literature indicates that such a temperature increase affects mechanisms such as ion channel gating; activation of intracellular second messenger; formation of membrane pores; increase of conductances; or triggering of thermo-resistive ion-channels [23].
The differences between the optical stimuli that generate or block action potentials (AP) have been reported to relate to stimulus pulse duration. One recent study [23] that examined the underlying mechanism for neural activation, indicated that a short duration high energy infrared pulse results in an increase in the membrane capacitance and thereby generates a depolarizing current. Similarly, the first work that reported blocking neural signals in excited neurons using INS [22] indicated that a local heat increase due to a LASER irradiating a specific node of Ranvier for a prolonged duration blocks APs from passing through it and makes that node resistant to starting a new AP.
the optical energy or the optical parameters that are required to reach deep fascicles or fibres when optical stimulation is applied extraneurally to a nerve bundle have not been investigated in detail. Most of the aforementioned studies use LASERs with wavelengths ranging between 1550 nm [22] - the popular wavelength for optical communication - and 1850 nm [19]. Still, lack of information regarding the optical constants of neural tissue over the entire NIR spectrum makes it difficult to determine if the choice of a specific wavelength is optimum for either inhibition or excitation and what is the depth of penetration in neural tissue, especially in peripheral nerves.
Given optical stimulation’s potential for localization and hence selectivity - either fascicular or directional - which could lead to minimization of any side-effects during optical or mixed-mode stimulation, it is very desirable to carry out research that will determine the optical parameters of neural tissue over the NIR spectrum. The optical energy distribution and absorption in the nerve can be characterized by the real and imaginary parts of the refractive indices of the nerve. To be able to selectively stimulate, block or inhibit specific nerve fibres it is imperative to investigate the propagation and depth of penetration of an optical signal through the various layers of a peripheral nerve.
This paper aims to offer new insights into the interaction of light with neural tissue (similar to the illustration in Fig. 1) by determining the complex refractive indices of the xenopus laevis sciatic whole nerve bundle in the NIR region and more specifically in the wavelength range of 860−2250nm, using spectrophotometry and custom modified mathematical formulae.
Xenopus sciatictissue is commonly used for neuroprosthe-ses research [24] and the choice of wavelength range is for consistency with all relevant literature, where water is indi-cated as the dominant IR absorber, with very little absorbance in the visible spectrum. The water content of nerves as reported by [25] is about55%. By determining the absorption coefficient of the entire nerve, it is possible to determine if the remaining 45% content of the neuron has any distinctive absorption characteristics present or not. Determination of the optical constants from acquired spectrophotometric data requires the formulation of an inverse problem [26], where the real (n) and imaginary (k) parts of the refractive indices can be determined from the measured Transmittance(T) and Reflectance (R) data determined experimentally through the use of a Spectrophotometer on neural tissue samples. The problem in determining the optical constants from R and T for a sample with finite thickness is that there are multiple reflections within the sample, which alters the obtained values ofnandkby as much as80%[27]. To avoid such inaccuracies in obtaining the optical constants, the formalism by Airy and Abel`es [26] that accounts for the multiple reflections within the sample is used in this paper.
[image:3.612.316.567.55.187.2]Section II describes the method of sample preparation and the method of obtaining the optical constants from the measured spectrophotometric data. The results and discussions are given in Section III, and the conclusions are provided in Section IV.
Fig. 1: Optical stimulus applied to a nerve bundle. Optical parameters will define whether it can reach deep fascicles and fibres and how it affects neural tissue.
II. METHODS
Spectrophotometric experiments were carried out on Xeno-pus laevissciatic nerve samples using a PerkinElmer Lambda 1050 spectrophotometer. A 100 mm Integrating sphere (PerkinElmer) was used to capture all the scattered light within the sample. Appropriate formulae were used and modified to calculate optical parameters (n, k) from the spectrophotomet-ric measurements (R, T), while eliminating the influence of the glass slide and the scattering.
A. Sample Preparation
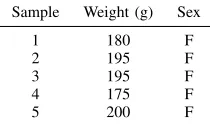
Ten sciatic nerve tissues were collected from five mature female Xenopus laevis subjects as detailed in table I. All animals were treated in accordance with the Animal Welfare Act 2006. The subjects were concussed by striking the back of the head and immediately culled by decapitation and destruction of the brain. The sciatic nerve was dissected from the base of the spine to the knee. The nerve was dissected away and isolated from the animal. The nerve was kept moist using standard amphibian Ringer solution [28].
The use of the animal samples in this study was approved by the Senate Research Ethics Committee of City, University of London.
TABLE I: Sample table
Sample Weight (g) Sex
1 180 F
2 195 F
3 195 F
4 175 F
5 200 F
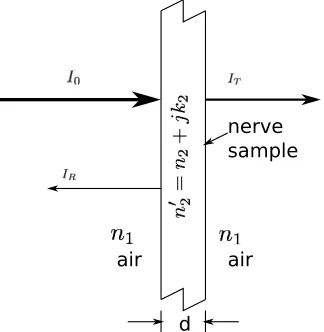
[image:3.612.383.488.564.627.2]fig. 2. This again, is the proposed practice by PerkinElmer, whereby when a sample immersed in a material is inserted in the instrument, that material can be placed in the reference chamber and measurements can then be assumed to correspond to the sample surrounded by air alone. Fig. 2 shows the sample, with thickness ’d’, interrogated by the spectrophotometer. The light intensity normally incident on the sample is I0, the
transmitted light intensity isIT and the reflected light intensity
is IR.
d
nerve sample
[image:4.612.312.564.127.314.2]air air
Fig. 2: Diagrammatic representation of the nerve sample inserted in the Spectrophotometer. Using a glass slide in the instrument’s reference chamber allows for the outside medium to be considered as ‘air’ with a refractive index, n1= 1. The
refractive index of the nerve sample can be expressed by a complex number as follows:n02=n2+jk2
B. Spectrophotometric Set-up
For spectrophotometric measurements, a Lambda 1050 dual beam UV/Visible/NIR spectrophotometer (Perkin Elmer Inc.) was used with a spectral region of 860−2250 nm, covering most of the NIR region. Data was taken at 1 nm intervals. A Deuterium lamp was used as the source, while as detector an Indium Gallium Arsenide detector (InGaAs) was used. Slit settings for the NIR were set on ‘Servo’mode, and the NIR (InGaAs) gain of 11 was used. The response time for the detector was set at0.2seconds. The front and rear attenuators were set at 100% for both the sample and reference beams. Baseline corrections (100 %T /0A and0%T /blocked beam) were performed to remove ‘Background noise’ and help reduce the effects of any stray light in the system before placing the samples in the spectrophotometer. The ‘CBM’ (Common Beam Mask) parameter was set at100%, and the other spec-trophotometer parameters were kept at their ‘default’ values. The Detector module of the spectrophotometer was replaced by a 100 mm Integrating sphere (Perkin Elmer Inc.). The sphere featured a reference compartment (Fig. 3) and a sample compartment and included white plates to disable these com-partments when their use was not required. A reference empty slide was placed at the reference compartment (Fig. 3) for both
%T(Transmittance) and%R(Reflectance) measurements. The white plate was kept at the‘sample compartment for R’during
the Transmittance and Absorbance measurements, while the sample slide replaced it during the Reflectance measurement. The sample slide was placed in the ‘Sample compartment for T’ while measuring Transmittance and this compartment was left empty during Reflectance measurements. To obtain
Sample compartment for T
Reference compartment
Sample compartment for R mirrors
Beam splitter
Incident light Integrating Sphere
Fig. 3: Diagrammatic representation of an Integrating Sphere.
the optical constants (n, k and α) for the neural tissue, the spectrophotometer was used to determine the Transmittance (T) and Reflectance (R) for a sample with a thickness d= 0.2 mmover the wavelength range specified earlier. The Integrating Sphere (IS) was used to minimise the effects of scattering through the turbid medium on the measurements of T. For the modified expressions for T and R as given in equations (6) and (7) to be valid, the assumptionsd >> λand
∆λ > ∆δ were made, where ∆λ is the difference between the consecutive λ values and ∆δ is the line-spread of the spectrophotometer. Here, the value of d≈0.2 mm is much higher than theλ∈[860nm−2250nm]and the line-spread of the spectrophotometer was maintained to satisfy the second assumption. The extracted nerve sample was placed inside a container with the predefined thickness embedded into two glass slides. The measuredT andR values were then used to approximate the first guess for Newton’s iterative method to find the values ofkandnby using equations (8) and (9). After a few iterations, the method converges towards the solution with user defined error tolerance. Once we obtained the value for k,αwas determined by using equation (2).
C. Determination of the Optical Constants
The optical properties of any homogeneous medium can be characterized by the complex refractive index. The refractive index of any medium can be expressed as:
n0(λ) =n(λ) +jk(λ) (1) here, n’, n and k are the complex, real part and imaginary part of the refractive index at the wavelengthλ. The imaginary part of the refractive index, k, is responsible for the optical absorption, where the absorption coefficient is given by:
α(λ) =4π
λ k(λ)cm
[image:4.612.95.257.176.342.2]here, λ is the free space wavelength in cm. The optical absorbance, Acan be given as:
A=α(λ)d (3) here, dis the optical distance.
Id=I0e−α(λ)d (4)
Here, I0 is the initial light intensity and Id is the light
intensity after propagating a distance ‘d’ through the medium. The Absorbance, A (αd) becomes1, when the intensity falls to 36.7% of its initial value. We can consider that beyond this distance no considerable optical power is reached and therefore, we consider this distance as the penetration depth throughout this article. The real part of the refractive index (n) plays a role in controlling the refraction and reflection at the material interfaces. This study is not concerned about the refraction experienced by the optical signal within the nerve. However, the launched optical signal experiences reflection at the nerve boundary. Thus, an optical stimulation system would need to be designed so as to minimise that reflection as much as possible.
When light enters from one medium to another, due to the differences in the refractive indices (∆n) a certain amount of optical power is reflected back to the first medium, which is proportional to ∆n. At a specific wavelength, λ, ∆n has to be minimized andαhas to be maximized. The condition for
∆n will ensure that the optical power enters into the nerve with minimum Reflectance. A higher α will make sure that the entered optical power is absorbed into the inner material of the nerve to maximize the temperature rise.
Obtaining the optical constants (n, k) over the aforemen-tioned spectral region will allow for the identification of the optimum wavelength or wavelengths for optical neurostim-ulation. Biological media generally have strong scattering properties. In this study, we are interested only in absorption. However, determination of the optical constants (n, k) is af-fected by the presence of scattering. Therefore, it is necessary to have a technique that eliminates or reduces the effects of scattering in obtaining the optical constants. That was the reason that the aforementioned Integrating Sphere (IS) was used in this study to remove the effects of scattering in the collected transmitted signal, which is used to calculate the optical constants.
As mentioned previously, the medium surrounding the sam-ple was considered to be ‘air’ with a refractive index of n1 = 1, and the refractive index of the sample was n02 that
is n02=n2+jk2, where,n2 is the real part of the refractive
index andk2is the imaginary part of the refractive index of the
nerve sample. The Reflectance at the medium air-nerve (1-2) interface can be written by Fresnel’s equations as follows:
R12=
(n2−n1)2+k22
(n2+n1)2+k22
(5)
There are several methods available in the literature to de-termine the Optical constants from the measured Transmission and Reflection spectra [29], [30], [31], [27], [32], [33]. When it comes to determining the optical properties of biological samples a major issue is sample preparation, as the sample
has to be embedded into glass or Quartz slides. The finite thickness of the sample introduces multiple reflections within the sample, reducing the reliability of the values produced by the traditional Beer-Lambert based calculation. By using the formalism of Airy and Abel`es [26] the problem related to the multiple reflections within the sample can be reduced and as a result the Transmittance (T) and the Reflectance (R) can be expressed by the following equations:
T =IT
I0
= (1−R12)
2e−αd
1−R2 12e−2αd
(6)
R=IR
I0
=R12+
R12(1−R12)2e−2αd
1−R2 12e−2αd
(7)
where,
α= 4πk2
λ
The absorption coefficient α is dependent on the imaginary part of the refractive index, k2 and the wavelength, λ of
the incident light. The T and R values obtained from the spectrophotometer are functions of n2, k2, d, and λ if we
consider that n1 = 1. So, in functional form, T and R
can be expressed as T(n2, k2, d, λ) and R(n2, k2, d, λ). For
specific, fixeddandλthey can be expressed asT(n2, k2)and
R(n2, k2). We have now two non-linear equations with two
unknowns (n2, k2) for each wavelength. Newton’s iterative
formula for solving non-linear equations of multiple variables can be used to determine then2,k2from theT andRobtained
from the spectrophotometer. The initial values for the iterations of k2 andn2 can be determined as follows [26], [27]:
k2(ini)=
−ln(T+R)×λ
4πd (8) n2(ini) =
(1 +R) +q(1 +R)2−(1−R)2(k2
2(ini)+ 1)
1−R
(9) Newton’s iterative method converges towards the actual solu-tion and the initial estimate does not necessarily have to be very close to the target value (±(20to30)%) [34]. Under the assumptions made, the algorithm converges to the theoretical value predicted by the equations to the target tolerance set by the user. For the values used in this paper and with an error tolerance of the order of10−10, it takes 4-5 iterations to reach
the solution.
III. RESULTS ANDDISCUSSION
Transmittance (T) and Reflectance (R) were obtained for the ten samples from the toad sample given in Table I by using PerkinElmer Lambda 1050 spectrophotometer equipped with a 100 mm IS following the procedure described in Section II. Figure 4 shows the average T and R for samples with a thickness of 200 µm over the wavelengths 860 nm to
minima at around 1480 nmand 1980nm. The transmission spectra is fairly flat in the region 980−1380 nm with a T ≈ 0.93. There is another wavelength range where the transmission is maximized that is1600−1800nm. For neural stimulation, where the optical power source is external to the targeted tissue, is desirable to maximise transmittance while minimising reflectance to ensure maximum energy transfer from the source to the tissue. Thus, it is interesting to note that between the wavelengths of 1100−1380nmthe Reflectance has a flat region without being at its maximum value while the corresponding value for Transmittance is optimal.
Figure 5 (top) is the average real refractive index (n) as calculated by using the data of fig. 4 and equations (6) and (7). Error bars indicate the standard deviation of the biological samples as detailed in table I from all valid experiments. The graph exhibits two prominent local minima (1480 nm and 1980 nm), which corresponds to wavelengths for which optical power reflection is minimized. These λ ranges need to be examined in conjunction withλwhere absorbance in the nerve tissue is maximum. Considering the fact that the real refractive index of the outer medium of the nerve being ≈1.3 for the wavelengths980nm,1480nmand1980nmthe Reflectances are 0.23, 0.009 and0.0003 respectively. For the wavelength ranges of1100−1380nmand1700−1850nm,0.08%power will be reflected back.
Therefore, to maximize the optical power coupled to the nerve medium, the optimum choice of wavelength is either at around 1480 nm or 1980 nm considering only the effects of the real refractive index in the wavelength range. Still, either of 1100−1380 nm or 1700−1850 nm regions can be used if a broader wavelength operating range is required. As mentioned previously, an optical neurostimulation system utilises the optical power absorbed in the neural medium to raise the localised temperature. Thus, in order to identify the stimulator’s optimum operating wavelength, the characteristics of the imaginary parts of the refractive indices (k) should be considered in conjunction with the real part (n).
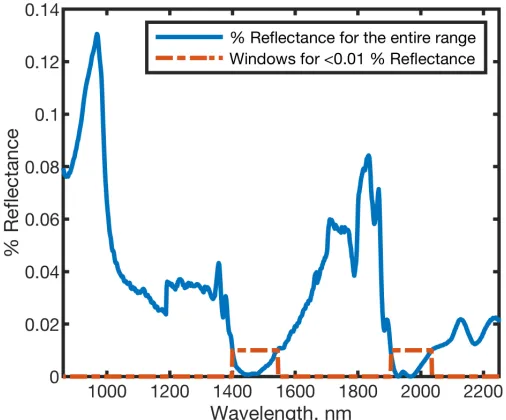
[image:6.612.313.562.55.265.2]In stimulating a nerve with IR radiation, the optical power emitted by a light source (Lasers or LED) has to be launched from outside the nerve boundary. As at an interface of two materials, where the refractive index changes a certain amount of optical power is reflected back into the medium from where the power is launched that because of Fresnel’s reflection. The higher the refractive index difference (∆n), the higher the amount of power reflected. As the power transmitted into the nerve is of use for affecting the stimulation process, it is essential that the Transmittance be maximized. Figure 6 shows the reflected power from the nerve interface considering that the optical power is launched from a medium with a refractive index equals to that of water in the range860nm < λ < 2250nm. The Reflectance characteristics shown in fig. 4 clearly show that for the 1150 nm < λ < 1200 nm range the reflected power is minimum, which is desirable for optical stimulation. There are two more λ ranges where the Reflectance is minimized, one in the range 1500−1700nm and the other in1950−2050nm. These two ranges can be the potential λ for any optical nerve stimulation system as they ensure minimal reflections from the nerve boundary. There are
Fig. 4: Transmittance/Reflectance values of sciatic nerve of Xenopus laevis in NIR wavelengths with the Integrating Sphere
Fig. 5: Average real refractive index (n, top), imaginary refractive index (k, middle) and absorption coefficient (α, bottom ) as calculated using the data of fig. 4 and Newton’s iterative method
[image:6.612.312.564.319.516.2]Fig. 6: Reflected power when light is entered from water to the sciaticnerve bundle. The dotted line indicates the wavelength ranges that offer the minimum (less than 0.01%) reflectance.
optical power lost in the medium due to the optical absorbance and a higher value of k represents a higher absorbance. It is evident from fig. 5 (middle) that theSciaticnerve sample has negligiblekfor the wavelengths in the NIR region of spectrum up to 1380 nm, the value increases beyond that wavelength considerably. There are two distinct local maxima at1480nm and 1980 nm with the later corresponding to higher values for k. From a broader perspective, for 1400 −1580 nm and 1700−2050 nm the nerve exhibits higher values of k, thereby making these two wavelength ranges the potentially preferred wavelengths for raising the nerve temperature by optical heating. It is therefore evident that wavelengths>1480
are suitable for optical stimulation due to their suitability for effecting localised heating. Still, the choice of the operating wavelength also depends on other factors that will be discussed later in the section. Amongst the above mentioned two wave-length ranges, the second one has the potential to increase the local temperature at a higher pace while the first range can be useful if a more uniform heat distribution in the medium is required.
The nandkare two useful parameters of any medium for assessing optical wave propagation through it, theoretically or through simulations. The imaginary part of the refractive index (k), however, can be used to obtain the absorption coefficient (α) of any medium, which is an even better indicator for op-tical absorption within the medium. The absorption coefficient αas given in equation (2), expressed incm−1, is related to the
imaginary part of the refractive index (k). Figure 5 (bottom) shows the absorption coefficient (α) calculated from k using equation (2) over the λ range. The graph is very similar to that of k, showing similar trends in characteristics over λ, with a slightly lower rate of increase with λ. For the range λ <1380nmthe absorption coefficient,α≈10cm−1. There are two distinct peaks atλ= 1380nmandλ= 1980nmwith αequals to38cm−1and55cm−1 respectively. For the range
1480 nm < λ < 1580 nm and 1700 nm < λ < 2050 nm the overall α is significantly higher than the surroundings, making them potential candidates for optical nerve stimulator wavelengths. A higher α represents higher absorption in the medium and higher temperature rise in the medium. The second λ range is more suitable for the case when a rapid temperature rise is desired. The trace of Fig. 5 (bottom) is re-drawn in Fig. 7 with the windows around these ranges clearly identified using FWHM (Full Width at Half Maxima) around the peaks atλ= 1380nmandλ= 1980nm. A higher value of α also reduces the penetration depth at which the optical power can be reached to affect the target nerve. Considering only the penetration depth the first range will allow the optical stimulus to reach deeper into the nerve bundle. If we aim to reach deeper into the medium, the α has to be minimized, however, if we wish to have a rapid temperature rise in the nerve tissue, the α has to be higher. Therefore, the choice of the wavelength is dependent on a number of factors i.e. how fast we wish to raise the temperature, how deep we wish to reach, how equalized we wish the temperature distribution within the nerve medium be. If the stimulation application calls for the targeting of a nerve fibre located near the surface of the nerve bundle and if a rapid rise in the local temperature is required, a wavelength in the range1700nm < λ <2050nm can be useful.
On the other hand, if it is desirable to elevate the overall temperature of a surface fibre without overheating at a very narrow localised tissue area, the range 1480 nm < λ <
1580 nm can be useful. By using any wavelength from that range it is also possible to reach deeper into the nerve bundle. An optical signal propagating through any lossy medium gets absorbed by the medium and as result its intensity reduces exponentially as described by equation (4). The rate of reduc-tion in the intensity is higher in the case of a material with higher absorption coefficient (α). A higherαin turn reduces the penetration depth (α1) into the material, defined as the depth at which the optical intensity reaches about36% of its initial value.
To reach nerve fibres located deeper in the nerve bundleα has to be minimized. The solid trace in Figure 8 shows the cal-culated penetration depth (α1) resulting from the experimental data for the wavelengths 860−2250 nm averaged over the Sciaticnerve samples used in this study.
There is one large maximum in the λ range at 980 nm, where the optical power can reach at a depth of 2200 µm. However, considering the fact that most of the nerve bundles are1000−2000µmin diameter, a penetration depth of500−
1000 µm is sufficient to reach a fibre located at the centre of the nerve bundle. From fig. 8 it is clear that in the range
1700 nm < λ <2050 nm the signals can reach a depth of ≈ 200µm from the nerve surface and in 1480 nm < λ <
1580 nm a penetration depth of 300 µm is possible. In the wavelengths of interest, the maximum depth where the optical signal can reach with sufficient intensity is about 300µm. If it is required to reach beyond300µm, a mechanism has to be developed so that the localized intensity at the point of interest gets increased.
[image:7.612.48.301.55.265.2]Fig. 7: Optimum wavelength ranges for maximising the ab-sorption coefficient, α. The curve is the same as the bottom trace of Fig. 5 with the widths of the windows A and B determined by the FWHM around the local maxima. These ranges are used in Fig. 10.
Fig. 8: Penetration depth for different wavelengths determined from spectroscopic measurements of the nerve. The windows A and B determined by the FWHM around the local maxima.
40% water and out of the remaining 60%,80% is lipids and
20%is protein [35]. This makes the Water:Lipids:Protein ratio to be40 : 48 : 12. The previous studies only considered water absorption, hence, the total absorption should theoretically be 40% that of pure water absorption, considering the lipids and proteins are lossless. Our measurements on the total nerve tissue showed that the total absorption is more than 40% of the value corresponding to pure water. This result indicates that the lipids and proteins in the nerve are not completely lossless in optical frequencies, although they have lower absorption
coefficients than the pure water. That means we need to launch more optical power from the laser so that the required power at the nerve membrane is reached for activation or blocking. There are challenges in obtaining the imaginary part of the refractive index experimentally, where the sample has finite thickness and scattering properties. Traditionally, the imaginary part of the refractive index can be obtained from the absorbance (A), which uses the Beer-Lambert law [26]. In this method, the Transmittance (T) is determined by using a spectrophotometer, and the absorbance can be determined by the following equation. Thek obtained by this method is labelled askBLT in this paper.
kBLT =− ln(T)λ
4π (10) As some light is reflected from the first interface of the sample, thekvalue obtained in this way is not accurate. To eliminate the effects of reflection in calculating k, in [26], the authors used a modified equation forA, which is given in the following equation, and thekthus obtained is labelled askBL.
kBL=−
ln(T +R)λ
4π (11) The method above eliminates the effect of the first reflection to some degree and produces a better estimation for k. A different approach was presented in [27], where the optical constants of silica glass were determined, taking the reflections from the interfaces into consideration. The calculatedkin that technique is labelled askcalc.
Fig. 9: Comparison of k calculated with different methods. kBLT ignores the reflection from the first interface and the
nerve medium has infinite thickness.kBLconsiders the
reflec-tion from the first interface but ignores the finite thickness of the sample. kcalc takes the finite thickness and the reflection
[image:8.612.313.562.417.644.2]The method used here to estimate k uses the fact that the incident light can have a reflection from the first interface of the sample and there can be multiple reflections within the sample before the light reaches the detector of the spec-trophotometer. Figure 9 shows the obtainedkvalues for all the methods stated above over the entire wavelength range used in this study. It is evident from the result thatkBLT gives a much
higher estimate,kcalc estimates a much lower value, however, kBL and our method give similar estimations. As our method
considers the reflections, the finite thickness of the sample and uses a iterative method to converge toward a value, which is the theoretical value for a givenR andT,the method used in this study is expected to produce more accurate values.
A. Choice of wavelengths for different stimulation types
[image:9.612.50.299.424.623.2]As mentioned earlier, an Optical Nerve stimulation system is expected to be able to apply the appropriate stimulus to either activate, inhibit or block neural activity. Moreover, fascicle (i.e. spatial) selectivity is often desirable to allow either of these types of stimuli to be applied to a neuron that is located at a specific depth inside a nerve bundle. These types of neurostimulation selectivity are related to three main optical parameters that can be derived from the work presented in this paper: reflection, absorbance and penetration depth. Still, it is evident from the first section of this paper that the choice of wavelengths in the literature has not previously taken these parameters into consideration, but has rather been mostly based on available optical sources designed for other applications.
Fig. 10: Wavelengths that can be potentially used for optical neurostimulation offering either minimum reflected power (denoted ”refl”), maximum absorbance (abs) or different pen-etration depths (decreasing from pen A to pen C).
The appropriate wavelengths that can be chosen for spec-ifying the appropriate type of optical neurostimulation to be used according to the desirable outcome are summarised in Fig. 10. It indicates the desirable wavelength ranges for each of the neural tissue parameters including Reflection from the
nerve bundle boundary (denoted ”refl” - ranges indicated in Fig. 6); Absorbance within the nerve bundle (”abs” from Fig. 7); and Penetration depths of the optical signal inside the nerve bundle (”pen” from Fig. 8).
From the perspective of minimising losses, two wavelength ranges were identified (refl-A and B) where the reflection is minimal (< 0.01%) allowing most of the incident power to enter the nerve. In terms of the stimulation outcome, blocking neural activity can be best achieved through the gradual rise and prolonged retention of a specific temperature level, while for nerve activation a rapid and brief increase in localised temperature is required. For either of these applications two wavelength ranges are identified in fig. 10 for maximizing absorbance, abs-A and B respectively, each potentially allow-ing for different rates of change of temperature. The use of wavelengths at the area of abs-A (around 1490 nm), where the absorption peak is smaller than that of abs-B, will allow the temperature distribution within the nerve to increase more gradually, allowing the targeted tissue more time to dissipate the heat through diffusion and convection. At the region of abs-B (around 1980 nm), where the absorption coefficient is the highest in the wavelength range of this study, a short duration, and intensity optical pulse would create a high-temperature gradient. Thus this paper suggests the 1490 nm wavelength as the optimum choice for blocking or inhibition, and a short and high amplitude pulse at1980nm as optimum for neural activation. Finally, three regions of wavelengths (pen-A, B and C) are indicated in fig. 10 as suitable for allowing the optical power to reach specific depths (around 2mm, 1mm and 0.5mm respectively) inside the nerve bundle. The appropriate selection could facilitate fascicle selectivity, i.e. the distinct stimulation of deep fibres and superficial fibres separately.
IV. CONCLUSIONS
Given an increasing interest in optical nerve stimulation, the previously unmet need to determine how optical parameters affect neural tissue was addressed experimentally and through simulations in this paper. Studies in the field have been using a range of wavelengths to demonstrate peripheral nerve stimulation using light, with these wavelengths being selected empirically or with a certain degree of ambiguity. Here, the complex refractive index of the sciatic nerve ofXenopus laevis was determined for the first time and optimum wavelengths are proposed for optimising the potential therapeutic effects of infrared nerve stimulation. The scope of this paper was to determine the optical properties of the Xenopus laevis sciatic nerve, as it is the most common neural tissue used in peripheral neurostimulation ex-vivo experiments. The authors’ intention was not to create an all encompassing reference. As such additional nerve diameters, tissue inhomogeneity effects or tissue samples from other species, although useful, were outside the aim of this work.
from outside and within the sample into account and the finite thickness of the sample is also taken into consideration. A Newton’s iterative method is used to calculate the optical constants for the Reflectance (R) and Transmittance (T) from the spectrophotometer thus improving the accuracy of the result.
Using the optical constants, the reflected power from the nerve interface is calculated and the optimum wavelength range where the reflected power is minimised was identified. Similarly, the absorbance characteristics of neural tissue were determined and the optimum wavelength where the optical absorption is maximised was identified. Finally, the penetra-tion depth of optical stimuli was determined for the entire wavelength range considered and several suitable localised ranges were identified, that would be beneficial for optical stimulation of deep fibres.
Thus, the optimum wavelengths that can be used for optical stimulation of peripheral nerves either for nerve activation, for inhibition or for blocking were identified.
ACKNOWLEDGMENT
The authors would like to thank EPSRC (Grant ref.: EP/N008499/1) for supporting the work and Prof. Ronald Douglas, City, University of London, for the invaluable support and advice.
REFERENCES
[1] E. J. Bradbury, L. D. Moon, R. J. Popat, V. R. King, G. S. Bennett, P. N. Patel, J. W. Fawcett, and S. B. McMahon, “Chondroitinase abc promotes functional recovery after spinal cord injury,”Nature, vol. 416, no. 6881, p. 636, 2002.
[2] F. Fregni, P. S. Boggio, M. C. Lima, M. J. Ferreira, T. Wagner, S. P. Rigonatti, A. W. Castro, D. R. Souza, M. Riberto, S. D. Freedman, et al., “A sham-controlled, phase ii trial of transcranial direct current stimulation for the treatment of central pain in traumatic spinal cord injury,”Pain, vol. 122, no. 1-2, pp. 197–209, 2006.
[3] N. Hoshimiya, A. Naito, M. Yajima, and Y. Handa, “A multichannel fes system for the restoration of motor functions in high spinal cord injury patients: a respiration-controlled system for multijoint upper extremity,” IEEE Trans. Biomed. Eng., vol. 36, no. 7, pp. 754–760, 1989. [4] H. H. M¨uller, S. Moeller, C. L¨ucke, A. P. Lam, N. Braun, and
A. Philipsen, “Vagus nerve stimulation (vns) and other augmentation strategies for therapy-resistant depression (trd): Review of the evidence and clinical advice for use,”Front. neurosci., vol. 12, p. 239, 2018. [5] D. R. Merrill, M. Bikson, and J. G. Jefferys, “Electrical stimulation of
excitable tissue: design of efficacious and safe protocols,”Journal of neuroscience methods, vol. 141, no. 2, pp. 171–198, 2005.
[6] C. Tai, W. C. De Groat, and J. R. Roppolo, “Simulation analysis of conduction block in unmyelinated axons induced by high-frequency biphasic electrical currents,”IEEE Trans. Biomed. Eng., vol. 52, no. 7, pp. 1323–1332, 2005.
[7] A. Guilvard, A. Eftekhar, S. Luan, C. Toumazou, and T. G. Con-standinou, “A fully-programmable neural interface for polar, multi-channel stimulation strategies,” inIEEE ISCAS, 2012, pp. 2235–2238, IEEE, 2012.
[8] J. H. Kim, J. B. Davidson, O. R¨ohrle, T. K. Soboleva, and A. J. Pullan, “Anatomically based lower limb nerve model for electrical stimulation,” Biomedical engineering online, vol. 6, no. 1, p. 48, 2007.
[9] G. Loeb and R. Peck, “Cuff electrodes for chronic stimulation and recording of peripheral nerve activity,”Journal of neuroscience methods, vol. 64, no. 1, pp. 95–103, 1996.
[10] F. Wu, E. Stark, M. Im, I.-J. Cho, L. Tien, F. Chen, E.-S. Yoon, G. Buzsaki, D. Kaplan, J. Berke,et al., “Implantable neural probes for chronic electrical recording and optical stimulation,” inElectron Devices Meeting (IEDM), 2013 IEEE International, pp. 8–6, IEEE, 2013. [11] I. F. Triantis, A. Demosthenous, and N. Donaldson, “On cuff imbalance
and tripolar eng amplifier configurations,” Biomedical Engineering, IEEE Transactions on, vol. 52, no. 2, pp. 314–320, 2005.
[12] D. Tepper, “Transcutaneous supraorbital neurostimulation (tsns),” Headache: The Journal of Head and Face Pain, vol. 54, no. 8, pp. 1415– 1416, 2014.
[13] H.-M. Lee, K. Y. Kwon, W. Li, and M. Ghovanloo, “A power-efficient switched-capacitor stimulating system for electrical/optical deep brain stimulation,”IEEE J. Solid-State C., vol. 50, no. 1, pp. 360–374, 2015. [14] Y. Kobayashi, K. Oshima, and I. Tasaki, “Analysis of afferent and efferent systems in the muscle nerve of the toad and cat,”The Journal of physiology, vol. 117, no. 2, p. 152, 1952.
[15] C. A. Miller, P. J. Abbas, C. J. Brown,et al., “An improved method of reducing stimulus artifact in the electrically evoked whole-nerve potential,”Ear and hearing, vol. 21, no. 4, pp. 280–290, 2000. [16] O. Yizhar, L. E. Fenno, T. J. Davidson, M. Mogri, and K. Deisseroth,
“Optogenetics in neural systems,”Neuron, vol. 71, no. 1, pp. 9–34, 2011. [17] A. R. Duke, J. M. Cayce, J. D. Malphrus, P. Konrad, A. Mahadevan-Jansen, and E. D. Mahadevan-Jansen, “Combining electrical and optical techniques to develop a novel modality for neural activation,” inBiomed. Sci. Eng. Conf. (BSEC), 2010, pp. 1–4, IEEE, 2010.
[18] A. R. Duke, E. Peterson, M. A. Mackanos, J. Atkinson, D. Tyler, and E. D. Jansen, “Hybrid electro-optical stimulation of the rat sciatic nerve induces force generation in the plantarflexor muscles,”Journal of neural engineering, vol. 9, no. 6, p. 066006, 2012.
[19] A. R. Duke, M. W. Jenkins, H. Lu, J. M. McManus, H. J. Chiel, and E. D. Jansen, “Transient and selective suppression of neural activity with infrared light,”Scientific reports, vol. 3, 2013.
[20] J. Zhang, F. Laiwalla, J. A. Kim, H. Urabe, R. Van Wagenen, Y.-K. Song, B. W. Connors, and A. V. Nurmikko, “A microelectrode array incorporating an optical waveguide device for stimulation and spatiotemporal electrical recording of neural activity,” inEngineering in Medicine and Biology Society, 2009. EMBC 2009. Annual International Conference of the IEEE, pp. 2046–2049, IEEE, 2009.
[21] J. Wells, C. Kao, P. Konrad, T. Milner, J. Kim, A. Mahadevan-Jansen, and E. D. Mahadevan-Jansen, “Biophysical mechanisms of transient optical stimulation of peripheral nerve,” Biophysical journal, vol. 93, no. 7, pp. 2567–2580, 2007.
[22] Z. Mou, I. F. Triantis, V. M. Woods, C. Toumazou, and K. Nikolic, “A simulation study of the combined thermoelectric extracellular stimula-tion of the sciatic nerve of the xenopus laevis: the localized transient heat block,” Biomedical Engineering, IEEE Transactions on, vol. 59, no. 6, pp. 1758–1769, 2012.
[23] M. G. Shapiro, K. Homma, S. Villarreal, C.-P. Richter, and F. Bezanilla, “Infrared light excites cells by changing their electrical capacitance,” Nature communications, vol. 3, p. 736, 2012.
[24] S. Luan, I. Williams, K. Nikolic, and T. G. Constandinou, “Neuromod-ulation: present and emerging methods,”Frontiers in neuroengineering, vol. 7, p. 27, 2014.
[25] A. J. Saubermann and V. L. Scheid, “Elemental composition and water content of neuron and glial cells in the central nervous system of the north american medicinal leech (macrobdella decora),”Journal of Neurochemistry, vol. 44, no. 3, pp. 825–834, 1985.
[26] T. G. Mayerh¨ofer, H. Mutschke, and J. Popp, “Employing theories far beyond their limits—the case of the (boguer-) beer–lambert law,” ChemPhysChem, vol. 17, no. 13, pp. 1948–1955, 2016.
[27] R. Kitamura, L. Pilon, and M. Jonasz, “Optical constants of silica glass from extreme ultraviolet to far infrared at near room temperature,” Applied optics, vol. 46, no. 33, pp. 8118–8133, 2007.
[28] S. Ringer, “Regarding the action of hydrate of soda, hydrate of ammonia, and hydrate of potash on the ventricle of the frog’s heart,”The Journal of physiology, vol. 3, no. 3-4, pp. 195–202, 1882.
[29] R. Phillips, “A numerical method for determining the complex refractive index from reflectance and transmittance of supported thin films,” Journal of Physics D: Applied Physics, vol. 16, no. 4, p. 489, 1983. [30] M.-H. Chiu, J.-Y. Lee, and D.-C. Su, “Complex refractive-index
mea-surement based on fresnel’s equations and the uses of heterodyne interferometry,”Applied optics, vol. 38, no. 19, pp. 4047–4052, 1999. [31] F. Padera, “Measuring absorptance (k) and refractive index (n) of thin
films with the perkinelmer lambda 950/1050 high performance uv-vis/nir spectrometers,”PerkinElmer Inc.: App. note: UV/Vis Spectroscopy, 2013. [32] M. A. Almadi, “Optical properties measurements of rat muscle and myocardium at 980 and 1860 nm using single integrating sphere technique,” 2014.
[33] W. Jiang, M. Almadi, N. Salas, and S. Rajguru, “Optical properties of biological tissues measured at infrared wavelengths,” inBiomedical Optics, pp. BT3A–42, Optical Society of America, 2014.
[34] J. Nocedal and S. J. Wright,Nonlinear Equations. Springer, 2006. [35] S. L. Jacques, “Optical properties of biological tissues: a review,”