1
Effect of Strain Level on The Evolution of Microstructure in a recently developed AD730 Nickel Based Superalloy During Hot Forging
T. Konkova1,2,3,*, S. Rahimi1, S. Mironov4, T.N. Baker5
1Advanced Forming Research Centre (AFRC), University of Strathclyde, 85 Inchinnan Drive,
Inchinnan, PA4 9LJ United Kingdom
2Department of Design, Manufacture and Engineering Management, University of Strathclyde, 75
Montrose Street, Glasgow, G1 1XJ, United Kingdom
3Institute for Metals Superplasticity Problems, Russian Academy of Science, 39 Khalturin Str., Ufa,
450001, Russian Federation
4Department of Materials Processing, Graduate School of Engineering, Tohoku University, 6-6-02
Aramaki-aza-Aoba, Sendai 980-8579, Japan
5Department of Mechanical and Aerospace Engineering, University of Strathclyde, 75 Montrose Street,
Glasgow, G1 1XJ, United Kingdom
[email protected]; [email protected]; [email protected]; [email protected]; [email protected]
Abstract
Design and control of microstructure of engineering parts made from nickel based superalloys with superior mechanical properties for high temperature applications, require the parts to be subjected to certain thermo-mechanical processing during forging. This often includes sequential straining and annealing at elevated temperatures followed by subsequent aging heat treatments at lower temperatures. In this study, the effect of strain magnitude on the evolution of microstructure during hot forging of a recently developed AD730 nickel based superalloy has been investigated. Microstructural heterogeneity was observed in a forged material manifested in a form of large non-recrystallized grains within the recrystallized matrix that is observed to be dependent on the level of deformation (i.e. strain magnitude). Analyses of microstructure indicated significant reduction in the fraction of low-angle grain boundaries and sub-structures with an increase in the applied strain, suggesting higher fraction of recrystallization with higher levels of strains. It was concluded that the lower strain levels were insufficient to provide enough driving force for complete recrystallization throughout the entire microstructure of the forged material.
Keywords: Nickel-based superalloy; Hot forging; Electron backscatter diffraction; Grain structure; Recrystallization.
2
Introduction
The safety and integrity of engineering components and structures are dependent on our ability to predict material behaviour on the basis of robust physical principles. While the geometry, final shape and external loads acting on a certain part are vitally important, there are other contributory factors such as unfavourable microstructure, pre-existing defects and flaws affecting performance of a part in service. Unfavourable microstructure such as grain size heterogeneities and non-uniform distribution of microstructural features, originating from the forging operations of the manufacturing process, can be susceptible to crack initiation or favourable to crack propagation and lead to unexpected failures. Hence, a clear understanding of microstructural evolutionary mechanisms during manufacturing processes is crucially important to design a microstructure to withstand the critical environmental and operation conditions.
Critical rotating parts, such as discs used in jet propulsion and power generation plants, acquire their mechanical strength through a combination of thermal and mechanical processing and heat treatments. Manufacturing of turbine discs made from nickel based superalloys often involves sequential processes of forging, quenching, heat treatment and machining. The forging and heat treatment cycles areof considerable importance, determining the microstructural evolution and strengthening mechanisms which allow the material to achieve its required final mechanical properties [1]. AD730 is a class of high strength nickel based superalloy that has recently been developed by Aubert & Duval for turbine disc applications in jet engines which is capable of operating at elevated temperatures (~700℃) whilst remaining comparatively low in cost compared to the most affordable grades such as IN718 or UD720 [2]. The increase in the operation temperature of a gas turbine engine is associated with higher fuel efficiency, which is desirable for commercial airplane manufacturers [3]. There are of course other grades of high strength nickel based superalloys such as René88DT, N18, RR1000 that are capable of operating at high temperatures. However, the powder metallurgy (P/M) manufacturing process used in the production of these alloys makes them uneconomical and also difficult to produce [4].
3
of chromium, cobalt, iron, titanium, molybdenum, tungsten and smaller fractions of niobium and aluminium in its chemical composition [4]. The high temperature mechanical strength of this alloy is owing to the precipitating γ´ phase based on Ni3(Al, Ti) with FCC crystal structure coherent with the γ matrix [6].
First-generation of P/M superalloys (e.g. Rene 95) were designed with γ´ volume fractions about ∼55% and fine grain size of ∼10 μm, to achieve maximum tensile strength [3]. Lower γ´ volume fractions were obtained in the second-generation P/M superalloys (such as Rene 88DT), whereas high γ´ volume fractions were obtained in the third-generation alloys designed (such as ME3 and LSHR) [3]. AD730’s final alloy design was found to have a calculated γ´ fraction of 37% at 700ᵒC, mid-way between Ni30 and Ni33 with 35% and 39%, respectively. The design of AD730 and the results obtained on full scale production are presented elsewhere [4].
The hot workability of AD730 in comparison with similar existing alloys (e.g. Waspaloy and U720Li) has been shown to be higher [4]. Long-term aging, in excess of 3000 hours at 750ᵒC, leads to a slight coarsening of the secondary γ´ precipitates and a slight decrease in strength. Tensile and creep properties were found to be significantly higher than those of IN718Plus, and slightly higher than those of U720Li [4]. In an alternative study, the influence of heat treatment at different temperatures and for various duration on γ´ precipitation and the resulting mechanical properties, were investigated [7]. A peak in strength at an aging temperature close to 730 ᵒC was observed. Above this temperature, aging resulted in a slight decrease in tensile strength.
4
2. Experimental Procedure
Materials and Processing
The as-received material† was produced through a triple melt-casting and
wrought manufacturing method in a form of an industrial billet, by Aubert & Duval. Details about size of the initial billet are a property of the manufacturer and cannot be provided in this manuscript. The nominal chemical composition of the material is presented in Table 1 [5]. The chemistry of AD730 is similar to those of Ni30 and Ni33 [4]. The presence of iron and the control of expensive elements (e.g. cobalt) makes AD730 relatively cheaper, compared to other superalloys [4].
Table 1. Nominal chemical composition of the AD730 provided by the manufacturer.
Ni Fe Co Cr Mo W Al Ti Nb B C Zr
Wt, % base 4 8.5 15.7 3.1 2.7 2.25 3.4 1.1 0.01 0.015 0.03
Three cylindrical samples, two with identical dimensions of 75 mm in height and 60 mm in diameter, and the other with dimensions of 180 mm in height and 60 mm in diameter were machined from the centre of the initial billet with their axial axes parallel to the cogging direction (CD). In an analogy to the actual forging process, samples were preheated to 1070oC for 1 hour, followed by hot
forging in ambient atmosphere with 5 mm/s press upper die speed, and then cooled in air to the room temperature in a controlled manner (i.e. ≈ 1 oC/s).
Forging was performed on a hydraulic press‡ with flat dies, being preheated to
800 oC, to different levels of height reductions (i.e. strain level) for different
samples. This had resulted in different strain levels of e = 0.5, e = 0.9, and e = 3 for different samples. The forged samples were then sectioned in half, parallel to the CD, followed by microstructure investigations. The areas of observations in this study are regions in the centre of each sample that underwent the highest level of deformation at relatively similar strain rates during the forging process. Information on strain rate and its dependency on the level of deformation (i.e. strain) has been obtained by conducting finite element analyses using mechanical properties for the same material.
†The material used in this study is still in its development stage and hence not considered as a final state
material for industrial application.
5
Microstructure Characterization
Microstructural analyses and texture measurements were carried out using optical microscopy (OM), and scanning electron microscopy (SEM) based techniques including electron back-scattered diffraction (EBSD) and energy dispersive spectroscopy (EDS). For these analyses, samples were prepared using conventional metallographic techniques including grinding and polishing to a mirror finished condition. The samples were then subjected to a final vibratory polishing using colloidal silica suspension. The acquisition of EBSD maps was undertaken using a fully automated HKL-EBSD system interfaced to a FEI Quanta-250 field-emission gun scanning electron microscope, with an accelerating voltage of 20 kV and a 100 µm dia. aperture. The acquisition time was set to 40 ms, collecting at least 1 frame for each point. Orientation mappings were performed in the middle of the cross sections precisely in the centre of the forged cylindrical samples along the axial and cogging directions, i.e. in the area of maximum strain, with 1 µm step size covering an area of 2.5 mm × 0.5 mm. Additionally, individual high resolution maps with 0.5 µm step size and 200 µm × 180 µm area each, were obtained from regions containing non-recrystallized grains in the vicinity of the centreline of each sample.In all cases, a minimum of 80% of the scanned areas was indexed. Data were acquired and processed using Channel 5 HKL software, and a standard clean-up procedure was applied. For the data processing, a lower limit boundary-misorientation cut-off of 2o was used,
and grain boundaries were divided into low angle grain boundaries (LAB) and high angle grain boundaries (HAB) considering 10o angle as a threshold. Grains
were defined as crystallites encompassed by a continuous HAB perimeter. Total number of 32564, 19486, and 16331 grains were indexed for the samples strained for e=0.5, e=0.9, and e=3, respectively. Equivalent grain diameter was calculated by determining the area of each grain using a standard grain reconstruction module of the HKL software.
The fraction of recrystallized grains was estimated by applying the grain reconstruction function of the HKL software using defined parameters followed by measurements of the internal average misorientation angle within grains. If the average angle in a grain exceeded the minimum angle to define a subgrain (i.e. θc=2°), the grain was classified as being “deformed”. Some grains consisted
of subgrains with internal misorientation under θc; however the misorientation
from subgrain to subgrain was above θc. In that case, the grain was considered as
“substructure”. All the remaining grains falling out with the above categories were classified as “recrystallized”.
6
SEM as that of the EBSD acquisition. These analyses were performed on various zones of the samples, including areas with non-recrystallized grains, to investigate the variation of chemical compositions across these regions. Chemical compositions in two main regions including the internal areas of non- recrystallized grains and the surrounding regions (i.e. recrystallized matrix) were analysed and compared.
Following the EBSD and EDS acquisitions, the surface was etched with a mixture of HNO3 and HCl, with a 3:6 ratio, for 5 seconds and inspected by OM.
Metallographic studies including γ´-particle size across the surfaces of all samples, forged to different levels of strain, were carried out using an Olympus GX51 inverted optical microscope, and a Leica STP 6000 microscope equipped with an image analysis software. The ImageJ software was used for thresholding and also for the calculation of γ´ particle’s size and distribution. At least 5 optical micrographs were analysed for each microstructure.
3. Results and discussion
3.1. Microstructure
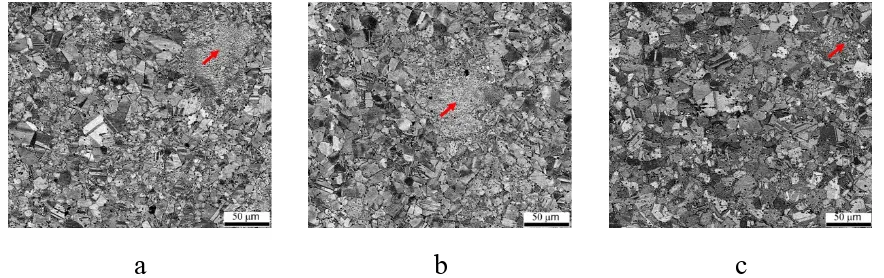
Figure 1 shows the SEM micrographs of the as-forged material deformed for different levels of strain. In these micrographs, various microstructural features including recrystallized grains, grain boundaries, twins, grains with significantly larger sizes, and γ´ particles can be observed. The large grains with abnormal grain sizes, highlighted by arrows in Figure 1, are the areas that are not recrystallized during the forging process.
a b c
Figure 1. SEM micrographs of the as-forged microstructures deformed for different levels of strain a) e = 0.5, b) e = 0.9, and c) e = 3.
[image:6.595.77.519.491.630.2]7
a b c
Figure 1. (a-b) Image analysis used for calculation of γ´ precipitates size and distribution, and (c) plots of γ´ precipitates size distribution in the as-forged AD730 material after different levels of strain.
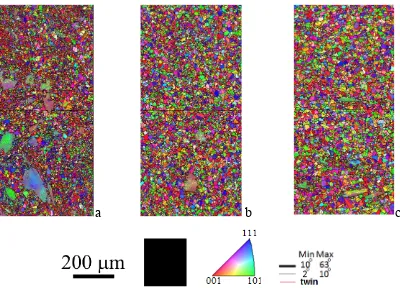
Figure 3 shows the orientation image maps (OIM) using inverse pole figure (IPF) colouring with respect to the CD from the highly strained zones of the as hot-forged samples, illustrating the microstructures after three different levels of deformation.
a b c
Figure 3. EBSD IPF colouring maps with respect to the CD of the as hot-forged microstructures deformed to strain levels of (a) e = 0.5, (b) e = 0.9, and (c) e = 3.
It is apparent that the as-forged microstructures have bimodal grain distributions consisting of near-equiaxed recrystallized grains dominating the microstructures, and large non-recrystallized grains having a lower frequency of
a b c
Figure 1. EBSD IPF colouring maps with respect to the CD of the as hot-forged microstructures deformed to strain levels of(a) e = 0.5, (b) e = 0.9, and (c) e = 3.
=2 00 µ m ; A ll Eu le r; S te p=1 µ m ; G rid 10 00 x50 0 =2 00 µ m ; A ll Eu le r; S te p=1 µ m ; G rid 10 00 x50 0 =2 00 µ m ; A ll Eu le r; S te p=1 µ m ; G rid 10 00 x50 0
a b c
Figure 1. EBSD IPF colouring maps with respect to the CD of the as hot-forged microstructures deformed to strain levels of (a) e = 0.5, (b) e = 0.9, and (c) e = 3.
[image:7.595.80.520.71.208.2] [image:7.595.102.502.352.640.2]8
occurrence with increased strain level. The average grain size of the equiaxed recrystallized grains are 3.8 µm, 5 µm and 5.4 µm respectively for the samples with 0.5, 0.9 and 3 strain levels, and those of the non-recrystallized grains are 65 µm, 54 µm and 38 µm, respectively.
9
Figure 4. Distributions of γ grain size in the as-forged AD730 material after different levels of strain.
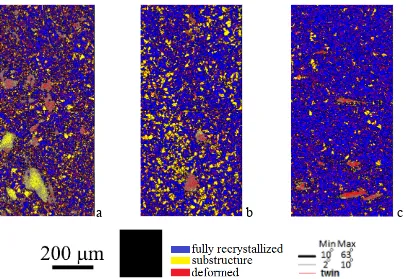
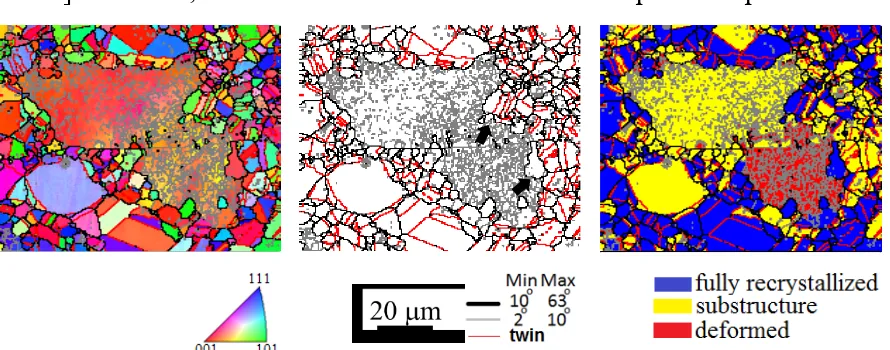
In support of the above observations, Figure 5 shows the EBSD colour maps of the as-forged microstructures with the fractions of recrystallized, non-recrystallized and deformed zones presented in different colours. The variations in the fraction of these zones as a function of applied deformation level are shown in Figure 6.
a b c
Figure 5. EBSD maps of the as-forged microstructures deformed to (a) e = 0.5, (b) e = 0.9 and (c) e = 3 strains, with the recrystallized and non-recrystallized zones highlighted in different colours. HABs, LABs and twin boundaries (i.e. Σ3) are shown by solid black lines, thin grey lines and red lines, respectively. Note that the substructures (i.e. LAB’s) are primarily associated with the non-recrystallized zones.
a b c
Figure 1. EBSD maps of the as-forged microstructures deformed to (a) e = 0.5, (b) e = 0.9 and (c) e = 3 strains, with the recrystallized and non-recrystallized zones highlighted in different. HABs, LABs and Σ3 are shown by solid black lines, thin grey lines and red lines, respectively. Note that the substructures (i.e. LAB’s) are primarily associated with the non-recrystallized zones.
=2 00 µ m ; A ll Eu le r; S te p=1 µ m ; G rid 10 00 x50 0 =2 00 µ m ; A ll Eu le r; S te p=1 µ m ; G rid 10 00 x50 0 =2 00 µ m ; A ll Eu le r; S te p=1 µ m ; G rid 10 00 x50 0
a b c
Figure 1. EBSD IPF colouring maps with respect to the CD of the as hot-forged microstructures deformed to strain levels of(a) e = 0.5, (b) e = 0.9, and (c) e = 3.
=2 00 µ m ; A ll Eu le r; S te p=1 µ m ; G rid 10 00 x50 0 =2 00 µ m ; A ll Eu le r; S te p=1 µ m ; G rid 10 00 x50 0 =2 00 µ m ; A ll Eu le r; S te p=1 µ m ; G rid 10 00 x50 0
a b c
Figure 1. EBSD IPF colouring maps with respect to the CD of the as hot-forged microstructures deformed to strain levels of (a) e = 0.5, (b) e = 0.9, and (c) e = 3.
[image:9.595.101.507.351.630.2]10
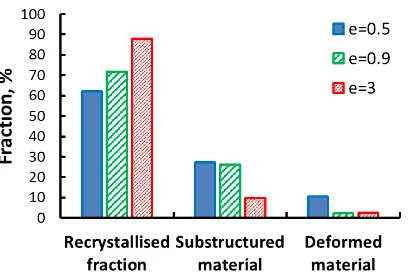
Figure 6. Dependency of the fraction of recrystallized grains on strain level in the as-forged AD730 material.
[image:10.595.73.527.510.635.2]Figure 6 and Table 2 show that an increase in the deformation level from e = 0.5 to e = 3 has resulted in ≈ 30% more recrystallized fraction (i.e. from 62 % to 88 %), and significantly lower fractions of sub-structures and deformed zones that are associated with the non-recrystallized regions. Progress in recrystallization with an increase in strain was observed in previous studies [10, 11]; it was shown that some of the original grain boundaries exhibited local bulges, some of which appeared to have been transformed into fine equiaxed grains. This effect was apparent even after a relatively small deformation (e ≈ 0.5). It became more pronounced with higher strain levels when the fraction of fine equiaxed grains increased noticeably, and a “necklace” microstructure has developed [9].
Table 2. Fraction of recrystallized material.
Strain level
Recrystallized fraction, %
Substructured material, %
Deformed material, %
e = 0.5 62 27 11
e = 0.9 72 26 2
e = 3 88 10 2
11
strain for the start of recrystallization throughout the microstructure is e ≈ 1-1.5, bearing in mind that the strain experienced by each grain is not necessarily identical to the applied effective strain due to strain localisation in polycrystalline materials. This is because some grains are favourably orientated to the direction of the applied load and hence undergo more deformation than those oriented in other directions and vice versa [9]. Hence, in the material with low effective strain, the number of grains with strains below the threshold strain for recrystallization is higher.
It is also noticeable (see Figure 7) that the boundaries of non-recrystallized grains exhibit local bulges (highlighted by arrows in Figure 7) indicating the progress of recrystallization from neighbouring grains. The formation of these grain boundary bulges followed by appearance of very fine grains on these boundaries satisfies the definition of discontinuous recrystallization controlled by nucleation and growth due to the migration of boundaries [9]. The appearance of equiaxed grains along the original grain boundaries of non-recrystallized zones (see Figure 7), constructing a “necklace”-type structure, is a reminiscent of discontinuous recrystallization [12].
The EBSD results showed also that some segments of LABs accumulated a misorientation in excess of 10o and transformation to HABs was observed. In
other words, the continuous recrystallization (CDRX) also took place in present case. CDRX is associated with subgrain rotation leading to transformation of LABs into HABs, and was recently observed in hot deformed nickel superalloys [13-16]. However, the strain level was insufficient to complete this process.
Figure 7. An example of EBSD map of a non-recrystallized zone in the as-forged material deformed for e = 0.5 strain. HABs, LABs and Σ3 are shown by solid black lines, thin grey lines and red lines, respectively.
A reduction in number and also the size of the non-recrystallized grains with an increase in strain level is an evidence of necessity of sufficient strain level
[image:11.595.78.523.483.658.2]12
to overcome the required strain threshold in every pre-forged grain to complete recrystallization throughout the entire microstructure. Hence this is why the material with highest applied strain acquired a rather more homogeneous microstructure compared to those of the materials with lower strain levels.
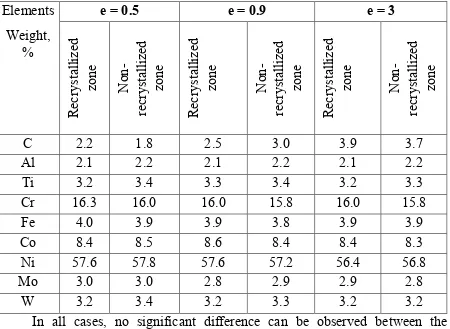
[image:12.595.76.526.234.563.2]The results of elemental analyses carried out by EDS on different zones of the as-forged microstructures, including the recrystallized matrix and non-recrystallized grains, are presented in Table 3.
Table 3. Elemental analysis of the as-forged material using EDS technique.
Elements
Weight, %
e = 0.5 e = 0.9 e = 3
Recry
st
al
li
ze
d
zo
ne
N
on
-recrys
tal
li
ze
d
zo
ne
Recry
st
al
li
ze
d
zo
ne
N
on
-recrys
tal
li
ze
d
zo
ne
Recry
st
al
li
ze
d
zo
ne
N
on
-recrys
tal
li
ze
d
zo
ne
C 2.2 1.8 2.5 3.0 3.9 3.7
Al 2.1 2.2 2.1 2.2 2.1 2.2
Ti 3.2 3.4 3.3 3.4 3.2 3.3
Cr 16.3 16.0 16.0 15.8 16.0 15.8
Fe 4.0 3.9 3.9 3.8 3.9 3.9
Co 8.4 8.5 8.6 8.4 8.4 8.3
Ni 57.6 57.8 57.6 57.2 56.4 56.8
Mo 3.0 3.0 2.8 2.9 2.9 2.8
W 3.2 3.4 3.2 3.3 3.2 3.2
In all cases, no significant difference can be observed between the measured chemical compositions of the recrystallized matrix and those of the large non-recrystallized grains. These analyses show that the recrystallization behaviour has not been influenced by the chemical composition, and it is likely that the local strain level is more influential.
3.2. Misorientation Angle Distribution
13
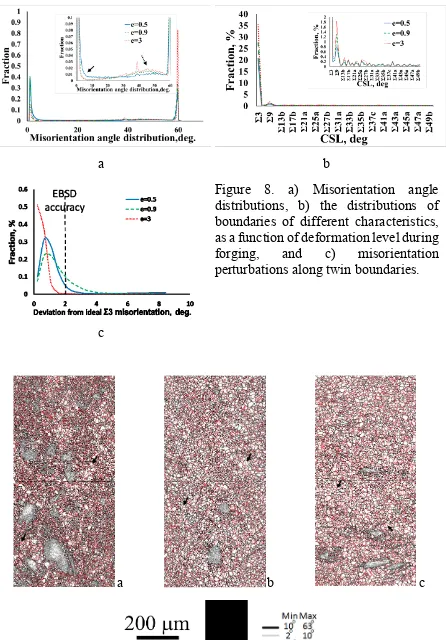
show similar trends, all with two large peaks, one around 2-5° misorientation angle and the other close to 60° (highlighted by arrows in Figure 8a). The peak around 2-5° misorientation angle is due to the high fractions of LABs and sub-structures in the as-forged materials with that of the e = 0.5 strain level being the highest. This is consistent with the observations presented earlier as the LABs are mainly associated with the non-recrystallized zones and the frequency of occurrence of these zones were the highest in the microstructure with the lowest strain (i.e. e = 0.5). The other peak in the misorientation angle distribution plots correspond to the 60° (∑3) misorientation, that is a characteristic of twin boundaries [17]. The increase in the fraction of ∑3 twin boundaries with higher level of strain (see Figure 8a) is due to twinning mechanism taking place during forging as similar to those observed in thermo-mechanically processed materials [18, 19] with low stacking fault energy. A significant fraction of the ∑3 twin boundaries, highlighted in red in Figure 9, are straight lines, dividing the grains into sub-grains, which is a characteristic of coherent twin boundaries with {111} boundary plane. On the other hand, a significant fraction of ∑3 boundaries are not in form of straight lines, but rather in forms of bulged boundaries and small segments (see Figure 9). In this case Σ3 boundary is the incoherent type of twin having the {112} boundary plane, that is highly mobile.
14
a b
c
Figure 8. a) Misorientation angle distributions, b) the distributions of boundaries of different characteristics, as a function of deformation level during forging, and c) misorientation perturbations along twin boundaries.
a b c
Figure 9. High-resolution EBSD maps of the as-forged AD730 material after different levels of deformation: (a) e = 0.5, (b) e = 0.9 or (c) e = 3.
a a a b b b c c c
a b c
Figure 1. EBSD IPF colouring maps with respect to the CD of the as hot-forged microstructures deformed to strain levels of(a) e = 0.5, (b) e = 0.9, and (c) e = 3.
=2 00 µ m ; A ll Eu le r; S te p=1 µ m ; G rid 10 00 x50 0 =2 00 µ m ; A ll Eu le r; S te p=1 µ m ; G rid 10 00 x50 0 =2 00 µ m ; A ll Eu le r; S te p=1 µ m ; G rid 10 00 x50 0
a b c
Figure 1. EBSD IPF colouring maps with respect to the CD of the as hot-forged microstructures deformed to strain levels of (a) e = 0.5, (b) e = 0.9, and (c) e = 3.
[image:14.595.79.525.67.707.2]15
The reduction in the peak of the low (2-5o) to moderate (10-20o)
misorientation angles, as well as the shift of the peak to lower angles with higher strain levels (highlighted on Figure 8a), indicate the lower frequency of the non-recrystallized zones with increased deformation. Elimination of the LABs by migrating grain boundaries led to a decrease in total LABs fraction (Table 4) with a simultaneous increase in the HABs, in particular 25-55o (dotted arrow on Figure
8a). This is in a good agreement with the observations made by optical microscopy and OIM. Similar behaviour was observed in a hot isostatically processed nickel based superalloy [26].
Table 4. Dependency of the volume fraction of grain boundaries of different characteristics on the applied strain level in the as-forged AD730 microstructures.
Strain level
HAB fraction, %
LAB fraction, %
Σ3 (within Brandon interval), %
e = 0.5 58 42 21
e = 0.9 70 30 28
[image:15.595.96.499.279.401.2]e = 3 87 13 35
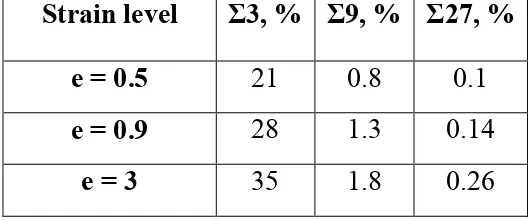
Table 5. Evolution of twins (Σ3) and twin variants (Σ9 and Σ27) volume fractions as functions of strain level in the as-forged AD730 microstructures.
Strain level Σ3, % Σ9, % Σ27, %
e = 0.5 21 0.8 0.1
e = 0.9 28 1.3 0.14
e = 3 35 1.8 0.26
It is interesting to make a comparison between the fractions of mechanical and annealing twins in the microstructure. It is widely accepted that the misorientation across the boundaries of the mechanical twins may deviate significantly from the ideal twin–matrix misorientation due to the deformation induced crystallographic rotations of the twin and the matrix from their initial orientations [27]. On the other hand, the misorientation across the boundaries of annealing twins is expected to be closer to the ideal 60o rotation about a <111>
[image:15.595.165.430.469.579.2]16
The EBSD data were analysed in terms of the misorientation perturbations along the twin boundaries (within the Brandon interval) for the as-forged samples deformed for different levels of strains, and the results are shown in Figure 8c. Misorientation perturbation is a deviation of boundary misorientation from ideal misorientation relationship which in the case of coherent twin boundary is 60o
around <111>. It is seen that perturbations from the ideal twin misorientation were within the typical accuracy of EBSD (≈ 2o) for all cases. This observation
indicates that the formation of annealing twins was prevalent in all the analysed strain range. This is in a good agreement with the above mentioned discontinuous recrystallization process accompanied by annealing twinning [9].
3.3. Texture
The EBSD maps using IPF colouring presented in Figure 3 for all the as-forged microstructures show no particular dominant orientation. The inverse pole figures (IPF) of all microstructures with respect to the forging direction are shown in Figure 10. These data are derived from the EBSD maps containing ≈ 10000-30000 grains, depending on the level of strain. Figure 10 also provides the standard IPF texture of copper, having FCC crystal structure, deformed to 100% by compression, calculated by Taylor’s model [30] for the aid of comparison. In an attempt to provide an additional insight into the recrystallization process, the microstructure in the EBSD maps were partitioned into recrystallized matrix and non-recrystallized zones. The relevant textural data are shown in Figure 10.
It can be seen that the measured textures are fairly weak with the peak intensity being ~ 1.1-1.3 (see Figure 10a-c) which are nearly random. This effect is obviously attributable to the recrystallization process as well as to the extensive annealing twinning, discussed earlier in the preceding paragraphs. Nevertheless, a pronounced clustering of crystallographic orientations near to the <102> pole at relatively high strains is worthy of comment (shown on Figure 10b-c). This agrees reasonably well with theoretical predictions (Figure 10d) of texture evolution for copper with FCC crystal structure calculated based on Taylor’s model, and perhaps provides evidence that the {hkl}<102> texture tends to form during the strain. Moreover, a weak peak near <001> at true strain of ~ 3 has also been noted (see Figure 10c); this may indicate a development of {100}<001> “cube” texture which is often observed in recrystallized metals with cubic crystal structure [31].
17
recrystallization in these zones and as a result they stay unchanged throughout the forging process. The non-recrystallized areas may be eliminated by increasing the strain level or changing strain path (i.e. different forging directions). Among other routes which might be influential on the recrystallization process, an increase in deformation strain, and an increase in the forging temperature could be mentioned. All of these possible solutions for the problem of non-recrystallized areas will provide an additional energy and might promote gradual involvement of non-recrystallized grains in recrystallization process. A similar approach was applied to IN718 and In718Plus alloys during multiple forging [32]. It was observed that with decreasing strain rate, the average size of the recrystallized grains increased slightly, and a simultaneous increase was observed in the volume of the recrystallized regions. The volume fraction of recrystallized grains decreased with reducing deformation temperature [32]. In a recent report, it was suggested that 1.3 mm/mm is a minimum strain required to achieve 100% recrystallization in V207M nickel base superalloy subjected to isothermal forging [33]. However, the results of this study suggest that similar level of strain (i.e., e = 1-1.5) is not enough to achieve 100% recrystallized grains in the forged AD730. As explained earlier, even the highest level of strain (i.e. e = 3) investigated during the course of this study has not resulted in 100% recrystallized microstructure.
a b c
[image:17.595.83.519.429.648.2]d
18
4. Summary
In this study, a detailed analysis of the evolution of microstructure in the recently developed as-forged AD730 nickel based superalloy deformed for different levels of strains (i.e. e = 0.5, e = 0.9, and e = 3), has been carried out. Due to the recent development of the alloy, knowledge and representative data on the interrelationships between materials processing, mechanical properties and microstructure characteristics, is limited in the literature compared to well-developed grades of high strength nickel based superalloys. The major observations of this work are concluded as follows:
• For all levels of applied strain, areas of large non-recrystallized grains were observed, but with lower frequency of occurrence and smaller average sizes with increased strain level.
• No significant difference was found between the chemical compositions of the non-recrystallized zones and that of the recrystallized matrix.
• The area fraction of recrystallized grains increased with increasing the strain level. Twinning occurred in all microstructures resulted from different strain levels investigated in this study.
Acknowledgements
The authors would like to thank Aubert & Duval (France) for providing the workpiece material. The authors would like to acknowledge the support provided by the Advanced Forming Research Centre (AFRC), which receives partial financial support from the UK’s High Value Manufacturing CATAPULT.
References
[1] S. Rahimi, M. King, C. Dumont, Stress relaxation behaviour in IN718 nickel based superalloy during ageing heat treatments, Mat.Sci.Eng. A (2017). https://doi.org/10.1016/j.msea.2017.09.116.
[2]F. Masoumi, M. Jahazi, D. Shahriari, J. Cormier, Coarsening and dissolution of γ’ precipitates during solution treatment of AD730™ Ni-based superalloy: Mechanisms and kinetics models, J. Alloys Compd. 658 (2016) 981-995. DOI: 10.1016/j.jallcom.2015.11.002
19
[4] A. Devaux, B. Picqué, M.F. Gervais, E. Georges, T. Poulain, P. Héritier, AD730TM -A New NickelBased superalloy for high temperature engine rotative parts. Superalloys 2012: 12th International Symposium on Superalloys, TMS
(2012) 911-919.
[5] Aubert&Duval. URL: https://www.aubertduval.com/alloy/678/ (accessed: 13 October 2017).
[6] C.T. Sims, N.S. Stoloff, W.C. Hagel, Superalloys II. New York: Wiley-Interscience, 1987, 615 p. http://dx.doi.org/10.1080/10426919208947432
[7] A. Devaux, A. Helstroffer, J. Cormier, P. Villechaise, J. Douin, M.Hantcherli, F. Pettinari-Sturmel, Effect of aging heat treatment on mechanical properties of AD730 Superalloy, 8th international symposium on superalloys 718 and derivatives, TMS (2014) 521-535.
[8] A. Devaux, L. Berglin, L. Thebaud, R. Delattre, C. Crozet, O. Nodin, Mechanical properties and development of supersolvus heat treated new nickel base superalloy AD730, MATEC Web of conference 14, 01004 (2014) 1-6.
[9] F.J. Humphreys, M. Hatherly, Recrystallisation and Related Phenomena, second ed., Elsevier, Oxford. 2004, 658 p.
[10] T. Konkova, S. Mironov, A. Korznikov, S.L. Semiatin, Microstructural response of pure copper to cryogenic rolling, Acta Mater. 58 (2010) 5262-5273. DOI: 10.1016/j.actamat.2010.05.056
[11] T. Konkova, S. Mironov, A. Korznikov, S.L. Semiatin, On the room-temperature annealing of cryogenically-rolled copper, Mater. Sci. Eng. A 528 (2011) 7432-7443. DOI: 10.1016/j.msea.2011.06.047
[12] R.D. Doherty, D.A. Hughes, F.J. Humphreys, J.J. Jonas, D. Juul Jensen, M.E. Kassner, W.E. King, T.R. McNelley, H.J. McQueen, A.D. Rollett, Current issues in recrystallization: a review, Mater. Sci. Eng. A 238 (1997) 219-274.
https://doi.org/10.1016/S0921-5093(97)00424-3
[13] H. Zhang, K. Zhang, S. Jiang, H. Zhou, C. Zhao, X. Yang, Dynamic recrystallization behaviour of a γ´ hardened nickel based superalloy during hot
deformation, J. Alloys Compd. 623 (2015) 374-385.
http://dx.doi.org/10.1016/j.jallcom.2014.11.056
20
[15] S. Mitsche, C. Sommitsch, D. Huber, M. Stockinger, P. Poelt, Assessment of dynamic softening mechanisms in Allvac(R) 718Plus(TM) by EBSD analysis,
Mater Sci. Eng. A 528 (2011) 3754-3760.
https://doi.org/10.1016/j.msea.2011.01.044
[16] He Jiang, J. Dong, M. Zhang, L. Zheng, Z. Yao, Hot deformation characteristics of Alloy 617B nickel-based superalloy: A study using processing
map, J. Alloys Compd. 647 (2015) 338-350.
https://doi.org/10.1016/j.jallcom.2015.05.192
[17]C. B. Thomson, V. Randle, “Fine tuning” at ∑3n boundaries in nickel, Acta
Mater. 45 (1997) 4909-4916. https://doi.org/10.1016/S1359-6454(97)00192-4
[18] S. Rahimi, D. L. Engelberg, T. J. Marrow, A new approach for DL-EPR testing of thermo-mechanically processed austenitic stainless steel, Corros. Sci., 53 (2011) 4213–4222. https://doi.org/10.1016/j.corsci.2011.08.033
[19] S. Rahimi, D. L. Engelberg, J. A. Duff, T. J. Marrow, In situ observation of intergranular crack nucleation in a grain boundary controlled austenitic stainless steel, J. Microsc., 233 (2009) 423-431. DOI: 10.1111/j.1365-2818.2009.03133.x
[20] V. Randle, Overview No. 139: Twinning-related grain boundary
engineering, Acta Materialia 52 (2004) 4067-4081.
https://doi.org/10.1016/j.actamat.2004.05.031
[21] V. Randle, Mechanism of twinning-induced grain boundary engineering in low stacking-fault energy materials, Acta Materialia 47 (1999) 4187-4196.
https://doi.org/10.1016/S1359-6454(99)00277-3
[22] V. Randle, The role of the coincidence site lattice in grain boundary engineering, London: Institute of Materials, 1996, 120 p.
[23] D.A. Porter, Phase Transformation in Metals and Alloys, New York: Van Nostrand Reinhold, 1981, 446 p.
[24] V. Randle, Twinning-related grain boundary engineering, Acta Mater. 52 (2004) 4067-4081. https://doi.org/10.1016/j.actamat.2004.05.031
[25] J. Bystrzycki, W. Przetakiewicz, K. J. Kurzydlowski, Study of annealing twins and island grains in f.c.c. alloy, Acta Metallurgica et Materialia 41 (9) (1993) 2639 – 2649.https://doi.org/10.1016/0956-7151(93)90133-D
[26] S.S.S Kumar, T. Raghu, Pinaki P. Bhattacharjee, G. Appa Rao, U. Borah, Strain rate dependent microstructural evolution during hot deformation of a hot isostatically processed nickel base superalloy, J. Alloys Compd. 681 (2016)
21
[27] Ye.V. Nesterova, V.V. Rybin, Mechanical twinning and fragmentation of technically pure titanium during severe plastic deformation, Phys Met Metall. 59 (1985) 169-180.
[28] T. Konkova, S. Mironov, A. Korznikov and S.L. Semiatin, Microstructure instability of cryogenically deformed copper, Scripta Materialia 63 (2010) 921-924. DOI10.1016/j.scriptamat.2010.07.005
[29] T. Konkova, S. Mironov, A. Korznikov, G. Korznikova, M.M. Myshlyaev, S.L. Semiatin, Grain structure evolution during cryogenic rolling of alpha brass, J. Alloys Compd. 629 (2015) 140–147. DOI: 10.1016/j.jallcom.2014.12.241
[30] S. Ahzi and S. M’Guil, A new intermediate model for polycrystalline viscoplastic deformation and texture evolution, Acta Mater. 56 (2008) 5359 – 5369. doi:10.1016/j.actamat.2008.07.007
[31] J. Hirsch, K. Lucke, Mechanism of deformation and development of rolling textures in polycrystalline FCC metals, Acta Metallurgica 36 (1988) 2883-2904. https://doi.org/10.1016/0001-6160(88)90173-3
[32] Sh. Mukhtarov, V. Valitov, M.F.X. Gigliotti, PR Subramanian, J.S. Marte and N. Dudova, Influence of severe thermomechanical treatment on formation of nanocrystalline structure in In718 and Ni718Plus alloys and their mechanical
properties, Mat. Sci. Forum 584-586 (2008) 458-463.
http://doi:10.4028/www.scientific.net/MSF.584-586.458
[33] R.C. Buckingham, C. Argyrakis, M.C. Hardy, S. Birosca, The effect of strain distribution on microstructural developments during forging in a newly developed nickel base superalloy, Mater Sci. Eng. A 654 (2016) 317-328.
![Figure 10. a-c) Inverse pole figures of the as-forged AD730 microstructures deformed for different levels of strain, and d) theoretically calculated IPF of 100% compressed Cu (fcc) [30]](https://thumb-us.123doks.com/thumbv2/123dok_us/1391101.92245/17.595.83.519.429.648/figure-inverse-microstructures-deformed-different-theoretically-calculated-compressed.webp)
