Productive Use of Solar PV in Rural Malawi:
Feasibility Studies
University of Strathclyde and Community Energy Malawi
Aran Eales1, Hannah Buckland1, Damien Frame1
Berias Unyolo2, Chawezi Gondwe2, Morton Kaunda2,
April 2017
1 University of Strathclyde https://strath-e4d.com/
Executive Summary
Productive Uses of Energy are agricultural, commercial and industrial activities involving energy services as a direct input to the production of goods or provision of services. Productive uses include home businesses, non-monetary income, excludes social infrastructure and cuts across different sectors, energy sources, and types of enterprises.
This study focusses on the economic feasibility of a range of businesses in Malawi powered by solar PV. The overall objective is to identify a set of businesses that have the potential to be progressed to pilot projects.
Surveys were carried out on existing electricity using businesses in Dedza, Malawi to determine CAPEX, OPEX and monthly income figures for agricultural, sales and services, and repair and manufacture businesses. Solar PV systems were designed to supply the business loads and then priced using component costs obtained from suppliers. 10 year cash flow forecasts were conducted for 3 business scenarios (strong, stable and weak). Using the modelled profit and loss, the viability of the different businesses powered by solar PV was evaluated.
As shown in the table below, the study has found that irrigation and small sales and services (specifically barber shop and phone charging) businesses powered by standalone PV systems look likely to succeed, with most paying back initial investment under 3 years over all scenarios. Maize milling and tailoring businesses give paybacks of 5 and 8 years for strong and stable scenarios respectively, indicating grant funding would be required to contribute to CAPEX to be affordable for most entrepreneurs in Malawi. A metal workshop business doesn’t recover initial investment within 10 years for any of the scenarios modelled.
The results indicate solar PV has potential to reduce poverty through income generation in Malawi. Recommendations have been given for implementing pilot projects based on the feasibility studies, along with suggestions for future research to inform wider scale dissemination of Solar PV productive use initiatives.
Summary of Economic Feasibility Evaluation
Scenario 1 Scenario 2 Scenario 3 Viability
Businesses Payback (years) 10 year profit (MWK) Payback (years) 10 year profit (MWK) Payback (years) 10 year profit (MWK)
Irrigation 2 6,201,000 3 5,591,000 5 12,981,000 HIGH
Barbershop and Phone Charging
2 2,002,500 2 1,342,500 >10 0 HIGH
Maize mill 5 5,000,000 8 1,548,000 >10 0 MEDIUM
Tailoring 5 602,750 8 122,750 >10 0 MEDIUM
Metal
Contents
1. Introduction ... 4
1.1. Energy Access in Malawi ... 4
1.2. PUE as an Economic and Developmental Driver ... 4
2. Methodology ... 5
2.1. Scope and Overview of this Study ... 5
2.2. Literature Review ... 6
2.3. Surveys on existing businesses in target areas ... 6
2.4. Survey Analysis ... 7
2.5. Selection of Appropriate Areas ... 6
2.6. System Design ... 7
2.7. Resource Assessment ... 8
2.8. Load Profiles ... 8
2.9. Business Economics ... 8
2.10. Business Finance/cash flow ... 8
3. Literature Review ... 8
3.1. PUE Case studies in Malawi ... 8
3.2. Previous studies on PUE in Malawi ... 9
3.3. Challenges to Business Start Up in Malawi ... 11
4. Fieldwork Observations ... 13
4.1 Njonja ... 14
4.2 Chiluzi ... 14
4.3 General Observations ... 14
5. Business Plans ... 15
5.1. Maize Mills ... 15
5.2. Irrigation farming ... 23
5.3. Small Sales and service businesses ... 31
5.4. Repair and Manufacture Businesses ... 40
6. Summary and Conclusions ... 48
6.1. Summary of Results ... 48
6.2. Discussion ... 49
6.3. Limitations to the study ... 49
7. Recommendations and Next Steps ... 50
8. References ... 52
1.
Introduction
1.1.
Energy Access in Malawi
Malawi has one of the most rapidly growing populations in Africa, which has increased from 4 million in 1966 to 17 million today and is expected to reach 26 million by 2030 (NSO 2012). About 85% of Malawians live in rural areas, deriving their livelihoods from natural resources and agriculture. The remaining 15% of the population resides in urban areas and is mainly concentrated in the four cities of Blantyre, Lilongwe, Mzuzu and Zomba (NSO, 2008). Malawi has a high population of young people with about 48% of the population below 15 years of age.
Malawi is one of the least developed countries in the world with a purchasing-power-party (PPP) based Gross Domestic Product (GDP) per capita of about USD 780 in 2013. Agriculture is the mainstay of Malawi’s economy and supports 84.7% of the rural population. It contributes 90% of export earnings and 46% of wage employment and it employees over 80% of the labour force. Agriculture accounts for 27% of the GDP. Other sectors such as Industry and Services account for 18% and 54.2% of the GDP respectively (NEP, 2016).
Malawi has one of the lowest electricity access rates in the Southern African Development Community (SADC) with an average consumption rate of 111 kWh per capita per annum. Access to modern energy services is approximately 8% and comprised of mostly urban households (Zalangera, 2014), while only 1% of the rural population have access to electricity. Electricity in Malawi is faced with various challenges such as inadequate generation capacity and outdated transmission and distribution lines resulting in frequent black-outs and load shedding.
Access to modern energy is widely considered an important ingredient in the strategy towards alleviating poverty and achieving sustainable development goals, specifically Sustainable Development Goal 7. It is recognised that electrification removes bottlenecks for enterprise development and enables new potentials for income generation.
1.2.
Productive Uses of Energy as an Economic and Developmental
Driver
Productive Uses of Energy (PUE) are defined as agricultural, commercial and industrial activities involving energy services as a direct input to the production of goods or provision of services (GIZ, 2016). PUE can be a significant driver of economic growth and social progress in developing countries like Malawi, as they can underpin the creation and upgrading of value chain and facilitate diversification of economic structures. They can also reduce livelihood vulnerability to multiple stresses and external shocks and enhance the commercial viability and financial sustainability of infrastructure investments. PUE can convert into additional sources of income for end-users, increase their ability to pay bills and recoup investment in grid connection/standalone systems as well as increase economic viability of mini-grids through higher load factors (particularly during daytime) and hence offer a baseload and higher revenues for operators. This increases the technical durability of energy infrastructure through an improved operator ability to cover O&M costs and ultimately enhance impact of (rural) electrification.
FIGURE 1STEPSFROMPUETOPOVERTYREDUCTION(ADAPTEDFROMKOOLIJMAN-VANDIJK(2008)
2.
Methodology
2.1.
Scope and Overview of this Study
The study has been carried out by the University of Strathclyde (UoS) and Community Energy Malawi (CEM) and draws on the practical experiences of selected rural communities which have benefited from electricity supply and utilised it for running businesses. It is expected that the results of the PUE study will contribute to clear understanding of the socio-economic dynamics of rural communities in Malawi in terms of PUE. Such knowledge will inform CEM on how to transfer solar PV technologies for PUE to rural communities and the strategies/methodologies therein.
2.2.
Literature Review
The literature review (Section 3) comprises previous case studies of PUE in Malawi, drawing out relevant experiences of businesses being powered by solar PV in rural areas. It goes on to summarise previous market assessment work completed by UoS and CEM determining which businesses are most desired by rural communities, and finishes with a brief overview of challenges faced by businesses in Malawi examining influencing parameter on a national and local scale.
2.3.
Surveys on Existing Electricity Using Businesses
Surveys based on structured questionnaires covering all areas of business activities have been conducted in the target villages. Quantitative data was collected through the structured questionnaires complemented by qualitative information gathered by open interviews with key informants and resource persons in the survey areas. Such additional insights are indispensable to understand the business environment in the villages and to complement the quantitative data. Interviews and surveys were conducted by CEM researchers during field work in September 2016.
The CEM enumerators were responsible for quality control, including consistency and completeness checks, as well as reporting fieldwork observations, methodological problems and pitfalls back to the central study team at UoS. The surveys were conducted in the digital data collection platform kobo collect, with data analysed in Microsoft Excel. The surveys have informed system design and business planning for specific off-grid business scenario planning.
An outline of the surveys can be found in Appendix 1, the data collected in spreadsheet form can be found in Appendix 2. Table 1 outlines the types of businesses targeted for the surveys.
TABLE 1TYPES OF BUSINESSES SURVEYS WERE CONDUCTED ON
Agriculture Small Sales and Services Repair and Manufacture
Maize Milling Barbershop Wood Workshop
Irrigation Entertainment Metal Workshop
Cold Drinks Electronic Repair
Phone Charging Tailoring
2.4.
Selection of Appropriate Areas
Following the success of the PUE pre testing CEM conducted on 12th December 2016 at Bowe trading centre in Dowa district, CEM identified two communities namely: Njonja located south east of Dedza and Chiluzi trading centre located on north east of Dedza.
FIGURE 2CHILUZI TRADING CENTRE
2.5.
Survey Analysis
The results from the surveys were segregated into separate businesses for analysis. Useful anecdotal information has been noted, with key information analysed being Capital start-up costs (CAPEX), monthly operational expenditure (OPEX), and monthly income. Load profiles were gathered and used to inform the system designs.
Where appropriate, box and whisker plots are included which indicate the mean, median and 25 percentiles either side of the mean, with outliers plotted. This gives a clear indication of the spread of answers. Where key average information is required, the Mean is stated with maximum and minimum values.
2.6.
System Design
Following information gained from the surveys on energy use, off grid solar PV systems were designed to supply the loads identified in the business surveys. A system was then specified with a component list to determine the cost of the energy system to run the businesses. More information specific parameters required for system design (load profiles and solar resource) can be found below.
Costs for solar PV systems to power the agricultural loads, specifically Solar Irrigation and Maize Milling were found from the Foundation for Irrigation and Sustainable Development. FISD are a social enterprise with both an NGO and ltd company arms who supply, design and offer consultancy on all matters relating to irrigation (FISD, 2017). FISD offer “ready to go” irrigation and maize milling packages which include solar PV and controls. Costs were obtained during a visit to FISDs offices with CEM and UoS in February 2017.
Small Service and Sales and Repair and Manufacture Systems were designed, specified and costed by CEM who are accredited by the Malawi Energy Regulatory Authority (MERA) to be installers of all types of renewable energy. The following assumptions are included:
30% labour costs on top of capital expenditure for installation. This will depend on transport costs from Lilongwe, where CEM are based, but is assumed to be accurate for the business modelling.
Maintenance cost as 20% of CAPEX, monthly. Again, accurate costs will depend on the distance of the installation from where the service technician exists.
5.1 Sunshine hours per day in Malawi (see resource section) below.
Costs of equipment were found from Solair Corporation and Sonlite, two local suppliers in Lilongwe considered to be reputable, and providing good quality equipment (contact details included in the Appendix 4)
The specific assumptions and parameters for system designs are outlined in Appendix 5
2.6.1.
Resource Assessment
For the purpose of the study, 5.8 kw/m2/day was used which equates to 5 sunshine hours. This is the case because it is good engineering practice to put lowest average monthly sunshine hours to become the design month of the solar system to avoid under-sizing the system. In this case Malawi on average the lowest sunshine recorded is approximately equal to 5 sunshine hours. According to the Malawi Energy Policy of 2003, the annual average solar radiation for Malawi is 21.1 MJ/m2/day which is equivalent to 5.8 kWh/m2/day. This is equivalent energy required to power a total of three hundred and sixty two 16 watt energy saver bulbs for one hour. A solar resource map of Malawi can be found in Appendix 8.
2.6.2.
Load Profiles
A load profile is a graph of the variation in the electrical load versus time. A load profile will vary according to customer type, and different load profiles and energy use throughout the day can inform the size of energy system needed to run the business.
Load profiles were determined by asking the businesses at what time of the day they used specific appliances, multiplying this probability with power rating of the appliances to plot the final load profile. These graphs are plotted for each business to represent how energy use changes for different businesses. The load profile graphs were then matched to appropriate systems to deliver that load.
2.7.
Business Economics
The surveys were used to find information of key business parameters, namely CAPEX Start-up costs (tools, materials, registration fees etc.), OPEX (on going monthly costs such as rent and tax) and monthly income. As answers varied significantly across the spread of businesses, average (MEAN) were taken were appropriate, with box and whisker graphs used to display the spread of the results. A higher spread indicated less confidence on the result, whereas a low spread indicated that most businesses gave a similar answer and that the mean is likely to be an accurate figure to use for business planning.
To model the businesses in an off grid scenario, the energy OPEX costs were removed from the total, and solar PV OPEX cost were added. The solar PV were assumed to by 20 of initial solar PV annual costs.
2.8.
Business Finance/cash flow
A simple 10 year cash flow forecast was used, utilising the “Productive Use of Energy Mini Business Plan Calculator”, an open source spreadsheet available online GIZ (GIZ, 2016). The tool take inputs from the parameters outlined above to output a profit or loss graph over a 10 year period to give an accurate representation of payback period, and cumulative profit or loss at the end of the 10 year period. Different scenarios were devised using ranges of capex, OPEX and income to derive strong, stable and weak case scenarios to determine the relative likelihood of the business being viable.
3.
Literature Review
3.1.
PUE Case studies in Malawi
3.1.1
Case Study: Video show and phone charging in Thete, Dedza,
cost of solar PV in 10 months. After this, the family saves $1700 a year from video show and phone charging—around 44% of the total annual income generation. Mrs Kapolo further said that, the family is spending nothing on lighting at all which means they’re able to spend their money on other things. Mrs Kapolo said that 14% of the household proportion of income they were spending on lighting was significant and so having access to a solar PV is life changing. He emphasized that they spend their savings from the business on food, clothing, soap, school fees and cooking oil. They also save money from reduced spending on lighting alternatives like kerosene, candles, and battery torches they were using before solar PV.
3.1.2
Case study: Impact of Solar PV Light on Mr Chinkhwita shops in
Ntchisi, Malawi.
“The accessibility of solar PV has enabled my small business to extend the trading hours well into the night.”
Mr. Chinkhwita runs a small groceries shop, tearoom and restaurant in Sopani village. Previously, he was using kerosene lamp and candles for lighting in his trading sites. He said that the lighting was of poor quality as a result visibility of his shop was limited hence less customers weren’t able to buy things from him. He further emphasized kerosene lamps were contributing to business losses in the tea room and restaurant business because it was difficult to handle since it diffuses fast and contaminated the foods. With the solar PV light system now he is able to extend the business operation hours up to around 21:30 in the evening. He said that before the Solar PV light he could sell 9% of the total daily sells and closed the shop around 18:30 and now with solar PV light system they are able increase sales from 9% to 40% of the total daily sales.
3.2.
Previous studies on PUE in Malawi
3.2.1.
SOGERV market assessment
FIGURE 3COMPARISON OF INTEREST IN SERVICES BOTH HOUSEHOLDS AND BUSINESSES RESPONDING
While there were some variations in the lower scored activities, the higher scored activities were remarkably similar at all locations: Mobile phone charging, cold drinks sales, entertainment provision, battery charging, barbershop, metal workshops and shop lighting. There was near agreement between business owners and households in their responses, except in the case of Gola and Thendo’s lower scored items where consumers consistently rated these higher than businesses. There is no obvious explanation for this so it has to be assumed either that local businesses are not yet aware of a market for these services or that consumers are unaware of the business constraints for establishing the service. The high scoring uses were passed on to the technical design team for consideration for standalone solar PV system design.
3.2.2.
CEM Market Assessment
FIGURE 4PRODUCTIVE USE "CHOOSE TOP 3"QUESTION FOR HOUSEHOLDS.SURVEY RESULTS FROM 115 HOUSEHOLDS.
FIGURE 5PRODUCTIVE USE "CHOOSE TOP 3"QUESTION FOR BUSINESSES.SURVEY RESULTS FROM 62 BUSINESSES.
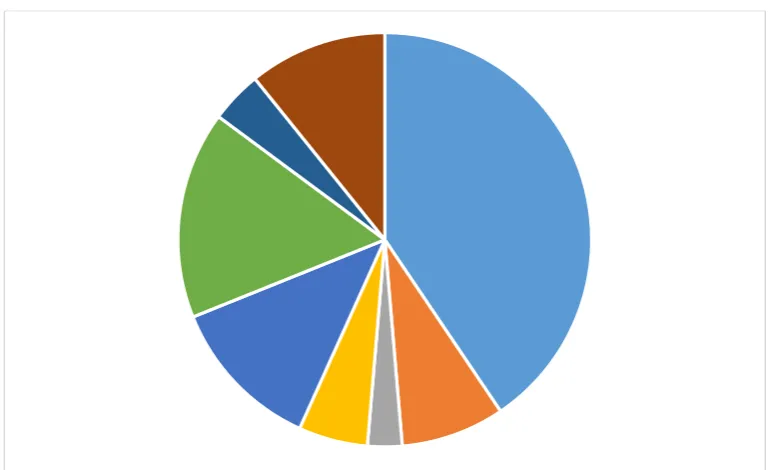
It can be seen that the most desirable PUE in the village’s surveys were Maize Mill, Potable Water, and Irrigation. In the “choose top 3” questions, Mobile phone charging, Irrigation and shop lighting came out top. Potable water, although possible to be run as an enterprise, was deemed to have other complicating factors such as accessibility to water sources, borehole pumps and often covered by government schemes, so not considered in this study. The other PUE are similar to the results found in the SOGERV study so have been selected for consideration in this study.
3.3.
Challenges to Business Start Up in Malawi
3.3.1.
Capacity
Lack of entrepreneurship skills is a basic challenge faced by business start-ups. Business training is needed to assist business owners in keeping track of business costs, as they are often not being recorded. Accounting skills can help the business operator to mitigate losses and track the progress of the business. It also strengthens the business processes, systems and rules that influence collective and individual behaviour and performance in business endeavours. It also allows to enhance the business owner’s ability and willingness to play new developmental roles and adapt to new demands and situations in business.
0 10 20 30 40 50 60 70 80
Maize Mill Potable Water Irrigation Mobile Phone Charging Battery Charging Barbershop Entertainment Metal Workshop Agricultural Refriferation Cold Drinks Refrigeration Chicken Incubation Printing Services Shop Lighting Tailoring Internet Café Electronic Repair Wood Workshop community radio Electric Fencing restaurant
0 5 10 15 20 25
[image:11.595.77.516.99.465.2]3.3.2.
Standards and Regulations
In general there is a lack of regulation which is limiting factor of the Solar PV market where currently few standards exist, causing an influx of cheap counterfeit products. This is being addressed in part by the Malawi Bureau of Standards and Malawi Energy Regulatory Authority (MERA), as standards are in place for both large and small solar systems mainly on the installations and the products.
According to MERA, any commercial energy undertaking (buying and selling of renewable energy products on a commercial level) needs a licence. For home use (for example a SHS) the installer needs to obtain the Renewable Energy Permit or licence. In case the owner of a SHS wanted to sell some power to other households then they need to obtain the distribution code from MERA.
3.3.3.
Funding Businesses
Interest rates in Malawi are staggeringly high (43%). Additionally, to get a loan from a bank one is required to have proof of address, utility bills and other paperwork which will be unobtainable for many rural Malawians. Some Micro Finance Institutions exist such as CUMO, similarly FISD offer the FISD Fund, which offers 7% interest with a 1 year payback (however most payback periods are above this). Village savings and loans also offer options for start-up capital, however the maximum available is usually MWK 200,000 and the loan often needs to be paid back within 6 months, which makes it unsuitable for many of the businesses proposed.
3.3.4.
Supply Chain
The availability of solar PV materials can be a limiting factor. Transportation costs for solar goods are high as shipping from China to Europe is $600, whereas in Malawi it is 6 – 8 times more. Road access has been noted as a challenge in rural locations of Malawi, as apart from the main carriageways most road are dirt tracks and difficult to travel on during the raining season.
Solar PV modules, batteries, charge controllers and inverters are becoming more available in trading centres, normally purchased from South Africa, however there have been concerns over quality of the goods supplied.
3.3.5.
Policy
It is also clear that the policy does not much protect the small businesses in the communities and it only favours the big businesses. The market channel for small business operators is narrower than the high scale business operators, which limits the profits they get from the business.
It is encouraged to register any new business to city assembly if operating within the city or district. The business operator needs to pay the registration fee depending on the size of the business. But if the business will be operating in any district then it will need to be registered in registry general and a business licence obtained. The business is also required to register with Malawi regulatory Authority (MRA) which will issue a Taxpayer Identification Number (TPIN) on registration that should be used on any correspondence with the Authority. With any business involving production, the Malawi Bureau of standards (MBS) regularly inspects the products if they all meet the standards and it is obliged to close the business if it does not meet the requirements.
3.3.6.
Availability and Affordability of Energy
This question on affordability of energy to start a business in Malawi regards the purchasing power of business energy users and their access to credit, and notes that even competitive innovations can remain unaffordable to the majority in emerging markets. This question is particularly crucial in the diffusion of solar PV systems, which are quite expensive relative to the low incomes in the rural areas, where they are more relevant.
3.3.7.
The Market Infrastructure
The market infrastructure perspective integrates entrepreneurs in the innovation diffusion process. It is built on the simple fact that “unless some government, entrepreneurial or non-profit organisation makes business innovation available at or near the location of the potential adopter in the community, that person or household will not have the option to adopt it in the first place”. This perspective focuses on the supply side of innovation diffusion like Solar PV or solar Mini grids in off grid communities. It is concerned with the process through which innovation is taken to the people who are supposed to benefit from it in his/ her business. This is where the role of the agencies is crucial. The agencies are “public or private entities through which an innovation is distributed or made available to society at large”. Diffusion agencies can be commercial entities, such as shops run by dealers and distributors of an innovation, or government entities, such as local agricultural extension offices, or non-profit entities. Market infrastructure becomes more of an issue for innovations that must be serviced regularly or where access to maintenance and repair services is critical. This is exactly the case with solar technologies in Malawian communities.
4.
Fieldwork Observations
In both communities, CEM team discovered similar income generation activities (IGAs). Productive uses in these communities were recognised as a means of offering a sustainable source of income for people which then adds weight to the economic business case. Contrary to this, the two communities are struggling to find energy services. In the face of energy services being insufficient, the two communities have number of productive uses offered in the areas that are powered by fossil fuel and very small solar systems.
Some of PUE activities CEM noted in the communities are; maize milling, irrigation, refrigeration, welding, carpentry, tailoring, hardware shops, electrical repair shops, bar, and barbershops. The enumerator team collected data from appropriate business services taking a selection of appropriate communities to meet the aim of this study, and established cases/ stories out of the current energy situations in communities. The interviews were also segregated by gender (both men and women were interviewed in their respective business services).
The team noted the following general observations during the surveys, mostly related to unavailability of energy;
4.1.
Njonja
Persistent lack of energy in their areas have underrated the efforts in Chimoto Health centre as a woman in health centre has died due to lack of electricity.
The customer’s confidence in local welders has reduced because they don’t supply products at the agreed time (due intermittent grid supply).
Despite some owners of maize mills re-introducing diesel powered maize mills alongside the electricity ones, frequent blackouts leaves many households without food because many maize mills run out of service.
Some businesses operate through the night because this is time when electricity is available hence quality of work is compromised.
Monthly income generation for most businesses have gone down and expressed worry that they are not affording to meet some basic needs due to power cut. Even school fees were coming from business income and most business men have withdrawal their children in expensive schools.
Electricity is not available to everyone who applied for it. Some customers applied for electricity 3 years back but are still waiting a connection.
Business men disclosed that they are now spending more on fuel for their genset to supply power to crucial facilities.
There is a lack of access to information about solar energy. Most people believe that solar energy can only be used for lighting and power small radios.
4.2.
Chiluzi
Lack of electricity in the area limits the operation hours of their businesses and also limit the business activities.
Women and girls travel long distances to working maize mills and the services are also very expensive, community members also travel long distances to access health services because the community failed to attain health works because of lack of electricity.
It was noted that the area depends on both rain fed and irrigation agriculture but unavailability of energy limits farmer’s productions. Very few farms use a motor pump and expressed that motor pump running costs are expensive.
It was noted only one phone charging unit powered by a small PV system but still the community is not aware that solar can proved sufficient energy sources for different income activities.
4.3.
General Observations
Shortage/ lack of energy services in the communities’ hits social economic activities in both households level and institutional. Absence of electricity from any source is an obstacle to growing their businesses
In grid connected trading centres, very few people are connected and there are several unreliable connections within.
From the survey, it shows many people who participated have applied for an electricity connection four years before but ESCOM declined giving them a quotation to pay for the connection claiming there is no transformer to supply their households with electricity power.
Only few customers who were given a quotation by ESCOM and are in the process of paying for the connection but claimed that they have used back doors for them to be processed fast.
Many people in both communities evaluated ESCOM’s effort to connect households as total failure. The participants seem to be emotional and aggressive when talk about national electricity. This was the case because they claim ESCOM has failed them in any way and it was time for them to hint hard on ESCOM in order to be heard.
5.
Business Plans
5.1.
Maize Mills
Maize is a staple crop grown and eaten in Malawi and the main ingredient of Nsima. 96% of maize consumed in Malawi is grown in Malawi (Jaicaf 2008), and maize consumption in Malawi averages 130kg/person/year (Derlangen 2012). Maize is stored whole in woven basket silos, which allows the maize to be stored for longer periods of time than milled maize. Maize grains are hulled then milled into flour. Maize milling is a year-round activity, with maize planted in rainy season, Nov-April and harvested in July-September, however maize mills will generally have more customers in harvest season. 11 maize mill owners were surveyed. It was found that the amount of maize milled depends on the availability of electricity, with some maize millers operating at night when the grid electricity is available which affects the quality of the product.
OPEX costs for a maize mill is driven by electricity use and therefore number of operating hours for the Maize mill. The cost of a normal maize mill that uses electricity from the grid or a diesel generator is between 800,000 MWK and 1,200,000 MWK (correct December 2016).
FIGURE 6SOLAR MAIZE MILL (SOLARMILLING,2017)
5.1.1.
Maize Mill Load Profiles
FIGURE 7PROBABILITY (BETWEEN 0 AND 1) OF THE MAIZE MILL BEING OPERATIONAL THROUGH EACH HOUR OF THE DAY
5.1.2.
Solar Maize Mill System Design and Costs
Prices as obtained from FISD, Lilongwe are outlined below. Systems come complete with solar PV array, an inverter and an AC motor powering the maize mill. Very few solar maize mills have been installed in Malawi, with only a few projects in pilot stage. Products come from a Spanish company, SolarMilling.com. A summary of prices and specification for the two system sizes offered can be found in Table 1Table 2 below. For this study, the lower cost of maize mill was considered (1.1kW).
TABLE 2COST OF SOLAR POWERED MAIZE MILLS (FISD,2017)
Size (kW) PV Yield Cost (MWK)
7.5kW 40 x 250W 6 hours – 50 bags (1 tonne) 23,000,000 1.1 kW 12 x 160W 8 hours – 10 bags (50kg) 7,000,000
5.1.3.
Maize mill CAPEX
6 maize mill owners gave information on CAPEX, broken down into the sub-categories below:
TABLE 3SUMMARY OF MAIZE MILL CAPEX
Item No of Maize mills Cost
Initial materials and machinery 4 MWK 12,000,000 /220,000/280,000/1,000,000
Registration fees 3 MWK 5000/15,000/35,000
Renovation of the building 3 MWK 40,000/1,500/60,000
Bringing energy supply to the building 2 MWK 100,000/9000
Training staff 2 MWK 15,000/ 5,000
Purchase of building 1 MWK 50,000
Legal fees 0
It is noticed there is an order of magnitude difference in CAPEX response between individual maize mill businesses. Most noticeably, there is 1 major outlier due to very high initial material costs of 12,000,000 MWK. The enumerators conducting the survey noted this business had several maize mills and was therefore exceptionally large. Conclusions are outlined below, the spread of total CAPEX is shown below in Figure 8 Maize Mill CAPEX spread and summaryFigure 8.
Large variation in registration fees, and ssually no legal fees are paid.
Purchase or renovation of the building may be a small cost at 1,500 MWK or may be a large cost c. 50,000 MWK if the whole building needs changing.
Staff training is usually not done but may cost 5,000 MWK to 15,000 MWK.
FIGURE 8MAIZE MILL CAPEX SPREAD AND SUMMARY
For the purposes of business planning, analysis was conducted to see what the average CAPEX costs are excluding initial machinery and for bringing energy supply to the building. This is assuming these costs will not be required when getting set up with a solar PV maize. The Max, Min and Mean results for CAPEX excluding energy connection and machinery costs are shown in Table 4.
TABLE 4MAIZE MILL CAPEX WITHOUT ENERGY CONNECTION AND MACHINERY COSTS
MAX 90,000 MWK
MIN 1,500 MWK
MEAN 44,300 MWK
5.1.4.
Maize mill OPEX
RUNNING COSTS WERE CONSIDERED IN TERMS OF GOOD MONTHS (WITH HIGHER RUNNING COSTS), AVERAGE MONTHS AND BAD MONTHS (WITH PRESUMABLY LOWER RUNNING COSTS).THERE IS AN UNREALISTICALLY HIGH OUTLIER FOR AN
AVERAGE MONTH RUNNING COST AND THE MEDIAN IS CONSIDERED AS A BETTER ESTIMATION OF RUNNING COSTS IN THIS CASE. GRAPHS SHOWING MAIZE MILL OPEX FOR AVERAGE, GOOD AND BAD MONTHS IS SHOWN BELOW, BOTH
WITH AND WITHOUT THE UNREALISTIC OUTLIER.IN
[image:17.595.195.392.86.244.2]FIGURE 9MAIZE MILL OPEX COSTS FIGURE 10MAIZE MILL OPEX WITH OUTLIER REMOVED
TABLE 5SUMMARY OF MEAN,MAX AND MINOPEX FOR ESTIMATED RUNNING COSTS Average (MWK) Slow (MWK) Good (MWK)
MEAN 59,625 46,889 70,556
MAX 145,000 150,000 200,000
MIN 5,000 1,500 10,000
FIGURE 11MAIZE MILL OPEX BY TYPE
5.1.4.1.
Maize Mill Energy OPEX
Maize mill profit and income is directly linked to spend on energy use, i.e. the maize mill operation is completely dependent on energy provision. Of the maize millers surveyed, 7 got their electricity form the grid, 4 from diesel and one used both. Other comments of note included a miller using Airtel money to buy energy which occasionally resulted in a delay from the agent. Most respondents indicated it was not normally a problem to pay for grid energy, however access to energy and Intermittent energy was stated as either a problem or a major problem for all. Many said that PV system are not available.
Spend on energy per operating hour per month ranges from 800 MWK to 20,000 MWK. The total energy spend per month varies massively between 7,000 MWK and 300,000 MWK with an expected energy spend of 50,000 MWK (over half of the total monthly spend). The graphs below show the relationship between monthly OPEX and number of operating hours, showing a positive correlation.
FIGURE 12NUMBER OF OPERATING HOURS AGAINST ENERGY COST AND OPEX
5.1.4.2.
Maize Mill OPEX for Business Planning
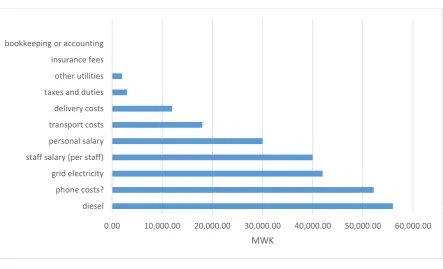
To calculate the business model cash flow, total OPEX costs were calculated by summing the individual monthly costs as shown above, this is shown in Figure 13. Energy costs (diesel and grid electricity)
0.00 10,000.00 20,000.00 30,000.00 40,000.00 50,000.00 60,000.00 diesel
phone costs? grid electricity staff salary (per staff) personal salary transport costs delivery costs taxes and duties other utilities insurance fees bookkeeping or accounting
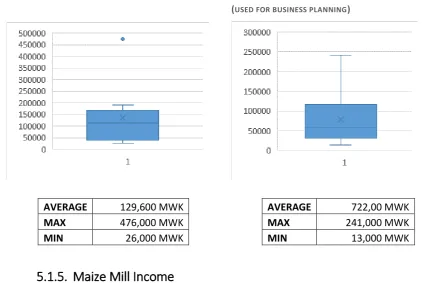
[image:19.595.78.522.82.351.2]were then removed from the total OPEX removed, assuming that a PV powered maize mill will not have to spend on grid or diesel costs. The OPEX costs excluding energy, used for the business cash flow modelling calculations is shown below in Figure 14.
FIGURE 13MAIZE MILL TOTAL OPEX FIGURE 14MAIZE MILL OPEX WITHOUT ENERGY COSTS (USED FOR BUSINESS PLANNING)
AVERAGE 129,600 MWK
MAX 476,000 MWK
MIN 26,000 MWK
AVERAGE 722,00 MWK
MAX 241,000 MWK
MIN 13,000 MWK
5.1.5.
Maize Mill Income
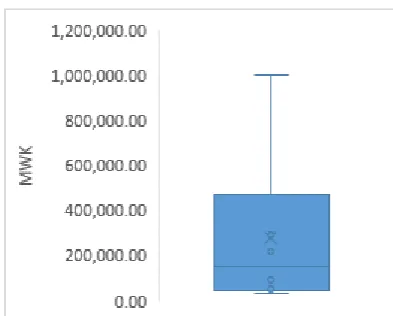
The survey participants were asked to estimate the income for the owner per month. Figure 15 shows the given responses in terms of a box and whisker plot. The cross is the mean and the middle bar is the median. A summary of the mean, max and min values for each monthly scenario is also given.
FIGURE 15THE ESTIMATION OF MAIZE MILL INCOME FOR IN AN AVERAGE, GOOD AND SLOW MONTH
Average month (MWK)
Bad month (MWK)
Good month (MWK)
MEAN 173,000 103,300 202,000
MAX 600,000 400,000 800,000
[image:20.595.71.506.133.416.2] [image:20.595.88.504.485.769.2]Considering the amount charged per kg of maize, the amount of maize milled per customer and the number of customers in an average/slow/good month, the income per month can be profiled. The result is an average income per month of 9,000,000 MWK assuming 15 days operating (best case income of 17,000,000 MWK and a worst case income of 4,000,000 MWK).
This is unrealistic which indicated that the maize miller misunderstood the question. For example, surveyed responses indicated 250kg per customer, which is a quarter of a tonne. Due to the lack of reliability of this part of the data, the business forecasting has used the initial estimates in Figure 15.
5.1.6.
Maize Mill Cash Flow Forecast
Given the wide ranges of responses, different scenarios are modelled using figures from different parts of the responses. The scenario parameters are outlined below with the corresponding graphs following.
As the OPEX is dominated by energy, to model a solar maize mill business model, the energy OPEX has been subtracted from the total OPEX, as outlined above. Maintenance costs of the solar system are assumed as 5% of the capex (yearly) so are added on, calculated for monthly. The maintenance costs are considered lower than the other systems, as batteries are not part of the system, which are normally a high maintenance cost of a solar PV system.
TABLE 6SUMMARY OF MAIZE MILL SCENARIOS Scenario Description CAPEX non
maize mill (MWK)
OPEX non energy (MWK)
Solar OPEX (MWK)
Total OPEX (MWK)
Income (MWK)
Cost of Solar Maize Mill (MWK)
1 HIGH 44,300 72,200 29,200 101,400 202,000 7,000,000
2 AVERAGE 44,300 72,200 29,200 101,400 173,000 7,000,000
3 LOW 44,300 72,200 29,200 101,400 103,300 7,000,000
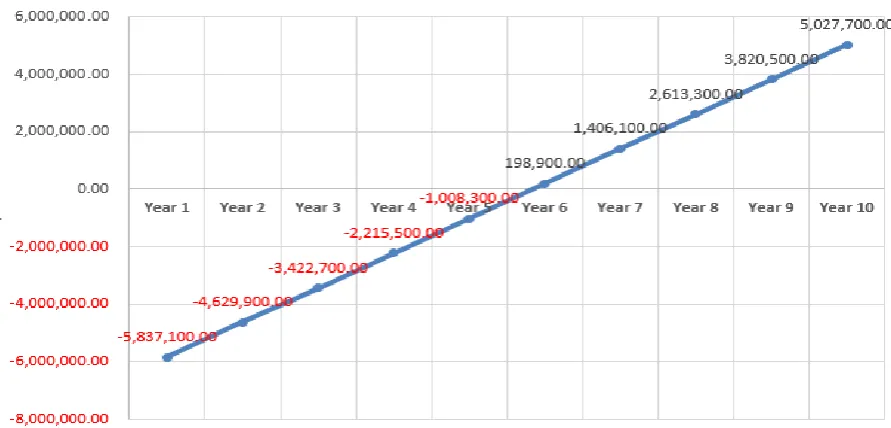
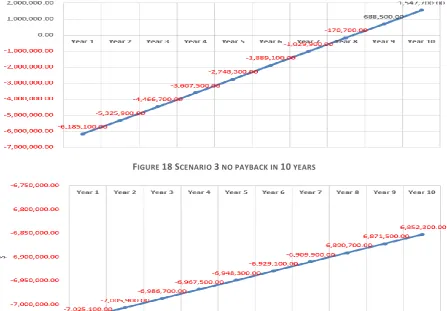
[image:21.595.73.519.482.696.2]FIGURE 17SCENARIO 2–PAYBACK IN YEAR 8,MWK1,548,000 PROFIT AT YEAR 10
FIGURE 18SCENARIO 3 NO PAYBACK IN 10 YEARS
5.1.7.
Maize Mill Conclusions
If a business model can prove to be profitable, there is high potential for solar PV maize mills as maize is the staple crop and there is a high customer base in most areas of Malawi. Given that most existing maize mills are found in trading centres with grid electricity, customers currently travelling a long distance to get their maize milled may be willing to pay a higher price, which would increase income and make the cash flow forecasts listed above more profitable and viable.
The best case scenario gives a payback of 5 years, the middle option 8 years, and the worst case doesn’t break even after 10 years. It must be noted that these are modelled on the cheaper solar maize mill (1.1kW), meaning that that 7.5kW maize mill would be an order of magnitude less profitable.
The high CAPEX for a new maize mill are likely to be too expensive for an average farmer, and even a 5 year payback is too long for most current financing mechanisms in Malawi. Solar maize mills are still in early stages of piloting in Malawi, which has implications of risk in terms of technological failure, and cultural resistance to new technology. There are no recorded maintenance costs, an uncertainty which adds further risk to a pilot project.
[image:22.595.73.521.95.406.2]5.2.
Irrigation farming
Irrigation is the controlled application of water for agricultural purposes through man-made systems to supply water requirements not satisfied by rainfall. Crop irrigation is vital in Malawi in order to provide the ever-growing population with enough food. Solar powered irrigation means that farmers can grow crops when outwith the rainy season, meaning they can extend the growing season and bring in a greater income. Farmers using irrigation as part of their business use mostly diesel, due to the need to power irrigation pumps in rural locations. None of the enterprises surveyed use electricity from the grid.
FIGURE 19SOLAR IRRIGATION
33 farmers interviewed indicated that they use irrigation, the type of farming is shown below. It can be seen that maize is mostly used, followed by irish potatoes (which is a common crop in Dedza). Other responses included ground nuts and tree seedlings.
FIGURE 20TYPE OF FARMER USING IRRIGATION
[image:23.595.105.492.467.702.2]5.2.1.
Irrigation Load Profiles
None of the farmers knew the loading of their irrigation systems therefore load profiles for irrigation farming could not be made in the same way as the other businesses. The load profiles for irrigation have therefore been derived from the specifications of available equipment from FISD, which includes the pumping capacity and the areas of land that can be irrigated.
5.2.2.
Irrigation CAPEX
The CAPEX costs segregated by type are shown in Figure 21, it is clear that initial materials and machinery are highest, with land and bringing an energy supply the next highest. The mean, max, min and median of the total capex is also shown in Table 7.
FIGURE 21IRRIGATION CAPEX BY TYPE, AND SUMMARY OF AVERAGES, MAX AND MIN
TABLE 7SUMMARY OF IRRIGATION CAPEXPARAMETERS Parameter Value (MWK)
MEAN 198,976
MAX 1,859,000
MIN 500
MEDIAN 50,000
It is noticed there is an order of magnitude difference in CAPEX response between individual in irrigation farming businesses. Most noticeably, there is 1 Major outlier due to very high initial material and machinery costs of 1,559,000 MWK.
Other findings to note:
Small variation in registration fees;
Usually no legal fees are paid;
No Purchase of the building but renovation of the irrigation lands may be a small
which may cost 67,000 MWK for a very small irrigation land. This means for big irrigation schemes this cost is expected to be much higher;
Staff training is usually not done but may cost 5,000 MWK to 15,000 MWK;
Initial materials and machinery is the most expensive CAPEX cost.
The CAPEX used for business planning is the mean of the totals, which is 199,000 MWK (rounded to the nearest 500 MWK).
0 468 0 0
2,161 8,387
113,452 10,323
0.00 20,000.00 40,000.00 60,000.00 80,000.00 100,000.00120,000.00 To start the business, which of the following expenses did…
registration fees? legal fees? purchase of building? renovation of building? bringing energy supply to the building
5.2.3.
Irrigation OPEX
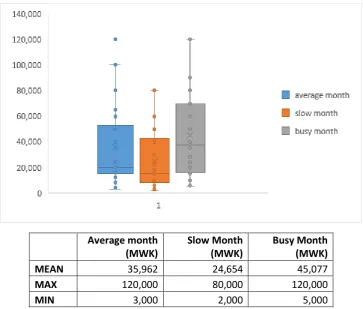
The farmers interviewed were asked to estimate their monthly OPEX costs for an average, busy and slow month. 7 businesses didn’t know their OPEX cost, so these were taken out. The results are shown in Figure 22 Irrigation OPEX, along with the Mean, Max and Min values for each type of month.
FIGURE 22IRRIGATION OPEX
Average month (MWK)
Slow Month (MWK)
Busy Month (MWK)
MEAN 35,962 24,654 45,077
MAX 120,000 80,000 120,000
MIN 3,000 2,000 5,000
OPEX for itemised monthly running costs were collected and itemised, and shown in Figure 23. The number in brackets indicates how many non-zero responses there were. It can be seen that diesel costs dominate OPEX for irrigation, with staff salary, personal salary and subcontractors all contributing relatively equally following diesel.
FIGURE 23IRRIGATION OPEX BY TYPE
30,781 0
826 543 217
8,522 7,174 0
8,696 0
0 0 0
2,500
0 5,000 10,000 15,000 20,000 25,000 30,000 35,000 diesel (18)
[image:25.595.116.480.157.466.2]It is interesting to note that no irrigation businesses are connected to the national grid, which is intuitive as they are likely to be rurally located.
For the purposes of business planning, OPEX were calculated without energy costs (subtracting diesel costs from total OPEX costs), assuming that a solar PV irrigation system will not have to spend money on diesel. The results are shown in Table 8. The OPEX used for business planning is 28,500 MWK
TABLE 8IRRIGATION OPEX COSTS AND EXCLUDING DIESEL COSTS OPEX total
(MWK)
OPEX without energy (MWK)
MEAN 52,459 28,370
MAX 340,000 320,000
MIN 5,000 0
5.2.4.
Irrigation Energy loads and system requirements
This section includes a brief description of the energy use of irrigation systems based on the data collected. Figure 24 shows the number of energy sources used by irrigation farmers.
Figure 24 Energy use by type for irrigation farmers
In summary:
18 enterprises use petrol or diesel as their source of energy;
10 enterprises which use other sources of energy such as human power and daylight (sun);
8 enterprises use diesel;
2 enterprises use dry cell batteries;
1 enterprise use PV system;
None of the enterprises uses biogas, gas LPG/LNG, paraffin, candles, electricity from the grid and charcoal.
Frequency of buying energy source and cost per month:
Candle (@ MK10000, @MK600);
Diesel (MK8000, MK16000);
Petrol (mk8000, MK12000, MK20000, MK42000, MK60000, MK64000, MK80000);
Dry cell batteries (none).0 2 4 6 8 10 12
N
o
. o
f r
e
sp
o
n
ses
The research survey identified types of energy an irrigation use. Figure 25 identifies the energy types based on their level of use.
FIGURE 25 TYPE OF IRRIGATION
It has been noticed that most frequently used is a motor pump which uses either diesel or petrol and diesel is most used on the operation cost. Water diversion from the river is the second method used. This uses free gravitation energy flow of water into the irrigation farm land.
5.2.5.
Irrigation Income
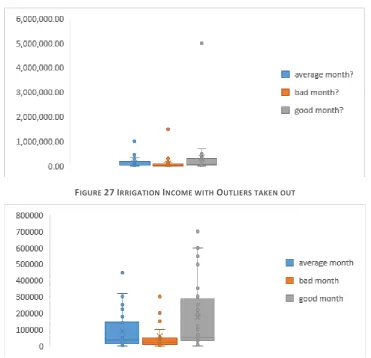
The box and whiskers plot for irrigation on an average, bad and good month is shown in Figure 26, displaying a significant range with on farmer giving high outliers. Figure 27 shows the same graph with the outliers removed.
FIGURE 26IRRIGATION INCOME WITH OUTLIERS
FIGURE 27IRRIGATION INCOME WITH OUTLIERS TAKEN OUT 0
5 10 15 20
other morden micro
dam
treadle pump motor pump traditional
river diversion
4 3
2
16
[image:27.595.112.484.405.763.2]TABLE 9IRRIGATION INCOME SUMMARY Average (MWK) Bad (MWK) Good (MWK)
AVERAGE 120,000 103,000 321,000
MAX 1,000,000 1,500,000 5,000,000
MIN 900 700 1500
5.2.6.
Irrigation System Design and Costs
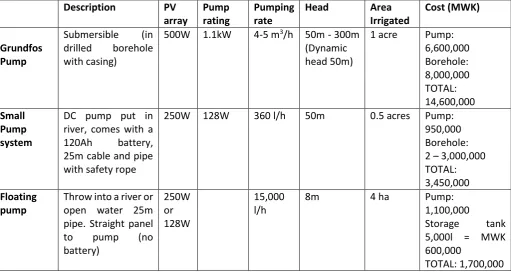
Costs from FISD are shown below. The company offer a variety of solar powered irrigation products. The first two options require a borehole to be dug, with a casing and submersible pump, which add to the initial cost. The final option allows a farmer to float the pump in a nearby river with a hose to transport the water to the land. The final option has the lowest set up costs (assuming a borehole doesn’t already exist) and the easiest to initiate as a project, however the applications will be very site specific, as it is only suitable for farmers living in the vicinity of a river or open water source. Indicative water table depths are given below (taken from a conversation with FISD engineer):
TABLE 10INDICATIVE WATER TABLE DEPTHS IN MALAWI
Location Town Depth of Borehole
North Mzuzu Generally more than 20m
Central Lilongwe 15 – 20m
South Chikwawa 5m
TABLE 11COSTS AND DESCRIPTION OF SOLAR POWERED PUMPS AVAILABLE IN LILONGWE (FISD,2017)
Description PV
array
Pump rating
Pumping rate
Head Area
Irrigated
Cost (MWK)
Grundfos Pump
Submersible (in drilled borehole with casing)
500W 1.1kW 4-5 m3/h 50m - 300m (Dynamic head 50m)
1 acre Pump: 6,600,000 Borehole: 8,000,000 TOTAL: 14,600,000 Small Pump system
DC pump put in river, comes with a 120Ah battery, 25m cable and pipe with safety rope
250W 128W 360 l/h 50m 0.5 acres Pump:
950,000 Borehole: 2 – 3,000,000 TOTAL: 3,450,000 Floating
pump
Throw into a river or open water 25m pipe. Straight panel
to pump (no
battery) 250W or 128W 15,000 l/h
8m 4 ha Pump:
1,100,000
Storage tank 5,000l = MWK 600,000
[image:28.595.42.554.426.698.2]5.2.7.
Irrigation Cash Flow
For the following cash flow analysis, the assumptions were used as follows:
Solar PV OPEX has been calculated as 5% of capital costs annually, as with Maize Mills, not batteries are present in the system so maintenance costs will be lower. This has been calculated for a monthly cost and added on the OPEX to determine the total OPEX, shown below. Figures have been rounded to the nearest 500 MWK.
TABLE 12SUMMARY OF INPUT PARAMETERS FOR IRRIGATION CASH FLOW
Scenario Description Income
(MWK)
OPEX (MWK)
Solar OPEX (MWK)
Total OPEX (MWK)
CAPEX (MWK)
Pump CAPEX (MWK)
1 Low Income, Floating
pump 103,000 28,500 7,000 35,500 199,000 1,700,000
2 Average Income,
Small Pump 120,000 28,500 14,500 43,000 199,000 3,450,000
3 High Income,
Grundfos Pump 321,000 28,500 61,000 89,500 199,000 14,600,000
FIGURE 28SCENARIO 1–LOW INCOME,FLOATING PUMP:PAYBACK IN YEAR 2,MWK6,201,000 PROFIT AT YEAR 10
FIGURE 30SCENARIO 3HIGH INCOME,GRUNDFOS PUMP, PAYBACK AFTER 5 YEARS,MWK12,981,000 PROFIT AT YEAR 10
5.2.8.
Irrigation Conclusions and Discussion
There is a high profit margin for Irrigation from the answers that were given in the surveys. Similar to maize milling, the number of farmers in Malawi is high, so finding a profitable business model for solar PV irrigation would attract a high customer base.
The fastest payback comes from a low income on the cheapest pump, which breaks even in the second year. If this was modelled with average or high incomes then the payback period would reduce further. This indicates that floating pumps are feasible for irrigation farmers in Malawi. The small pump options give a payback after 3 years, which is possible with the right funding model and could still be attractive to farmers in Malawi. The Grundfos pays back after 5 years which would be less attractive for farmers in Malawi but still not unfeasible. In general, irrigation seems profitable and viable businesses can be devised around solar irrigation.
The business models calculated are very site specific, site assessments must be made for the suitability of water courses. The highest viability scenario is for floating pumps, which are specifically suited for communities living close to rivers. The actual number of farmers living in areas close to rivers might be relatively low.
[image:30.595.76.523.106.311.2]5.3.
Small Sales and service businesses
The examples of the sale and services shops include grocery, phone charging, barber shop and selling cold drinks. There are already many of these types of businesses in rural Malawi being powered by solar PV systems. The comparative low start-up costs would indicate that this scale of business, with the right business plan and appropriate funds for start-up, could be successful in Malawi. It was found that income is seasonal, as when farmers sell their produce they have spare cash to buy more products and services. 20 businesses gave information on small sales and services. 25% said they were already using a PV system, others said they weren’t connected because it wasn’t available.
Sales and service businesses were split into two categories (large and small) to reduce skewed results. Large businesses are classes as >100,000 per month income, small businesses <100,000 per month. Large business had very skewed results and few entries, so were not included in this study. Additionally, the large sales and service businesses fell into the category of grocery and hardware sales. The electrical needs for these shops will be mostly lighting, so the business case for including PV is not as clear, however investigating the feasibility for utilising PV should be included in a further study.
FIGURE 31PHONE CHARGING BUSINESS
Most of the businesses surveyed were either barbershops or offering phone charging. Entertainment was also listed, with Other including “Sale electronic accessories”, “Printing and photocopying”, “Agro dealers of maize seeds” and “Uploading music in phones”. Figure 32 shows the percentage of respondents offering a certain business, while Figure 33 shows the frequency of different combinations of businesses offered.
FIGURE 32 PERCENTAGE OF RESPONDENTS OFFERING A CERTAIN BUSINESS
79%
79% 21%
21%
FIGURE 33 FREQUENCY OF DIFFERENT COMBINATIONS OF BUSINESSES OFFERED.
It can be seen that barbershop and phone charging is the most popular combination of services offered. This business method will be used for the system design and cash flow forecasting later in this section.
5.3.1.
Sales and Services Load Profiles
Table 13 Power use and appliance cost for each device for service businessesshows the cost of the main appliances used in sales and services, with their associated cost and Power rating. All appliances were AC. Figure 34 shows the probability of a certain appliance being on or off during the day. The busiest part of the day can be seen coinciding with usual opening hours.
Figure 35 and Figure 36 show the same probability multiplied by the power rating for each device. This gives an indication of the load profile for each appliance over the day and relative to each other in terms of power use.
TABLE 13POWER USE AND APPLIANCE COST FOR EACH DEVICE FOR SERVICE BUSINESSES
Item Cost (MWK) Power (W)
Radio 61,000 14
Hair clippers 14,000 25
Fridge 180,000 300
Laptop 100,000 12
Amplifier 47,500 559.5
TV screen 36,500 47.5
DVD player 15,000 25
0 2 4 6 8 10 12
[image:32.595.117.477.87.303.2] [image:32.595.122.476.521.648.2]FIGURE 34THE PROBABILITY OF EACH SALES AND SERVICE APPLIANCE BEING ‘ON’ AT DIFFERENT TIMES OF DAY (BETWEEN 0 AND
FIGURE 35THE PROBABILITY MULTIPLIED BY THE POWER RATING OF THE APPLIANCE TO GIVE THE RESPECTIVE LOAD PROFILES FOR EACH APPLIANCE.
FIGURE 36:ZOOM INTO THE RELATIVE LOW LOAD APPLIANCES (THE SAME AS THE PREVIOUS GRAPH). 0
100 200 300 400 500 600
Po
w
er
W
Load profile weighted with power
Radio Hair clippers Fridge Laptop Amplifier TV screen DVD player
0 10 20 30 40 50 60
Po
we
r
W
Radio Hair clippers Fridge Laptop
5.3.2.
Sales and Services Design and Costs
Assumptions made for the design can be found in Appendix 6, a description of the systems is below with associated costs. All costs are in MWK. The costs include 2.5mm cables and circuit breakers.
TABLE 14ASSUMPTIONS FOR DESIGN OF SYSTEMS
Type of system
Size of PV(W) Rating of Battery(Ah) Charge Controller(A) Inverter
(Watts) Appliances Phone Charging
station
60 100 6 300 Phones, Bulb
Video show 1000 576 30 300 TV,DVD/Decoder, Bulb
Phone Charging Barbershop*
60 100 6 300 Phones. Shavers, bulb
Barbershop 60 100 6 300 shavers, bulb
Refrigeration+ 500 288 30 500 Refrigerator, bulb
*This design assumes that a maximum of 30 phones will be charged per day
+The design assumes that the refrigerator will operate for 8 hours
TABLE 15COST OF SYSTEMS Type of system PV
(MWK) Battery (MWK) Charge Controller (MWK) Inverter (MWK) Other Accessories (MWK) Installation Costs (MWK) Total System Cost (MWK) Phone Charging station
58,000 125,552 25,000 40,432 10,000 77,695 336,679
Video Show 880,000 632,016 70,000 40,432 20,000 492,734 2,135,182
Barbershop 58,000 125,552 25,000 40,432 10,000 77,695 336,679
Barbershop + Phone Charging
87,000 125,552 25,000 40,432 15,000 87,895 380,879
Refrigeration 440,000 697,680 70,000 140,000 25,000 411,804 1,784,484
5.3.3.
Sales and Services CAPEX
The CAPEX summary for sales and services is shown below, along with a max, min and mean for the total CAPEX displayed in Figure 37. A large variation in CAPEX cost is shown in purchase of building, initial materials and machinery and bringing in energy supply. These CAPEX items can vary significantly depending on business and energy connection.
FIGURE 37SALES AND SERVICE CAPEX BY TYPE
TOTAL CAPEX MEAN 136,616 MAX 360,000
MIN 0
The CAPEX used for business cash flow forecasting is the mean, which is 136,616 MWK
5.3.4.
Sales and Service OPEX
The OPEX costs for a slow, busy and average month are shown in Figure 38, with a summary of the mean, max and min values for each scenario listed underneath. Mean values range from 9,800 MWK to 10,363 MWK, minimum range from 1,000 MWK to 2,000 MWK and mean values range from about 7,500 MWK in a slow month to 10, 300 MWK in a busy month. There is not a huge variation in figures.
1,333 6,316
10,526 353
36,842
81,316 0
0.00 10,000.00 20,000.00 30,000.00 40,000.00 50,000.00 60,000.00 70,000.00 80,000.00 90,000.00 registration fees
legal fees purchase of building building bringing energy supply to the building
initial materials and machinery training of staff
[image:35.595.38.561.171.450.2]FIGURE 38SALES AND SERVICE OPEX
Average Slow Busy
MEAN 9,811 7,547 10,363
MAX 30,000 20,000 25,000
MIN 1,500 1,000 2,000
These costs are then broken down into OPEX by type, which is shown in Figure 39 below. It is clear that grid electricity costs dominate the OPEX, and that electricity is a driving cost of the business. It is interesting to note that personal salaries are not reported, assuming that as it is a small business then the profits are taken directly. Transport, rent and taxes are other noticeable OPEX costs, but in general the OPEX costs are few, and low in cost.
FIGURE 39SALES AND SERVICES OPEX BY TYPE
Given the large energy OPEX costs, analysis was completed to remove the grid electricity and diesel from the calculation, to model a business running from solar PV that does not have these costs. The Max, Min and Mean values following this analysis is shown below, and will be used for the business modelling.
0.00 1,000.00 2,000.00 3,000.00 4,000.00 5,000.00 6,000.00 diesel
grid electricity phone costs transport costs delivery costs staff salary (per staff) personal salary taxes and duties subcontractors advertising water and other utilities insurance fees bookkeeping or accounting Rent Other
[image:36.595.115.472.84.337.2] [image:36.595.76.525.451.682.2]TABLE 16SUMMARY OF SALES AND SERVICE OPEX USED FOR BUSINESS PLANNING OPEX (MWK) OPEX without energy (MWK)
MEAN 11,268 4,526
MAX 47,100 23,100
MIN 1,400 0
It is interesting to note that many businesses only stated grid electricity as their only OPEX costs, which meant their overheads were zero without energy costs included. Although it is unlikely they will have no OPEX costs, the business owners obviously regard them as negligible in comparison to the energy costs they’ve stated. Similarly, as mentioned previously, business training is needed to assist business owners in keeping track of these costs, as they are obviously not being recorded. For the business forecasting a value of MWK 4,500 will be used for OPEX without energy
5.3.5.
Sales and Service Income
Shop keepers were asked to estimate their income for a good, bad and average month. This is shown in the graph below, with a summary of the mean, max and min values for each monthly scenario. The incomes are approximately double the OPEX cost previously calculated.
FIGURE 40SALES AND SERVICES MONTHLY INCOME AS ESTIMATED BY THE SHOP KEEPERS.
Average (MWK) Bad (MWK) Good (MWK)
MEAN 26,500 15,000 32,000
MAX 60,000 40,000 80,000
MIN 7,000 3,000 5,000
The respondent included their cost of service charges and for barbershop and phone charging are displayed below:
FIGURE 41PRICES FOR BARBERSHOP AND PHONE CHARGING BUSINESSES
Business Range (MWK) Most common answer (MWK)
Barbershop 100 – 200 mostly 150
5.3.6.
Sales and Services Cash Flow
As with previous business cases, different scenarios have been run on a profit and loss basis to determine the viability of businesses. Income is taken from the mean of average, good and bad estimates respectively (rounded to the nearest 500 MWK), OPEX is set as the mean without energy. Solar OPEX is taken as 20% of Solar PV Capital costs, annually, divided by 12 to get a monthly figure. All numbers have been rounded to the nearest 500. Scenarios are run for a barbershop and phone charging business.
TABLE 17SUMMARY OF SALES AND SERVICE INPUT PARAMETERS FOR BUSINESS CASH FLOW
Scenario Description Income OPEX Solar
OPEX
Total
OPEX CAPEX
Solar CAPEX
1 Good 32,000 4,500 6,500 11,000 136,500 381,000
2 Average 26,500 4,500 6,500 11,000 136,500 381,000
3 bad 15,000 4,500 6,500 11,000 136,500 381,000
FIGURE 42SCENARIO 1 PAYBACK IN YEAR 2,MWK2,002,500 PROFIT IN YEAR 10
[image:38.595.67.545.203.276.2] [image:38.595.69.526.273.757.2] [image:38.595.74.525.525.758.2]FIGURE 44SCENARIO 3– NO PAYBACK IN YEAR 10
5.3.7.
Sales and Services Conclusions
For the average and good scenarios, the business cash flows show the shortest paybacks of all the business modelled so far (2 years). The key reason for this is low CAPEX and relatively low OPEX. The relatively low start-up fee will make these options attractive to entrepreneurs, but a cost of MWK 381,000 still may be prohibitive for many, without financing arrangements. The jump to >10 year payback for the worst scenario is due to significantly lower income estimates for this scenario from the business owners. This should be taken into consideration as any business can suffer a slow month which can affect cash flow. However, of all the businesses modelled, a barber shop and phone charging business gives some of the lowest paybacks of all modelled businesses so should be pursued as viable options for solar powered businesses in rural Malawi.
Scenarios have not been run for refrigeration or grocery businesses, as system costs to run a fridge are substantially higher. Similarly the link between income and electricity is less easy to quantify for grocery businesses, however cold drinks and shop lighting was indicated as a need in the community so the business case for these businesses should be investigated in further studies.
5.4.
Repair and Manufacture Businesses
Businesses offering repair and manufacture were considered together, 23 businesses offering these services were surveyed. This includes phone repair (2), tailoring (4), grinding and welding (8), carpentry (6) and electrical repair (3). These businesses are grouped together as their energy requirements are expected to be significantly more than businesses offering ‘services and sales’. Utilising information found in previous markets assessments outline din the literature review, a focus has been put on tailoring and metal workshop businesses, as these have scored highly on priority within communities in Malawi.
FIGURE 45WELDING BUSINESS
5.4.1.
Repair and Manufacture Load Profiles
For all repair and manufacture businesses surveyed, the machinery is run using grid electricity (as seen in OPEX spend) rather than diesel. From survey responses, Table 18 summarises the electrical appliances and machinery being used by repair and manufacture businesses with cost rating and usage.
The information in Table 18 can be used to consider repair and manufacture energy use through the working day and therefore business load requirements. Figure 46 shows the load profiles expected over the day for tailoring, metal work and/or carpentry (many businesses did both) and electrical repair.
TABLE 18ITEMS NECESSARY FOR REPAIR AND MANUFACTURE BUSINESSES AND THEIR POWER RATING FROM THE SURVEY RESULTS.
Item cost MWK Power W AC/DC Number of hrs ran
Welding equipment 150,000 2000 AC unknown
Drilling machine 30,000 65 AC 4
Soldering station 450,000 2 AC 2
[image:40.595.235.361.215.415.2]