Review of Approaches for Using Synchrophasor
Data for Real-Time Wide-Area Control
S.M. Blair, M.H. Syed, E. Guillo-Sansano, Q. Hong, C.D. Booth, G.M. Burt
Institute for Energy and EnvironmentUniversity of Strathclyde Glasgow, United Kingdom [email protected]
Arturo Hinojos and Irving Avila
Energy Innovation CenterNokia Plano, Texas, USA [email protected]
Abstract—Due to the changing nature of power systems— with reduced electrical inertia and the prevalence of smaller controllable power resources rather than large generators— new control approaches are required to mitigate disturbances. Ubiquitous measurements and communications networks can be leveraged to accelerate and provide a targeted, real-time response in such future systems. However, autonomous control of power systems requires dependable measurements. This paper provides a review of state of the art approaches to real-time power system control using synchrophasor measurements. In particular, examples are given involving recent developments in frequency regulation. Through a case study, it is shown how laboratories can be linked using Software-Defined Networking technologies to conveniently share resources in order to realistically and comprehensively validate synchrophasor-based control systems.
I. INTRODUCTION
Power systems are undergoing significant changes in the composition of generation sources and other Distributed En-ergy Resources (DERs). In particular, there are increasing numbers of relatively small participants (e.g. controllable generators and energy storage), rather than large centralized power plants. A study commissioned by the Institution of Engineering & Technology (IET) has projected that the UK grid will change from hosting 10-15 large generating units providing frequency regulation in 2015, to approximately 600,000 controllable units by 2030 [1]. There is also greater presence of these participants at distribution level and in low voltage networks, rather than at transmission level. Conven-tional methods of frequency control will not be suitable for the projected rapid adoption of DERs [2], particularly due to the need for the network operator to be able to understand the operating conditions and issue real-time control commands for all connected DERs. Furthermore, system inertia is reducing due to the dominance of converter-interfaced DERs and the deployment of HVDC interconnectors [3]. Due to these fac-tors, grids are becoming more sensitive to disturbances, and network operators need to react faster with remedial actions.
One of the solutions to address these challenges is to increase the visibility of the grid using real-time synchrophasor data from Phasor Measurement Units (PMUs). For example, synchrophasor measurements over a wide area can be used to rapidly determine power system dynamics, and thereby guide the activation of power reserves strategically, in specific
regions, to minimize the impact of a disturbance. Furthermore, many utilities globally are migrating legacy communications infrastructure for protection and control systems to modern technologies [4]—this is a key enabler for synchrophasor-based control applications. Moving certain system operator functions to a decentralized nature of control may also help address the challenges associated with these trends, and to leverage new capabilities such as fast-acting responses from converter-interfaced devices [5].
This paper focuses on reviewing recent methods of control using PMU data which have been demonstrated in real-time laboratories environments or field trials. A detailed case study is provided which involves demonstration of a power system with communications—operated between two specialized and physically remote laboratories—to deliver state-of-the-art fast-acting frequency response.
II. CAUTIONS FORUTILIZINGPMU DATA FORCONTROL
A. Overview of Measurement Challenges
Synchrophasor data must be robust to be trusted for use in real-time control and protection applications [6]. There-fore the quality of synchrophasor measurements from PMUs, including timing accuracy, has also been a key topic of research, particularly in Europe [7] and the USA [8], [9]. Research work has highlighted the challenges associated with: measurement quality, which is very important for distribution system applications of PMUs; PMU data quality; PMU timing accuracy [10]; real-time supervisory assessment of multiple PMU data streams [11]; and latency [12]. The importance of rigorous testing of PMU-based systems is strongly emphasized in [13] and analysis of the large-scale PMU data quality issues is given in [14].
Furthermore, the North American SynchroPhasor Initiative (NASPI) presently recommends avoiding the use of PMU data for system-critical operations—unless timing accuracy and resiliency have been fully validated [10].
B. New Measurement Methods
1) Goodness of Fit (GoF) [15]: This method is a relatively simple, online method for assessing the validity of synchropha-sor outputs.
2) ”Underlying” Frequency [16]: Steps in voltage phase, which can result from benign system events, will potentially result in a transient in the derived frequency measurement (and similarly for the rate of change of frequency calculation). This transient could be disruptive to autonomous control systems. It is proposed that a new type of ”underlying frequency” measurand is developed to address this drawback.
3) Transient Phase Offset (TPO) [17]: TPO is a new measurand for enabling accelerated, decentralized primary frequency control through identification of the origin of system frequency disturbances in multi-area synchronous AC grids.
4) Distributed Photonic Sensing: This technology involves passively collecting multiple measurements using a single optical fibre over relatively large distances [18], and may have a role in providing wide-area visibility cost-effectively.
C. Distribution System Issues
The use of PMU data from distribution systems—while offering many potential applications [9]—has the additional caveats that communications networks may be intermittent and provide less bandwidth than would typically be expected for transmission system operations. Furthermore, the time synchronization source for the PMUs may be unreliable.
Intermittency of communications is mitigated in existing commercial devices by using local storage within the PMU to record all PMU reports during communications outages, and replaying these when communications is restored. If communi-cations bandwidth or total data usage (e.g. for metered wireless connections) is a constraint, the PMU could be ”event-driven”, and only transmit data under certain defined conditions, rather than continuously streaming IEEE C37.118.2 data.
III. REVIEW OFSELECTEDWIDE-AREACONTROL
APPROACHES
A. Frequency Control Architectures
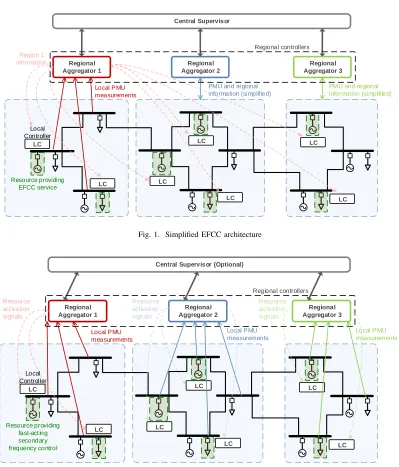
The general process for frequency control using PMUs, with reference to Fig. 1 and Fig. 2, involves the following steps:
1) Multiple synchrophasor measurements from the power system, potentially at transmission and distribution levels, are sent to regional control clusters where the mea-surements are time-aligned and aggregated. The use of regional aggregation of synchrophasor measurements pro-vides visibility of power flows and system angle changes within the region, and avoids relying on a single measure-ment location for system frequency calculation. Multiple measurements from different locations can be averaged, to provide a form of filtering but without additional time delay. The definition of these regions could be based on typical responses during frequency disturbances, e.g. system angular deviations.
2) During normal conditions, i.e. prior to a disturbance, the state of the system is assessed based on the synchrophasor data, and resources are procured to potentially provide
frequency control reserves (if activated). This assessment may be executed by the regional controllers, or by a higher-level central controller.
3) Data is sent from the regional controller to individual devices which may participate in the frequency response (e.g. wind farms, electric vehicles, etc.). This data could include an activation signal or other information (such as aggregated frequency data or an updated droop set-point) which each device would use to control its activation. Furthermore, the regional controller or the individual devices may be responsible for detecting events (such as a large loss of generation) within the region based on the measurements available.
4) A central controller may communicate across multiple regions to propagate system-wide information, e.g. to up-date system inertia status or to help procure the required reserves.
As implied by the above description, the control architecture could be centralized, decentralized, or a hybrid [19]. Computa-tion is potentially required in the measurement devices, in the regional controllers, and in the local devices providing power resources. In terms of communications performance require-ments, low latency (to enable activation of resources rapidly during events) and determinism (such that the frequency response can be executed in a predictable and consistent way) are desired. However, the communications design should also be cost-effective, particularly considering the potentially large number of measurement and activation resources which may need to be accommodated.
Table I summarizes the potential benefits of such a coordi-nated control method for a variety of stakeholders.
B. Enhanced Frequency Control Capability
Fig. 1 illustrates a high-level overview of a frequency con-trol approach which has been tested as part of National Grid’s (the transmission system operator for Great Britain) Enhanced Frequency Control Capability (EFCC) project [21], [22]. The EFCC scheme adopts a distributed control approach, where the monitoring and control functions are mainly achieved through three elements i.e. a Central Supervisor (CS), Local Controllers (LCs), and Regional Aggregators (RAs).
The power system shown in Fig. 1 is greatly simplified— only a few substations and a single voltage level is shown per region, but a real system could consist of resources connected at transmission, distribution, and low voltage. Only three regions are shown, but this approach could scale to larger systems. For simplicity, only generic load and generation symbols are shown, but these could represent a range of different resources e.g. wind farms, energy storage systems, gas turbines, or aggregated devices.
PMU and regional information (simplif ied)
PMU and regional information (simplif ied)
Regional Aggregator 1
Regional Aggregator 2
Regional Aggregator 3
Local PMU measurements
Region 1 information
Central Supervisor
Regional controllers
LC
LC LC
LC
LC LC
LC Local
Controller
[image:3.612.106.505.56.523.2]Resource providing EFCC service
Fig. 1. Simplified EFCC architecture
Local PMU measurements
Local PMU measurements
Regional Aggregator 1
Regional Aggregator 2
Regional Aggregator 3
Local PMU measurements
Central Supervisor (Optional)
Regional controllers
LC
LC LC
LC
LC LC
LC Local
Controller
Resource providing fast-act ing secondary frequency control
Resource activation signals
Resource activation signals
[image:3.612.111.498.68.279.2]Resource activation signals
Fig. 2. Decentralized fast-acting secondary frequency control architecture
into account when calculating the required power contribution from the individual resources. The CS is not required for critical real-time communications, and it only periodically sends and receives updates of system conditions and resource information.
The power system is divided into a number of regions (through “generator-coherency” group studies [23]) and each region is equipped with an RA. Within each region, a number of PMUs are installed for collecting real time measurements. The RA processes the data from these PMUs and produces a regional equivalent of frequency and angle to represent the region.
The output of the RAs are streamed to LCs, which
TABLE I
SUMMARY OFSTAKEHOLDERVALUE FORENHANCEDFREQUENCYCONTROL
Actor/Stakeholder Value
Transmission System Operator
(TSO) • Improved power system stability, despite fundamental grid changes which would be challenging to accommodate with conventional control approaches.
• Improved grid control autonomy.
• Ubiquitous use of synchrophasors and other measurements enable improved grid visibility, and the infrastructure can be used for other purposes (e.g. fault location, sub-synchronous resonance studies, stability monitoring, planning, and power quality assessment).
• Reduced costs due to the efficient provisioning and fast activation of reserves. National Grid, the transmission system operator for Great Britain, estimates that such frequency response systems could save£200-250m (260-330m USD) a year [20].
• Improved power system resilience due to the faster and better-targeted reserve activation, thereby leading to a reduced risk of severe disruptions or blackouts.
DER Owners and Aggregators
• New, flexible arrangements and rewards for providing frequency response roles—particularly for reserves which are capable of a fast-ramping response.
Domestic and Industrial
Cus-tomers • Use of inherent flexibility of demand-side resources, such as electric vehicles; such participation can have financial rewards for customers.
• Improved security of supply despite uncertainty of some generation sources.
• Supports a low carbon energy system with high levels of renewable generation—with associated environmental benefits.
ICT Providers (e.g. vendors of protection, measurement, and communications equipment)
• Opportunities for large-scale deployment of new ICT systems to enable fast-acting measurements and control actions.
Government, Policy, and
Reg-ulation • Has the potential to disrupt existing procedures for power system frequency control and enable new schemes for businesses and end users to participate in ancillary services.
multiple resources, and therefore multiple LCs.
This approach relies upon regional information, for each region, being transmitted to every LC. For simplicity, Fig. 1 only shows the regional data flows for Region 1. Reserves are strategically activated in specific regions to maximize the stability of the system (i.e. to mitigate angular separation between different regions) during major disturbances. This ap-proach does require extensive communications of data between regions, but has a backup mode which can be activated during communications outages.
Another commercial solution for autonomous grid control using real-time PMU data is described briefly in [24].
C. Decentralized Fast-Acting Secondary Frequency Control
Fig. 2 presents an alternative architecture which is based on the activation of fast-acting devices within secondary frequency control [25]. Compared to EFCC, the real-time operation for this approach is fully decentralized, i.e., no real-time information is required to be shared between regions.
D. Pacific DC Intertie Oscillation Damping
The system described in [26], [27] uses real-time PMU data from each end of the Pacific DC Intertie in North America in an active damping control system. The testing demonstrates how inter-area oscillations resulting from relatively large wide-area disturbances (such as resulting from significant changes in connected load or generation) can be mitigated using a fast-acting control method based on PMU data. Focus was also
given on robustly engineering the system such that there was a high level of redundancy, and that the redundant systems could be enabled seamlessly, i.e., without causing an undesir-able step-change in control outputs when switching between redundant PMU data sources. Furthermore, it was important to measure the communications delays for the PMU data to ensure that the control system had a timely and effective response. For example, if the timestamp of the PMU data is older than the threshold of 100 ms (determined through simulation studies), the damping controller is disabled.
IV. VALIDATINGSOLUTIONSCOMBININGPOWER
SYSTEMS ANDCOMMUNICATIONS
A. The Need for Advanced Demonstration Methods
7705 SAR-8 (WAN router) Area 1
Area 2
Area 3
Area 4
Area 5
RTDS Simulation – Great Britain System Model
PMU data
(frequency measurements and power flows)
Real-time area controllers on Beckhoff
CX5020 platform
Area 1 Controll er
Area 2 Controll er
Area 3 Controll er
Area 4 Controll er
Area 5 Controll er
5x GOOSE (layer-2)
7705 SAR-8 (WAN router)
Nuage
NSG-E SD-WAN link to remote laboratory (EIC) 5x PMU
streams (UDP)
5x GOOSE (layer-2)
5x GOOSE (layer-2)
7705 SAR-18 (WAN router)
Nuage NSG-E Dynamic Power Systems Laboratory
University of Strathclyde Glasgow, UK
Energy Innovation Center Nokia
[image:5.612.70.541.58.283.2]Plano, TX, USA
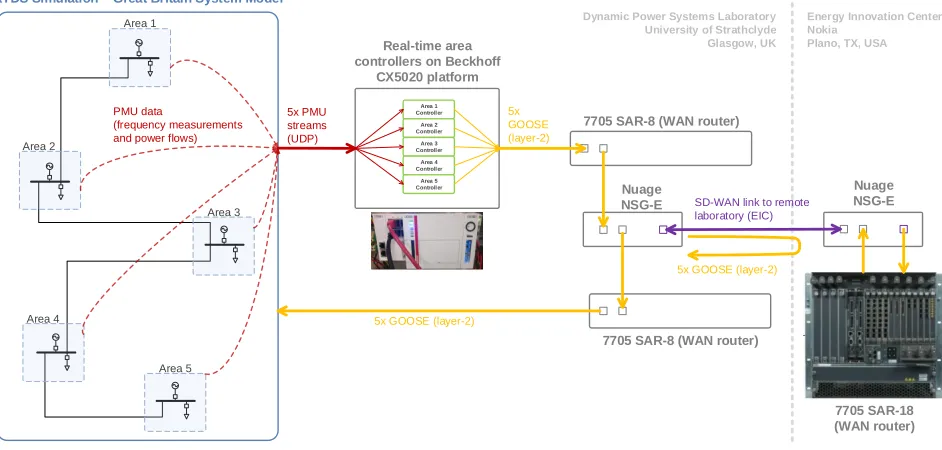
Fig. 3. Dual-laboratory frequency control experiment overview
B. Case Study: Real-Time Decentralized Frequency Control
This subsection presents an example of how multiple labora-tories can collaborate to demonstrate the effectiveness of real-time control. Fig. 3 illustrates a combined case study involving the Dynamic Power Systems Laboratory at the University of Strathclyde, UK, and the Nokia Energy Innovation Center (EIC), USA. The experiment implements the fast-acting con-trol approach given in Fig. 2. A Real Time Digital Simulator (RTDS) represents the Great Britain transmission system di-vided into five control areas (this model is described further in [17]). PMU data streams are produced which represent aggre-gated measurements from each area in the simulation, and the data are delivered to the secondary controllers. Although the five area controllers are executed on the same hardware device, each controller is strictly independent; i.e. the control decisions are decentralized. The controller outputs (i.e. commands which may activate DERs to regulate frequency) are communicated using the IEC 61850 GOOSE protocol, using the software described in [32].
To emulate the wide-area network communications delay, the GOOSE control commands are transmitted back to the RTDS via the remote EIC laboratory (over the public inter-net). This is achieved using a Software-Defined Wide-Area Networking (SD-WAN) router in each laboratory. SD-WAN is being used as a convenient method for securely and efficiently (i.e. without significant real-time overhead for the operational data) transferring arbitrary real-time control signals between two or more laboratories. For example, the system has been provisioned to support management traffic for WAN routers (these traffic flows are not illustrated in Fig. 3 for simplicity) as well as a separate service for real-time GOOSE data. However, there are further benefits of SD-WAN technology—such as
automatically provisioning the WAN for remote substations— which are outside the scope of this paper. Note that, in this case, a layer-2 service has been provisioned for transferring the GOOSE packets, but other approaches (such as layer-3 Routable-GOOSE) can be supported. The PMU data is sent a rate of 100 Hz for each area. The controllers operate at this same rate and also generate GOOSE packets at 100 Hz.
All packets are timestamped and therefore the RTDS can accurately measure the round-trip time for the control action. For the experiment described in this subsection, the total delay is approximately 120 ms (which reduces to 2-3 ms if the link to the remote laboratory is bypassed with a direct Ethernet connection). For comparison, for the distance of approximately 7,200 km between the laboratories and assuming the speed of light in a fibre of 200,000 km/s, the minimum transport time for the round trip is at least 72 ms.
C. Case Study: Analysis of Results
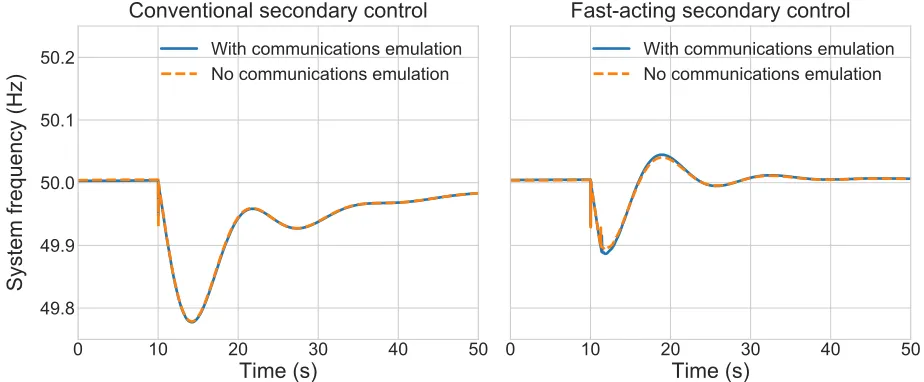
Fig. 4 illustrates the results from a simulated 1 GW step increase in connected load, which is equivalent to a 1 GW loss of generation. The frequency measurement location is taken from Area 1 as shown in Fig. 3. The results illustrate the following:
• Using fast-acting secondary control reduces the magni-tude of the system frequency deviation from the nominal value of 50 Hz, and significantly reduces the time to restore frequency to the nominal value.
• Routing the control signals through a remote laboratory does not significantly affect the results.
7LPHV
6\VWHPIUHTXHQF\+]
&RQYHQWLRQDOVHFRQGDU\FRQWURO
:LWKFRPPXQLFDWLRQVHPXODWLRQ 1RFRPPXQLFDWLRQVHPXODWLRQ
7LPHV
)DVWDFWLQJVHFRQGDU\FRQWURO
[image:6.612.75.537.51.242.2]:LWKFRPPXQLFDWLRQVHPXODWLRQ 1RFRPPXQLFDWLRQVHPXODWLRQ
Fig. 4. Performance of frequency control
large distances. There are also several areas of further inves-tigation which will be reported on in the future:
• Including other physical communications assets within the EIC laboratory, such as microwave links and mobile technologies, to improve the realism of the demonstration.
• Detailed emulation of the communications network in-frastructure for transmitting PMU data to the area con-trollers.
• Including multiple PMU data sources per area, and testing
solutions for resilience.
• Validating additional real-time functions using the PMU
data, such as wide-area backup protection and voltage control.
• Including additional laboratories within the SD-WAN.
V. CONCLUSIONS
This paper has provided an overview of recent developments in using PMU data for real-time control, include the challenges and potential benefits. In particular, there are several on-going efforts to validate frequency control solutions which are fast-acting and are underpinned by PMUs and communications systems.
The case study has proven that complex, multi-laboratory demonstrations of system-critical functions are feasible—even when these laboratories communicate over significant dis-tances. Further research will build on this work to demon-strate more complex and larger scale control and protection solutions.
ACKNOWLEDGMENTS
This work in this paper has been supported by the Nokia En-ergy Innovation Center, Plano, Texas, USA. The work has also been in part supported by the European Commission, under the FP7 project ELECTRA (grant no: 609687) and Horizon 2020 project ERIGrid (grant no: 654113). Any opinions, findings, and conclusions or recommendations expressed in this material
are those of the authors and do not necessarily reflect those of the European Commission.
REFERENCES
[1] G. Ault and J. Scott, “Power System Modelling Issues and Requirements Identified by the IET Power Network Joint Vision Project,” IET, Tech. Rep., 2015. [Online]. Available: http://www.theiet.org/sectors/energy/ documents/modelling-1.cfm?type=pdf
[2] E. Rikos, C. Caerts, M. Cabiati, M. Syed, and G. Burt, “Adaptive Fuzzy Control for Power-Frequency Characteristic Regulation in High-RES Power Systems,” Energies, vol. 10, no. 7, p. 982, 7 2017. [Online]. Available: http://www.mdpi.com/1996-1073/10/7/982
[3] D. Wilson, S. Clark, P. Wall, and V. Terzija, “Advances in Wide Area Monitoring and Control to address Emerging Requirements related to Inertia, Stability and Power Transfer in the GB Power System,” in CIGRE Paris Session B5, 2016.
[4] S. M. Blair, C. D. Booth, B. De Valck, D. Verhulst, and K.-Y. Wong, “Modelling and Analysis of Asymmetrical Latency in Packet-Based Networks for Current Differential Protection Application,”IEEE Transactions on Power Delivery, pp. 1–1, 2017.
[5] E. Guillo Sansano, M. H. Syed, P. Dambrauskas, M. Chen, G. M. Burt, S. D. J. McArthur, and T. Strasser, “Transitioning from centralized to distributed control: using SGAM to support a collaborative development of web of cells architecture for real time control,” inCIRED Workshop, 6 2016, pp. 1–4.
[6] NERC, “Real-Time Application of Synchrophasors for Improving Reliability,” 2010. [Online]. Available: http://www.nerc.com/docs/oc/ rapirtf/RAPIRfinal101710.pdf
[7] EURAMET, “EURAMET Smart Grids II,” 2017. [Online]. Available: http://www.smartgrids2.eu/
[8] NASPI PMU Applications Requirements Task Force, “PMU Data Quality: A Framework for the Attributes of PMU Data Quality and a Methodology for Examining Data Quality Impacts to Synchrophasor Applications,” NASPI, Tech. Rep., 2017. [Online]. Available: https://www.naspi.org/naspi/sites/default/files/reference documents/PARTF WhitePaper 20170314 Final PNNL 26313.pdf [9] A. von Meier, E. Stewart, A. McEachern, M. Andersen, and
L. Mehrmanesh, “Precision Micro-Synchrophasors for Distribution Sys-tems: A Summary of Applications,”IEEE Transactions on Smart Grid, pp. 1–1, 2017.
[10] NASPI Time Synchronization Task Force, “Time Synchronization in the Electric Power System,” NASPI, Tech. Rep., 2017. [Online]. Available: https://www.naspi.org/naspi/sites/default/files/reference documents/tstf electric power system report pnnl 26331 march 2017.pdf
[12] V. Terzija, G. Valverde, Deyu Cai, P. Regulski, V. Madani, J. Fitch, S. Skok, M. M. Begovic, and A. Phadke, “Wide-Area Monitoring, Pro-tection, and Control of Future Electric Power Networks,”Proceedings of the IEEE, vol. 99, no. 1, pp. 80–93, 1 2011.
[13] M. Kezunovic, A. Esmaeilian, T. Becejac, P. Dehghanian, and C. Qian, “Life Cycle Management Tools for Synchrophasor Systems: Why We Need Them and What They Should Entail,”IFAC-PapersOnLine, vol. 49, no. 27, pp. 73–78, 2016.
[14] C. Huang, F. Li, D. Zhou, J. Guo, Z. Pan, Y. Liu, and Y. Liu, “Data quality issues for synchrophasor applications Part I: a review,”Journal of Modern Power Systems and Clean Energy, vol. 4, no. 3, pp. 342–352, 7 2016.
[15] A. Riepnieks and H. Kirkham, “An Introduction to Goodness of Fit for PMU Parameter Estimation,”IEEE Transactions on Power Delivery, vol. 32, no. 5, pp. 2238–2245, 10 2017.
[16] A. J. Roscoe, A. Dysko, B. Marshall, M. Lee, H. Kirkham, and G. Rietveld, “The Case for Redefinition of Frequency and ROCOF to Account for AC Power System Phase Steps,” in2017 IEEE International Workshop on Applied Measurements for Power Systems (AMPS). IEEE, 9 2017.
[17] M. H. Syed, E. Guillo-Sansano, S. M. Blair, A. J. Roscoe, and G. M. Burt, “A Novel Decentralized Responsibilizing Primary Frequency Con-trol,”IEEE Transactions on Power Systems, pp. 1–1, 2018.
[18] S. Blair, G. Burt, N. Gordon, and P. Orr, “Wide area protection and fault location: review and evaluation of PMU-based methods,” inThe 14th International Conference on Developments in Power System Protection (DPSP 2018), 3 2018.
[19] ´A. Ortega and F. Milano, “Frequency Control of Distributed Energy Resources in Distribution Networks,” in 10th Symposium on Control of Power and Energy Systems (IFAC CPES2018), 2018. [Online]. Available: http://faraday1.ucd.ie/archive/papers/freqifac.pdf
[20] National Grid UK, “SMART Frequency Control project — National Grid,” 2015. [Online]. Available: http://www.nationalgridconnecting. com/The balance of power/
[21] P. Wall, N. Shams, V. Terzija, V. Hamidi, C. Grant, D. Wilson, S. Norris, K. Maleka, C. Booth, Q. Hong, and A. Roscoe, “Smart frequency control for the future GB power system,” inIEEE PES ISGT Europe, 2016. [22] Q. Hong, M. Nedd, S. Norris, I. Abdulhadi, M. Karimi, V. Terzija,
B. Marshall, K. Bell, and C. Booth, “Fast frequency response for effective frequency control in power systems with low inertia,” inThe 14th IET International Conference on AC and DC Power Transmission, 2018.
[23] H. You, V. Vittal, and X. Wang, “Slow Coherency-Based Islanding,” IEEE Transactions on Power Systems, vol. 19, no. 1, pp. 483–491, 2 2004.
[24] J. St. John, “Pxise Lands Investment From Mitsui to Expand Real-Time Grid Balancing Software,” 2018. [Online]. Available: https://www. greentechmedia.com/articles/read/pxise-lands-investment-from-mitsui [25] M. H. Syed, E. G. Sansano, S. M. Blair, G. M. Burt, A. Prostejovsky, and
E. Rikos, “Enhanced Load Frequency Control: Incorporating Locational Information for Temporal Enhancement,”IET Generation, Transmission & Distribution (under review), 2018.
[26] B. Pierre, R. Elliott, D. Schoenwald, J. Neely, R. Byrne, D. Trudnowski, and J. Colwell, “Supervisory system for a wide area damping controller using PDCI modulation and real-time PMU feedback,” in 2016 IEEE Power and Energy Society General Meeting (PESGM). IEEE, 2016, pp. 1–5.
[27] B. J. Pierre, F. Wilches-Bernal, D. A. Schoenwald, R. T. Elliott, J. C. Neely, R. H. Byrne, and D. J. Trudnowski, “Open-loop testing results for the pacific DC intertie wide area damping controller,” in2017 IEEE Manchester PowerTech. IEEE, 6 2017, pp. 1–6.
[28] V. H. Nguyen, Y. Besanger, Q. T. Tran, T. L. Nguyen, C. Boudinet, R. Brandl, F. Marten, A. Markou, P. Kotsampopoulos, A. A. van der Meer, E. Guillo-Sansano, G. Lauss, T. I. Strasser, and K. Heussen, “Real-Time Simulation and Hardware-in-the-Loop Approaches for Integrating Renewable Energy Sources into Smart Grids: Challenges & Actions,” in IEEE PES Innovative Smart Grid Technologies ISGT Asia, 2017. [Online]. Available: http://arxiv.org/abs/1710.02306 [29] P. Palensky, A. van der Meer, C. Lopez, A. Joseph, and K. Pan,
“Ap-plied Cosimulation of Intelligent Power Systems: Implementing Hybrid Simulators for Complex Power Systems,” IEEE Industrial Electronics Magazine, vol. 11, no. 2, pp. 6–21, 2017.
[30] P. Dambrauskas, M. H. Syed, S. M. Blair, J. M. Irvine, I. F. Abdulhadi, G. M. Burt, and D. E. M. Bondy, “Impact of realistic communications for fast-acting demand side management,”CIRED - Open Access Pro-ceedings Journal, vol. 2017, no. 1, pp. 1813–1817, 2017.
[31] A. Monti, M. Stevic, S. Vogel, R. W. De Doncker, E. Bompard, A. Estebsari, F. Profumo, R. Hovsapian, M. Mohanpurkar, J. D. Flicker, V. Gevorgian, S. Suryanarayanan, A. K. Srivastava, and A. Benigni, “A Global Real-Time Superlab: Enabling High Penetration of Power Electronics in the Electric Grid,” IEEE Power Electronics Magazine, vol. 5, no. 3, pp. 35–44, 2018.