urn:nbn:de:hebis:34-2017010351802 ISSN: 2363-6033 (online); 1612-9830 (print) – website: www.jarts.info
Multi-methodological characterisation of Costa Rican biochars
from small-scale retort and top-lit updraft stoves and
inter-methodological comparison
Joeri Kaal
a,b,∗, Roberto Calvelo
c, Art Donnelly
d, Anna McBeath
e,
Antonio Martínez Cortizas
b, Hugh McLaughlin
faInstitute for Heritage Science (Incipit), Spanish National Research Council (CSIC), Santiago de Compostela, Spain
bDepartamento de Edafoloxía e Química Agrícola, Fac. Bioloxía, Universidade de Santiago de Compostela,
Campus Sur, Santiago de Compostela, Spain
cNew Zealand Biochar Research Centre, Soil and Earth Sciences Group, Institute of Agriculture and Environment,
Massey University, Palmerston North, New Zealand dSeaChar.Org, University Place, Seattle, USA
eCollege of Science, Technology and Engineering, James Cook University, Cairns, Australia
fNextChar, LLC, Amherst, MA, USA
Abstract
We applied common (pH, elemental analysis, thermogravimetry) and less-common (infrared spectroscopy, GACS adsorption test, pyrolysis-GC-MS, hydrogen pyrolysis) analytical procedures to a set of biochars from Costa Rica (bamboo stalk, cacao chaff, sawmill scrap, coconut husk and orchard prunings feedstocks). The biochars were pro-duced by high temperature combustion in a top-lit updraft stove (TLUD) and low temperature anaerobic charring in a retort (RET), the latter of which was heated by the gas that evolved from the TLUD. The RET biochars exhibit a smaller adsorption capacity, higher molecular diversity and larger proportion of thermolabile materials, because of the lower degree of thermochemical alteration (DTA) and therefore limited formation of the microporous polycondensed aromatic matrix typical of the TLUD biochars. Multivariate statistics showed that DTA, not feedstock composition, controls biochar organic chemistry. The TLUD biochars might be better candidates for soil amendment because of their adsorption capacities and will probably exert a more prolonged effect because of their chemical stability. The cross-comparison of the methods showed the complementarity of especially elemental analysis, GACS, thermogravi-metry, hypy and pyrolysis-GC-MS.
Keywords: biochar, characterisation, Costa Rica, rural communities
1
Introduction
Biochar is thermally modified biomass, such as char-coal obtained from urban, industrial, agricultural or forestry residues, destined for soil amendment. Applica-tions using biochar are increasingly adopted to enhance soil productivity and promote carbon (C) sequestration
∗Corresponding author
Email: [email protected]
(e.g. Lehmann et al., 2006; Fowles, 2007; Laird, 2008; Sohi et al., 2008; Kookana et al., 2011). In soil, biochar acts as a sponge-like material enhancing water and nu-trient retention, reducing erodibility, providing a habitat for soil microorganisms while it also has a liming effect as a result of its ash content. These properties often cul-minate into improved soil productivity and reduced loss of topsoil in agricultural land (Carrión & Badal, 2004; Jeffery et al., 2011; Lehmann et al., 2011). The effects
Published online: January 13, 2017 Open access article licensed under a Creative Commons Attribution 4.0 International License CC BY
of biochar are reportedly stronger in soils with low ad-sorption capacity and pH, and in poor tropical soils with fast organic matter turnover rates (Glaser et al., 2002; Jien & Wang, 2013). However, these effects are di-verse, depending not only on feedstock type and produc-tion condiproduc-tions (e.g. temperature) (Bruun et al., 2008; Peng et al., 2011; Preston & Schmidt, 2006; Zimmer-man, 2010; Zhao et al., 2013), but also on the targeted crop and soil properties (Masiello, 2004; Haefele et al., 2011), giving rise to the need for optimising biochar production conditions to the specific requirements of each soil type and land use (Abiven et al., 2014). Ob-viously, a thorough analysis of the properties of such biochars is a prerequisite to evaluate their suitability for different soil amendment applications.
Among the non-industrial biochar manufacturing sys-tems, often used in rural areas and small farms, is the “Jolly Roger Oven”, which consists of two adapted oil drums, the bottom drum of which is the top-lit updraft (TLUD) gasifier where intense burning converts the feedstock into charcoal (Kearns, 2012; McLaughlin & Clayton, 2012). The top drum, which is sealed, is heated by the exhaust rising from the TLUD and therefore acts like a retort (RET) oven in which the biomass is charred under oxygen-depleted conditions. In Costa Rica, sev-eral field studies, mostly in banana, coffee and cacao agroforestry contexts have demonstrated the potential of biochar to enhance soil properties and plant growth. For example, cacao biochar improved cacao seed pro-duction, especially when biochar was combined with a fertiliser such as poultry manure (Acosta Buitrago, 2013; Hojah da Silva, 2013). These studies have been performed with the focus on socio-economic benefits for indigenous communities, who sell the biochar pro-duced in essentially smoke-free cook-stoves (Schultz, 2013). The directly appreciable utility of cleaner cook-stoves, for biochar production, is an essential ingredi-ent of small-scale biochar applications in rural areas where migrating Ngöbe-Buglé indigenous populations (with very basic household equipment) account for a significant part of the harvesting labour of the afore-mentioned crops. Current applications in Costa Rica include the use of coffee prunings, again in TLUD cook-stoves, for biochar production (Scholz et al., 2014). In addition, there is considerable interest in the poten-tial alleviation of the damaging effects on cacao pods of the pathogens “mazorca negra” (Phytophthora sp.) and “molinia” (Moniliophthora roreri), by biochar ap-plication. The characterisation of the biochars applied had hitherto been limited to elemental composition and nutrient retention assays. Knowledge on the properties
of these biochars, which are currently under field trial experimentation, is needed to optimise their implemen-tation strategy.
This study addresses the properties of the organic matter of TLUD and RET biochars obtained from sev-eral important feedstocks in Costa Rica: bamboo stalk, cacao chaff and sawmill scrap. In addition, we stud-ied TLUD biochars of orchard prunings and coconut husk. This is not a typical characterisation study of small amounts of biochar produced in the laboratory, but of biochars that are being created in rural areas of Costa Rica and are currently used as a soil amendment. We analysed these biochars for ash content, elemental composition, pH-H2O, Fourier-transform infrared
spec-troscopy (FTIR), pyrolysis-gas chromatography-mass spectrometry (pyrolysis-GC-MS), hydrogen pyrolysis (hypy), thermogravimetry (TG) and gravimetric adsorp-tion capacity scan (GACS). For the first time, hypy residues were analysed by pyrolysis-GC-MS to identify the nature of the residual volatiles. The assessment of general, molecular and adsorption properties is not only expected to shed light on the properties of these biochars and make cautious predictions on their likely effects on soil conditions, but also generate knowledge on biochar chemistry and on the complementarities of the method-ologies applied.
2
Materials and methods
2.1 Feedstocks
Cacao chaff was obtained from fresh cacao pods at APPTA Fair Trade (Talamanca, Costa Rica). Bamboo stalk and coconut husk were obtained from their dir-ect surroundings. The sawmill scrap was obtained from the nearby mill and the mixed orchard prunings were taken from the branches of isolated trees in a nearby ba-nana field in the surroundings of the plant. The orch-ard prunings are composed mainly of, but not limited to, branches of Inga edulis (guabo) and Erythrina sp. (poró).
2.2 Biochar production
TLUD, was sealed using local wet clay. The max-imum temperature within a run was close to 450 ºC (co-inciding with the moment of maximum temperature in the TLUD). The coconut husk and orchard prunings biochars were produced in an Estufa Finca cookstove, which is a TLUD-system with a smaller volume than the TLUD from the Jolly Roger Oven. No RET biochars are available for these feedstocks. The Estufa Finca is used for cooking by rural communities and more than 4500 kg of the resultant biochar has already been sold and implemented into numerous agricultural fields. The temperature profile in the Estufa Finca is 550–650 ºC. Biochars were homogenised and ball-milled to powder before analysis.
2.3 Biochar characterisation
2.3.1 Chemical characterisation and thermal analysis
The elemental composition was determined in three different laboratories. Proportions of C, H, N, O and S were determined on a Vario MACRO cube CHNS ele-mental analyser (Elementar Analysensysteme GmbH, Hanau, Germany). In addition, C and N content were determined by dry combustion using a LECO analyser (model CHN-1000), and C content was measured on a Costech 4010 elemental analyser. Values for C content (three laboratories) were almost identical, with diff er-ences below 1 % and linear determination coefficients (r2) between 0.996 and 0.999 (P<0.0001). Nitrogen content showed larger differences (15±11 %) because of the low N content of the biochars that were produced from materials other than cacao chaff, but were also strongly correlated (r2=0.998, P<0.0001). We only present data for the more complete elemental analysis using the Vario MACRO cube CHNS and those data are used for inter-methodological comparisons.
The pH in water was measured in 1:10 w:v in deion-ised water, after 60 minutes of equilibration in an orbital shaker.
Thermogravimetric TG and derivative (DTG) curves were obtained using an SDT Q600 instrument. The weight loss between 110 and 900 ºC in a N2
atmos-phere was considered as the biochar volatile matter con-tent, whereas the loss of weight at 900 ºC after the in-troduction of air current was considered as the stable, thermo-resistant fraction or fixed C (Cfixed). The
frac-tion of volatile matter with respect to the sum of volat-ile matter content and Cfixed is considered as the
ther-molabile fraction of biochar (Cthermo, ash-free, dry
mat-ter basis; expressed as %). Ash content is the fraction of the sample material remaining after combustion of
Cfixed(Calvelo Pereira et al., 2011). This method is also
known as proximate analysis.
The inorganic C (Cinorg) content of the biochars
was estimated by measuring the weight loss
associ-ated with the endothermic peak at ca. 600–850 °C
(Calvelo Pereira et al., 2011; Wang et al., 2014). Weight loss and/or peak area changes were assessed as CO2
mass loss but corrected to calculate Cinorg.
2.3.2 Gravimetric Adsorption Capacity Scan (GACS)
The GACS adsorption test was applied using a custom-built modified TG analyser as described by McLaughlin (2010). Briefly, biochar is placed in 1.5 mL wire basket, suspended below an analytical balance in a heated N2-purged chamber, with a thermocouple located
above the sample inside the wire basket. The balance is tared at 100 ºC, after which the chamber is heated to 300 ºC at 13.3 ºC min−1. At that point, the purge gas is replaced by 1,1,1,2-tetra-fluoro-ethane (a refrigerant known as R134a) and the chamber allowed to cool to ambient temperature at 4 ºC min−1. The weight gain
of the sample during cooling, caused by adsorption of R134a, is a measure of the adsorption capacity.
2.3.3 Fourier-Transform Infrared spectroscopy (FTIR)
Attenuated total reflectance FTIR was performed using a Gladi-ATR (Pike Technologies) spectrometer, scanning in the 4000–400 cm−1 region. The weak
sig-nal implied that adequate baseline subtraction was not always feasible and that the FTIR spectra could not be reliably quantified.
2.3.4 Pyrolysis-GC-MS
For pyrolysis-GC-MS, biochar samples were pyro-lysed at 750 °C for 10 seconds, with a heating rate of 10 °C ms−1. The relatively high analytical pyrolysis temperature proved the most suitable temperature for biochar analysis using pyrolysis-GC-MS (Kaal et al., 2009). Briefly, 1–1.5 mg of sample was placed in fire-polished quartz tubes with quartz wool on both ends and pyrolysed using a resistive heating Pt-filament CDS Pyroprobe 5250. The pyrolysis products were trans-ferred into a 6890N gas chromatograph (Agilent Tech-nologies) by He flow (1 mL min−1), separated on a HP-5MS polysiloxane-based column (temperature program 60–325 ºC at 20 ºC min−1, 5 min dwell time) and
which was reduced to 101 compounds by combining unresolved isomers and eliminating potential contamin-ation products (phthalates and styrenes). The 101 com-pounds were quantified using their primary ion frag-ments (m/z). Relative proportions of each pyrolysis product are expressed as percentage of total quantified peak area (TQPA). TQPA is a rough measure of sig-nal intensity and therefore sample pyrolysability (Kaal
et al., 2009).
2.3.5 Hydrogen pyrolysis (hypy)
The proportion of stable polycyclic aromatic car-bon (SPAC) of biochar, expressed as the percentage of total C (Ct), was determined by hypy following
(Meredith et al., 2012; Wurster et al., 2012; McBeath
et al., 2015). Briefly, a Mo catalyst was added to ca.
100 mg of sample using an aqueous/methanol solution of ammonium dioxydithiomolybdate. Catalyst loaded samples were placed in the hypy reactor, which was pressurised with H2 to 150 bar with a purge gas flow
of 5 L min−1. The reactor was heated initially at 300 ºC min−1 to 250 ºC and then at 8 ºC min−1 to 550 ºC, and
then held at maximum temperature for 2 min. The Ct
content of the sample residue after hypy was determined by elemental analysis using a Costech 4010. The error associated with the estimation of SPAC content is bet-ter than ±4 % of the measured value (McBeath et al., 2015). The hypy residues were analysed by pyrolysis-GC-MS (see above) to assess the presence and proper-ties of volatile components.
2.4 Data evaluation
Differences between TLUD and RET biochars were tested using One-way ANOVA (SPSS 20), and
con-sidered significant when the probability of the null hy-pothesis (no difference between the groups) was below 0.05. Relationships between continuous variables were tested by Pearson linear determination coefficients (r2).
A Principal Component Analysis (PCA) was performed in order to illustrate the relative similarities and diff er-ences between selected parameters, after standardisation (Z-scores) of the data.
3
Results
3.1 Elemental composition and pH
The Ct content of the biochars ranged between 550
and 870 g kg−1(Table 1). The cacao chaffbiochars (RET and TLUD) have lowest Ct content, also if the Ct
con-tent is corrected for ash (not shown). The (atomic) ratios from elemental analysis are corrected for the minor con-tents of Cinorg as determined by thermogravimetry (see
section 3.2). Cacao chaffbiochars have the highest N content and lowest Corg/N ratio, reflecting the nature of
this protein-rich feedstock. The N content and Corg/N
ratios of the other biochars are<10 g kg−1 and>115,
respectively (Table 1). The S content was below the de-tection limit except for the biochars from cacao chaff and bamboo stalk. The H/Corg ratio ranged from 0.21
to 0.88 and the O/Corgratio from 0.03 to 0.18. They are
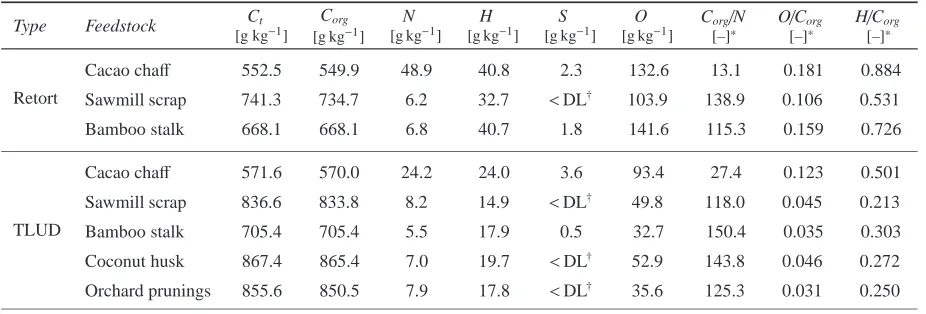
higher for the RET biochars than for the TLUD biochars (P<0.01 and P<0.05, respectively). The Van Krevelen plot (Fig. 1) shows that the cacao chaffTLUD biochar is closer to the range of the RET biochars.
[image:4.595.75.538.587.744.2]The pH in water of the biochars ranged from 8.3 to 10.5 (Table 2). TLUD biochars seem to have slightly higher pH (9.9–10.5) than the RET biochars (8.3–10.0), but this difference is insignificant (P=0.054).
Table 1: Elemental composition of the biochars analysed (all values on dry matter basis)
Type Feedstock Ct
[g kg−1]
Corg
[g kg−1]
N
[g kg−1]
H
[g kg−1]
S
[g kg−1]
O
[g kg−1]
Corg/N
[–]*
O/Corg
[–]*
H/Corg
[–]*
Retort
Cacao chaff 552.5 549.9 48.9 40.8 2.3 132.6 13.1 0.181 0.884
Sawmill scrap 741.3 734.7 6.2 32.7 <DL† 103.9 138.9 0.106 0.531
Bamboo stalk 668.1 668.1 6.8 40.7 1.8 141.6 115.3 0.159 0.726
TLUD
Cacao chaff 571.6 570.0 24.2 24.0 3.6 93.4 27.4 0.123 0.501
Sawmill scrap 836.6 833.8 8.2 14.9 <DL† 49.8 118.0 0.045 0.213
Bamboo stalk 705.4 705.4 5.5 17.9 0.5 32.7 150.4 0.035 0.303
Coconut husk 867.4 865.4 7.0 19.7 <DL† 52.9 143.8 0.046 0.272
Orchard prunings 855.6 850.5 7.9 17.8 <DL† 35.6 125.3 0.031 0.250
Fig. 1: Van Krevelen plot of the biochars analysed (atomic
ra-tios of O/Corgand H/Corg).
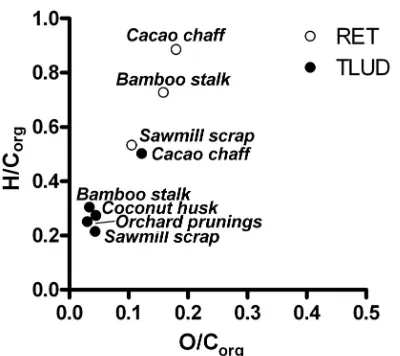
3.2 Thermogravimetry
The ash content (on a dry weight basis) ranged from 50 to 285 g kg−1(Table 2). Highest ash contents were
measured for the cacao chaff biochars (TLUD and
RET). There are no significant differences between the ash contents of the TLUD and RET biochars. The RET biochars (35±10 %) have a larger proportion of ther-molabile C (Cthermo) than the TLUD biochars (18±8 %)
(P<0.05). The proportion of Cinorg, which can be
re-cognised from a peak in the differential mass loss curve around 650 ºC (Fig. 2), was up to 6.6 g kg−1 with no
apparent differences between feedstocks or production types. The differential mass loss curve obtained of the RET biochars (Fig. 2a) shows that the cacao biochar produced a broad (composed) peak between 200 and 500 ºC. The mass loss of the bamboo RET biochar is concentrated in a very broad band in the range 350– 600 ºC, while the sawmill scrap RET biochar shows minor and gradually increasing weight loss in the same region. The differential mass loss curve of the TLUD biochars (Fig. 2b) shows few peaks, which is indicative of their thermal stability. In fact, the most prominent peak at ca. 650 ºC corresponds to Cinorg.
3.3 GACS adsorption capacity
The GACS test showed that the RET samples have much lower adsorption capacity for R134a (20– 45 g kg−1) than the TLUD equivalents (50–100 g kg−1) (n=6; P<0.05) (Table 2). The sawmill scrap TLUD biochar has the highest GACS value, showing an ad-sorption isotherm very similar to that of the CC#14 ref-erence sample (McLaughlin, 2010), whereas the saw-mill scrap RET biochar has the highest adsorption ca-pacity of the RET biochars, which can be explained by the generally larger surface areas of biochars from
wood feedstock (Zhao et al., 2013). From comparison with the GACS analyses of a reference set of pine- and oak-derived biochars produced at 350, 450 and 550 ºC, in general the RET biochars show adsorption behaviour similar to that of the 450 ºC chars, except for the Bam-boo biochar which is more similar to pine-350 ºC, while the TLUD isotherms more closely resemble that of the 550 ºC biochars (McLaughlin, 2010).
Previous comparative tests of TLUD biochars using other measures of adsorption capacity showed that the GACS test is linearly related to e.g. the N2-BET surface
area (McLaughlin, 2010). The advantage of the GACS test using R134a over BET-surface analysis is that the latter requires more costly equipment and that R134a is larger and heavier than N2 or CO2, more relevant to
the adsorption of soil constituents such as nutrients and contaminants.
3.4 Fourier-Transform Infrared spectroscopy (FTIR)
FTIR absorbance spectra are presented in Fig. 3. Several TLUD samples (sawmill scrap, bamboo stalk, coconut husk, orchard prunings) showed very weak ab-sorbance, indicative of the virtual absence of any func-tional group other than hybridised C bonds in
poly-nuclear aromatic clusters. The cacao chaff TLUD
biochar showed slightly better signal, mainly of the O-H stretch (3400 cm−1), C-O stretch (1030 cm−1), phen-olic O-H bend (1430 cm−1) and aromatic ring stretch at
ca. 1610 cm−1, with minor aromatic bands at 1720 cm−1.
These groups can all be traced back to aromatic groups with partial substitution by hydroxyl groups, typical of high-temperature charcoal (Sharma et al., 2004; Keilu-weit et al., 2010; Rutherford et al., 2012).
Qualitatively, the RET samples showed some more
functional group diversity. Especially the cacao
chaffsample exhibited significant peaks of symmetric and asymmetric methyl (CH3) and methylene (CH2)
stretches at 2920 and 2850 cm−1, traces of which can also be recognised in the bamboo RET sample. Further-more, the band at 1030 cm−1(aromatic C-O) is relatively
narrow in the cacao RET and TLUD biochar and shif-ted towards 1000 cm−1, which most likely corresponds
Table 2: Proximate analysis, pH, adsorption capacity (GACS) and stable polycondensed aromatic carbon
(SPAC, from hypy analysis) (all values on dry matter basis).
Type Feedstock [g kgash−1]
Cinorg
[g kg−1]
Cvolatile
[g kg−1]
Cfixed
[g kg−1]
Cthermo*
[–]
pH-H2O
[–]
GACS
[g kg−1]
Retort
Cacao chaff 223 2.7 350 428 44.98 10.03 20.71
Sawmill scrap 116 6.6 223 661 25.19 9.43 41.4
Bamboo stalk 141 <DL† 304 555 35.35 8.33 26.85
TLUD
Cacao chaff 283 1.6 237 480 33.09 10.15 N/A
Sawmill scrap 91 2.8 140 769 15.44 10.49 91.18
Bamboo stalk 238 <DL† 120 642 15.77 10.13 56.22
Coconut husk 53 1.9 121 826 12.8 10.33 70.62
Orchard prunings 83 5.1 132 785 14.38 9.87 50.85
*Thermolabile C (volatile matter/(volatile matter+Fixed C)*100 %);†Below detection limit
Fig. 2: Proximate of the biochars analysed: thermogravimetric (TG; mass
change, %) and derivative (DTG; mass change with temperature, % °C−1) curves
[image:6.595.149.451.318.689.2]Fig. 3: FTIR spectroscopy spectra of the biochars analysed. Wavenumbers of selected bands are indicated (see text).
3.5 Pyrolysis-GC-MS
Example pyrolysis chromatograms are shown in Fig-ure 4a. In all samples, aromatic hydrocarbons are the dominant pyrolysis products (Table 3). Monocyclic aro-matics hydrocarbons (MAHs) with one to three alkyl C substitutions account for 59±25 % of TQPA, and are more abundant in TLUD (67±29 %) than in RET pyro-lyzates (47±14 %) (P<0.05). Polycyclic aromatic hy-drocarbons (PAHs) account for 9±5 %. The sum of MAHs, PAHs and benzonitriles, which represent the
more intensely charred fraction of Black C (Kaal et al., 2009), account for 70±21 %. The RET biochars show larger proportions of indenes (indene and C1-indenes)
and benzofurans (C1- and C2-benzofurans), than the
Fig. 4: Total ion current chromatograms from pyrolysis-GC-MS of selected biochars. a) Original biochars. b) Hypy residues.
Closed circles=n-alkanes, open circles=n-alkenes.
Table 3: Pyrolysis-GC-MS product groups from the biochars analysed and their relative proportions (%) of total quantified peak
area (TQPA). TQPA and the benzene/toluene ratio are presented as well.
Type Feedstock MAH
[%]
PAH
[%]
ALK
[%]
FA
[%]
PHE*
[%]
NC
[%]
CARB
[%]
LIG
[%]
OTHER
[%]
TQPA
[–]
B/T
[–]
Retort
Cacao chaff 38.6 4.3 25.6 0.6 12.9 14.5 0.8 0.3 2.4 2.5E+07 0.33
Sawmill scrap 38.5 11.3 9.6 4.7 23.6 3.3 2.1 2.2 4.7 2.8E+06 0.54
Bamboo stalk 63.0 9.9 2.1 2.1 9.9 3.7 2.9 4.0 2.3 3.9E+06 0.94
TLUD
Cacao chaff 81.2 5.7 4.8 0.0 0.0 4.0 0.0 0.0 4.4 2.5E+05 3.58
Sawmill scrap 100.0 0.0 0.0 0.0 0.0 0.0 0.0 0.0 0.0 4.9E+04 3.10
Bamboo stalk 22.4 17.9 15.9 20.3 10.8 2.7 2.6 3.3 4.1 5.6E+05 1.25
Coconut husk 61.6 10.9 18.2 0.1 1.0 1.8 3.2 0.0 3.3 6.6E+05 2.48
Orchard prunings 70.1 8.8 15.4 0.0 0.0 3.1 0.0 0.0 2.5 2.3E+05 1.51
[image:8.595.72.540.586.722.2]Pyrolysis products of lignin, which can be recognised from the methoxylic groups in guaiacols and syringols, account for 1.2±1.7 %. The RET biochars have sig-nificantly larger relative proportions of guaiacols (guai-acol, 4-ethylguaiacol and C3-guaiacol). Among the
RET biochars, this intact lignin is more abundant in the biochars from lignocellulosic feedstock (bamboo, 4.0 %; sawmill scrap 2.2 %) than in the cacao chaff (0.3 %). In the TLUD biochars, lignin could only be detected in the bamboo biochar (3.3 %). Considering that the methoxylic group of lignin is completely elim-inated at 400–450 ºC even under anaerobic conditions (Kaal et al., 2012a), the RET biochars were at least par-tially subjected to highest treatment temperatures (HTT) below that range. The presence of lignin in the bamboo stalk TLUD biochar suggests that some of the biomass was incompletely charred, as the HTT of that sample was well-above 600 ºC.
Phenols account for 7.3±8.6 %, and are more abun-dant in the RET biochars (P<0.05). Nonetheless, the bamboo TLUD biochar also produced a significant pro-portion of phenols. Phenols can have multiple origins, including uncharred lignin and protein. Therefore, in the RET biochars, their precursor is unknown. Considering the presence of methoxyphenols in the bamboo TLUD biochar, the phenols probably originate from partially rearranged lignin as well (Kaal et al., 2012b).
Nitrogen-containing compounds (4.1±4.4 %) are more abundant in the cacao chaffbiochars than in the other biochars, which reflects the abundance of protein in this feedstock. Benzonitrile is the unambiguous prin-cipal N-containing compound of strongly charred bio-mass (Kaal et al., 2009). The C1-benzonitriles and
in-dole, on the other hand, represent more weakly altered N-containing precursors, and they are enriched in the RET biochars. The same N-containing compounds were detected in the pyrolysates of chicken manure biochar (Schnitzer et al., 2007).
Recognisable products of carbohydrates (1.5±1.4 %) originate from charred polysaccharides such as cellulose and hemicellulose. Their low abundance is indicative of the thorough rearrangement of polysaccharides, which is generally known to be the most thermolabile of the main constituents of plant biomass. This also suggests that there are no uncarbonised cores in the biochars ana-lysed (Skjemstad et al., 1996). The RET biochars have significantly larger relative proportions of acetylfuran (P<0.05).
The benzene/toluene (B/T) ratio (Table 3) represents the degree of polycondensation of Black C samples, with high values corresponding to a higher abundance of
polycondensed aromatic clusters. The TLUD samples consist of more (P<0.05) polycondensed moieties rep-resented by high B/T ratios (2.4±1.0), even though the bamboo TLUD sample has a B/T ratio of 1.3, which is closer to the range of the RET biochar B/T ratios (0.6±0.3). The naphthalene/methylnaphthalenes (N/C1
N) ratio (Kaal et al., 2009) cannot be applied as two TLUD biochars did not produce naphthalene (sawmill scrap) or methylnaphthalenes (cacao chaff).
The measure of signal intensity TQPA, varied con-siderably between 5×10⁴ and 3×10⁷ (Table 3). Re-tort biochars have significantly (P < 0.001) higher TQPA (3×10⁶–3×10⁷) than TLUD biochars (5×10³– 7×10⁴), which indicates that the fraction of non-pyrolysable polycondensed aromatic clusters is higher in the TLUD biochars. The theoretical relation between TQPA and the percentage of mass loss between 110 ºC and 750 ºC by thermogravimetry was confirmed by lin-ear (r2=0.58, P<0.01) and exponential (r2=0.70, P<
0.05) correlations.
3.6 Hypy and pyrolysis-GC-MS of hypy residues
The proportion of the organic C that remained after hypy treatment, i.e. stable polycyclic aromatic car-bon (% SPAC), ranged between 16 and 50 % for the RET biochars and 90–100 % for the TLUD biochars (Table 4), being significantly higher in the latter (P< 0.001). The proportion of SPAC of the sawmill scrap RET biochar is much larger (50 %) than that of cacao chaffand bamboo stalk RET biochars (17–19 %).
For the first time, hypy residues were analysed by pyrolysis-GC-MS to identify the nature of the residual volatiles (Fig. 4b), even though this might reflect only a minor portion of the C present after hypy. Ben-zene was more abundant (P<0.05) among the pyro-lysis products of the hypy residues of TLUD biochars (11–43 % RET, 43–87 % TLUD), whereas C2-benzenes
were more abundant in the RET biochars (P< 0.05)
(Table 4). The PAHs identified were naphthalene,
B/T ratio also increased 2–18-fold. Clearly, the more condensed nature of the TLUD biochars can still be re-cognised after hypy treatment.
4
Discussion
4.1 Inter-method comparison
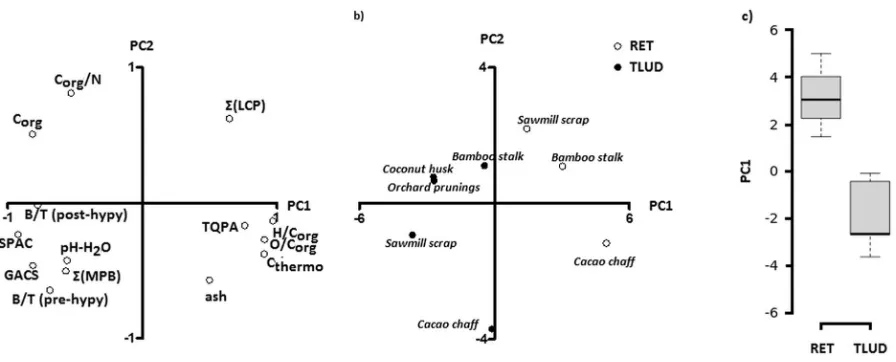
Figure 5a shows the Factor 1–Factor 2 plot of the loadings of the selection of parameters from the dif-ferent methodologies: elemental analysis (Corg, Corg/N,
H/Corg, O/Corg), pH-H2O, GACS adsorption capacity,
thermogravimetry (ash content, Cthermo),
pyrolysis-GC-MS ((MAHs, PAHs, benzonitrile), (lignin, carbo-hydrates, phenols), TQPA, B/T ratio) and hypy (% SPAC, B/T post-hypy). Principal component 1 (PC1) explains 57 % of total variance. High positive loadings (>0.71, i.e.>50 % of variance explained) are observed for H/Corg, O/Corg, Cthermo , (lignin, carbohydrates,
phenols) and TQPA. This set of parameters reflects the abundance of labile components of the biochars. Strong negative loadings are observed for Corg, GACS
ad-sorption capacity, B/T (pre- and post-hypy), (MAHs, PAHs, benzonitrile) and % SPAC. These parameters re-flect the degree of aromatisation, aromatic polycondens-ation and surface area. Clearly, PC1 is indicative of the degree of thermochemical alteration (DTA), with negative values corresponding to more strongly altered biomass. With increasing DTA, there is a progressive conversion into a microporous network of polyaromatic clusters, independent of the feedstock used. The ra-tionale for the link between this process and the outcome of the methodologies applied is as follows: (1) with in-creasing DTA, there is a progressive elimination of
func-tional groups and accumulation of the C-dominated aro-matic clusters, which explains the positive loadings of H/Corg/N and O/Corgand negative loading of Corg and,
qualitatively, the elimination of non-aromatic bands in the FTIR spectra. (2) Obviously, with increasing DTA, the thermal stability measured by thermogravimetry in-creases, hence the positive loading of Cthermo. (3) The
polyaromatic clusters that accumulate with increasing DTA are well-known to be responsible for the surface area of biochars, which explains the negative loading of the GACS adsorption capacity. Furthermore, more com-plete burnout of volatiles with increasing DTA will have contributed to the enhanced adsorption capacity. (4) With increasing DTA, the susceptibility of the biochar to analytical pyrolysis decreases, and therefore TQPA has a positive loading. The B/T ratio, on the other hand, is inverse to the abundance of alkyl-cross bridges between aromatic groups, which are progressively elim-inated with increasing DTA, hence B/T has a negative loading on PC1. Considering the large differences in DTA between the biochars, it is not surprising that most variables are related to DTA, which also turned out to control most biochar properties in other characterisa-tion studies (Zhao et al., 2013, and references therein). Moreover, the degree of aromatic polycondensation, re-flected by DTA, was the controlling factor in biochar stability after soil amendment (Kuzyakov et al., 2014) and laboratory ageing experiments (Mašek et al., 2013).
The main source of variation in DTA is the difference between the RET and TLUD biochars: the RET samples have positive scores on PC1 (1.5–5.0), while the TLUD biochars have negative scores (-0.1– -3.6) (Fig. 5b). The RET-derived biochars more closely resemble the nature of the feedstock than the TLUD-derived biochars,
be-Table 4: Proportion of hydrogen pyrolysis (hypy)-resistant stable polycyclic aromatic carbon (SPAC)
and the composition of the pyrolysates obtained PY-GC-MS of the hypy residue.
Type Feedstock SPAC
[% Ct]
MAH
[%]
PAH
[%]
BN
[%]
B/T
[–]
Retort
Cacao chaff 19.2 43.0 54.4 2.6 5.6
Sawmill scrap 49.9 54.4 45.6 0.0 5.3
Bamboo stalk 16.8 20.7 77.6 1.7 1.7
TLUD
Cacao chaff 97.6 53.1 46.9 0.0 6.7
Sawmill scrap 103.2 86.1 13.9 0.0 22.1
Bamboo stalk 89.6 69.2 30.8 0.0 5.7
Coconut husk 91.8 72.7 27.2 0.1 13.2
Orchard prunings 102.2 91.0 9.0 0.0 27.3
[image:10.595.127.486.590.734.2]Fig. 5: Principal component analysis of selected parameters. a) PC1 and PC2 loadings (B/T=benzene toluene ratio; before and after hypy);(MPB)=sum monocyclic aromatic hydrocarbons, polycyclic aromatic hydrocarbons and benzonitrile;(LCP) =sum lignin, carbohydrates and phenols; GACS=adsorption capacity; SPAC=stable polycyclic aromatic carbon; Cthermo=
thermolabile C. b) PC1 and PC2 scores of the retort and TLUD biochars. c) Boxplot of the PC1 scores of the retort and TLUD biochars.
cause the TLUD stove conditions induce a higher DTA to the feedstock. As such, using thermogravimetry, the RET biochars have larger proportions of Cthermo
and, using FTIR, the RET biochars show more exten-sive O-containing functional groups (mostly -OH and -OCH3), which is corroborated by the presence of
phen-ols from moderately charred lignin and methoxyphenphen-ols from non- and weakly-charred lignin in lignocellulose-derived biochars, and evidence of intact peptide ma-terial in the cacao chaff-derived RET biochar. On the other hand, the TLUD biochars are composed primarily of clusters of polycondensed aromatic structures, which explain their higher SPAC content, GACS adsorption capacity, B/T ratio and low Cthermo and TQPA values.
Apart from the difference in PC1 scores between RET and TLUD biochars, it is worth mentioning that the saw-mill scrap RET biochar seems to have been subjected to higher DTA than the other RET biochars, as evidenced by the intermediate PC1 scores, H/Corg and % SPAC
levels.
PC2 (22 % of total variance) has a large positive load-ing for Corg/N and moderate positive loadings for Corg
and (lignin, carbohydrates, phenols), whereas nega-tive loadings correspond to ash content, GACS adsorp-tion capacity and the B/T ratio. The cacao-derived biochars have the highest negative scores on PC2. In combination with the strong loadings of Corg/N, this
suggests that PC2 reflects the influence of feedstock type, in particular its N content.
There are several observations that cannot be fully ex-plained from DTA and the contrast between TLUD and
RET biochars. Firstly, the pyrolysis-GC-MS pyrolys-ate of the bamboo TLUD biochar is a clear outlier as it contains traces of lignin and n-alkanoic acids, which are thermolabile above 400–450 ºC (Kaal et al., 2012a,b), yet this sample is predominantly composed of poly-condensed aromatic structures, evidenced by the high GACS adsorption capacity and SPAC content. Hence, this biochar must contain a fraction of biomass that was incompletely charred, possibly isolated in a corner of the TLUD barrel or within larger fragments of bamboo feedstock. This minor proportion of weakly and non-charred biomass will cause strongly biased results by pyrolysis-GC-MS because of the different thermal sta-bilities (and therefore pyrolysasta-bilities) of the two com-ponents. It is probably reflected in the corresponding DTG curve at 250 ºC (Fig. 2b).
Secondly, the N content of the biochars is very low, with the exception of the cacao chaff biochars, which can be explained by their high protein content. As expected, the sum of N-containing pyrolysis products by pyrolysis-GC-MS is correlated to N content (P < 0.001) and inverse to the C/N ratio (P < 0.05), but also inverse to Cthermo(P<0.05), which might suggest
The methodologies applied allowed for a detailed as-sessment of the organic matter present in the biochars analysed. All evidence combined, the H/Corgand SPAC
seem to be the most reliable parameters to determine DTA of biochar, which is related directly to biochar sta-bility. The pyrolysis-GC-MS results were in agreement with these parameters, but overestimate the abundance of labile biochar components for biochars with appar-ently heterogeneous HTT, which calls for cautious inter-pretation. Nonetheless, pyrolysis-GC-MS is the method that gives the most detailed information on the mo-lecular properties of the biochars. Thermogravimetry allowed for correcting the elemental analysis data for Cinorg, which is essential to calculate the H/Corg. In
add-ition, it provides an indication of the abundance of labile structures. FTIR data could not be quantified and in this case FTIR appeared less useful for biochar characterisa-tion. The GACS adsorption test provides a useful and cost-efficient estimation of effective surface area.
4.2 Detailed biochar characterisation
RET biochars. The cacao chaffbiochar has a high N content some of which corresponds to intact proteins, which suggests that it may have beneficial short-term impacts on soil productivity (Jeffery et al., 2011). Be-cause of its high ash content it could be suitable for local application in cacao plantations, which require ash-rich biochars (Chepote et al., 2007; Hojah da Silva, 2013). However, this biochar has very low DTA and adsorption capacity, which implies that it will probably be degraded to a significant extent after implementation into soil and that it is probably of limited use for water and nutrient retention as well. The sawmill scrap biochar has the highest C and SPAC contents, the lowest proportion of Cthermoand strongest GACS adsorption capacity, which
implies that it is probably the most stable biochar after soil amendment and has a strong water and nutrient re-tention. The large proportion of Cthermo, small SPAC
and low DTA suggest that the bamboo stalk biochar con-sists mainly of labile components which limits its poten-tial as a long-term soil enhancement. This biochar has the lowest adsorption capacity, the lowest pH-H2O and
high Corg/N ratio, suggesting that this biochar is not
ef-ficient in liming or improvement of the adsorption com-plex neither.
TLUD biochars. The biochar from cacao chaff has a very large SPAC content (98 %) and a pyrolysis-GC-MS fingerprint typical of biochars with high DTA (dom-inated by MAHs and PAHS). By contrast, the relatively large proportion of Cthermo(33 %) suggests that a
signifi-cant fraction of this biochar might be susceptible to de-gradation, which implies that there remains uncertainty
on its stability of this biochar. The N-rich nature of the feedstock is reflected by the low Corg/N and
abund-ance of benzonitrile. The TLUD biochars from sawmill scrap, coconut husk and mixed orchard prunings have high GACS adsorption capacity and consist almost com-pletely of polyaromatic domains, with very little ther-molabile material (Cthermo12–15 %, SPAC 92–103 %).
These biochars may be expected to be resistant to de-gradation and increase a soil’s adsorption capacity on the long-term. Finally, the high SPAC, Corg, B/T and
ad-sorption capacity, in combination with the small propor-tion of Cthermo(16 %), suggests that the bamboo biochar
has high stability and adsorption capacity. However, this biochar also contains incompletely charred organic matter (aliphatic material and traces of lignin and carbo-hydrates). It has the highest Corg/N ratio of the biochars
analysed (150) and, following Haefele et al. (2011), such biochars should be preferably applied to poor and sandy soils. This would also apply to the other biochars, except for the cacao RET and TLUD biochars.
5
Conclusions
The methods applied here, and particularly the com-bination of GACS, thermogravimetry, elemental analy-sis, hypy and pyrolysis-GC-MS, are complementary as their cross-comparison allowed for a better understand-ing of the results from each of them individually. The retort biochars were subjected to a lower degree of ther-mochemical alteration (DTA) than the TLUD biochars. From the statistical assessment of all data by PCA, the properties that reflect DTA become more pronounced in the order: Cacao RET <Bamboo RET <Sawmill scrap RET<Cacao TLUD<Bamboo TLUD<Coconut TLUD < Orchard prunings TLUD < Sawmill scrap TLUD. In general, the TLUD biochars have greater sta-bility and adsorption capacity, suggesting that their po-tential as a C sink and long-term sponge for water and nutrients exceed that of the RET biochars. On the other hand, and in addition to a limited retention capacity, the RET biochars contain labile material that might act as a nutrient source. In addition, the RET biochars have ap-peared excellent cooking fuels.
Acknowledgements
(Tala-manca, Costa Rica), Gabriela Soto, Tamara Benjamin (CATIE) and Kate Selting (Seachar) for their generous support, and two anonymous reviewers for their valu-able comments.
References
Abiven, S., Schmidt, M. W. I. & Lehmann, J. (2014). Biochar by design. Nature Geoscience, 7, 326–327.
Acosta Buitrago, J. O. (2013). Evaluación del uso de biochar y microorganismos benéficos en cacao (Theobroma cacao L.) y banano (Gros Michel AAA “Cocos”) en sistemas agroforestales de Costa Rica.
Master’s thesis, Centro Agronómico Tropical de In-vestigación y Enseñanza (CATIE), Turrialba, Costa Rica.
Apaydın-Varol, E. & Eren Pütün, A. (2012). Preparation and characterization of pyrolytic chars from different biomass samples. Journal of Analytical and Applied
Pyrolysis, 98, 29–36.
Bruun, S., Jensen, E. S. & Jensen, L. S. (2008). Micro-bial mineralization and assimilation of black carbon: dependency on degree of thermal alteration. Organic
Geochemistry, 39, 839–845.
Calvelo Pereira, R., Kaal, J., Camps-Arbestain, M., Pardo Lorenzo, R., Aitkenhead, W., Hedley, M., Macías, F., Hindmarsh, J. & Maciá-Agulló, J. A. (2011). Contribution to characterisation of biochar to estimate the labile fraction of carbon. Organic
Geo-chemistry, 42, 1331–1342.
Carrión, I. & Badal, E. (2004). La presencia de hongos e insectos xilófagos en el carbón arqueológico: prop-uestas de interpretación. In: Avances en arqueometría : 2003. pp. 98–106, Universidad de Cádiz.
Chepote, R. E., Santana, S. D., Araujo, Q. R., Sodré, G. A., Reis, E. L., Pacheco, R. G., Marrocos, P. C. L., Serôdio, M. H. C. F., Menezes, A. A. & Valle, R. R. (2007). Aptidão agrícola e fertilidade de solos para a cultura do cacaueiro. In: Valle, R. R. (ed.),
Ciên-cia, tecnologia e manejo do cacaueiro. Ilhéus, Bahia,
Brazil. Pp. 467.
Coates, J. (2000). Interpretation of Infrared Spectra, A Practical Approach. In: Meyers, R. A. (ed.),
Encyc-lopedia of Analytical Chemistry. pp. 10815–10837,
John Wiley & Sons, Ltd, Chichester.
Fowles, M. (2007). Black carbon sequestration as
an alternative to bioenergy. Biomass& Bioenergy,
31, 426–432.
Glaser, B., Lehmann, J. & Zech, W. (2002). Ameli-orating physical and chemical properties of highly weathered soils in the tropics with charcoal: A re-view. Biology and Fertility of Soils, 35, 219—230.
Haefele, S. M., Konboon, Y., Wongboon, W., Amarante, S., Maarifat, A. A., Pfeiffer, E. M. & Knoblauch, C. (2011). Effects and fate of biochar from rice residues in rice-based systems. Field Crops Research, 121, 430–440.
Hojah da Silva, J. (2013). Impacto del uso de
biocar-bón sobre la calidad de suelos y producción de cacao (Theobroma cacao L.) en sistemas agroforestales, Re-serva Indígena Bribri, Talamanca, Costa Rica.
Mas-ter’s thesis, Centro Agronómico Tropical de Invest-igación y Enseñanza (CATIE), Turrialba, Costa Rica.
Jeffery, S., Verheijen, F. G. A., van der Velde, M. & Bas-tos, A. C. (2011). A quantitative review of the effects of biochar application to soils on crop productivity using meta-analysis. Agriculture, Ecosystems& En-vironment, 144, 175–187.
Jien, S.-H. & Wang, C.-S. (2013). Effects of biochar on soil properties and erosion potential in a highly weathered soil. Catena, 110, 225–233.
Kaal, J., Martínez Cortizas, A., Reyes, O. & Soliño,
M. (2012a). Molecular characterization of Ulex
europaeus biochar obtained from laboratory heat treatment experiments – A pyrolysis–GC/MS study.
Journal of Analytical and Applied Pyrolysis, 95, 205–
212.
Kaal, J., Nierop, K. G. J. & Martínez Cortizas, A. (2009). Characterisation of aged charcoal using a coil probe pyrolysis-GC/MS method optimised for black carbon. Journal of Analytical and Applied Pyrolysis, 85, 408–416.
Kaal, J., Schneider, M. P. W. & Schmidt, M. W. I. (2012b). Rapid molecular screening of black car-bon (biochar) thermosequences obtained from chest-nut wood and rice straw: A pyrolysis-GC/MS study.
Biomass&Bioenergy, 45, 115–129.
Kearns, J. (2012). Gasifier and Retort Char System. Aqueous Solutions publishers, pp. 1–6. Available at: http://www.aqsolutions.org/images/2010/06/ JRO-handbook.pdf (last accessed: 12.02.2016).
Keiluweit, M., Nico, P. S., Johnson, M. G. &
Kle-ber, M. (2010). Dynamic molecular structure
of plant biomass-derived black carbon compounds (biochar). Environmental Science & Technology,
Kookana, R. S., Sarmah, A. K., Van Zwieten, L., Krull, E. & Singh, B. (2011). Biochar application to soil: Agronomic and environmental benefits and uninten-ded consequences. Advances in Agronomy, 112, 103– 143.
Kuzyakov, Y., Bogomolova, I. & Glaser, B. (2014). Biochar stability in soil: Decomposition during eight years and transformation as assessed by compound-specific14C analysis. Soil Biology&Biochemistry,
70, 229–236.
Laird, D. A. (2008). The charcoal vision: A win-win-win scenario for simultaneously producing bioenergy, permanently sequestering carbon, while improving soil and water quality. Agronomy Journal, 100, 178– 181.
Lehmann, J., Gaunt, J. & Rondon, M. (2006). Bio-char sequestration in terrestrial ecosystems – a
re-view. Mitigation and Adaptation Strategies for
Global Change, 11, 403–427.
Lehmann, J., Rillig, M. C., Thies, J., Masiello, C. A., Hockaday, W. C. & Crowley, D. (2011). Biochar ef-fects on soil biota: A review. Soil Biology & Bio-chemistry, 43, 1812–1836.
Mašek, O., Brownsort, P., Cross, A. & Sohi, S. (2013). Influence of production conditions on the yield and environmental stability of biochar. Fuel, 103, 151– 155.
Masiello, C. A. (2004). New directions in black carbon organic geochemistry. Marine Chemistry, 92, 201– 213.
McBeath, A. V., Wurster, C. M. & Bird, M. I. (2015). Influence of feedstock properties and pyrolysis con-ditions on biochar carbon stability as determined by hydrogen pyrolysis. Biomass&Bioenergy, 73, 155–
173.
McLaughlin, H. (2010). Schenkel and Shenxue revisited - implications on char production and biochar proper-ties. Appendix B: GACS assay for measuring adsorp-tion capacity. Biochar2010 Conference, Ames, Iowa, June 2010.
McLaughlin, H. & Clayton, D. (2012). The “Jolly Ro-ger Ovens” family of biochar-making devices. Avail-able at: http://www.biochar-international.org/node/ 3064 (last accessed: 12.02.2016).
Meredith, W., Ascough, P. L., Bird, M. I., Large, D. J., Snape, C. E., Sun, Y. & Tilston, E. L. (2012). Assess-ment of hydropyrolysis as a method for the quantific-ation of black carbon using standard reference materi-als. Geochimica et Cosmochimica Acta, 97, 131–147.
Peng, X., Ye, L. L., Wang, C. H., Zhou, H. & Sun, B. (2011). Temperature- and duration dependent rice straw-derived biochar: characteristics and its effects on soil properties of an Ultisol in southern China. Soil
&Tillage Research, 112, 159–166.
Preston, C. M. & Schmidt, M. W. I. (2006). Black (pyro-genic) carbon: a synthesis of current knowledge and uncertainties with special consideration of boreal re-gions. Biogeosciences, 3, 397–420.
Rutherford, D. W., Wershaw, R. L., Rostad, C. E. & Kelly, C. N. (2012). Effect of formation conditions on biochars: Compositional and structural properties of cellulose, lignin, and pine biochars. Biomass&
Bioenergy, 46, 693–701.
Schnitzer, M. I., Monreal, C. M., Jandl, G., Lein-weber, P. & Fransham, P. B. (2007). The conver-sion of chicken manure to biooil by fast pyrolysis II. Analysis of chicken manure, biooils, and char by curie-point pyrolysis-gas chromatography/mass spec-trometry (Cp Py-GC/MS). Journal of Environmental
Science and Health Part B, 42, 79–95.
Scholz, S. M., Sembres, T., Roberts, K., Whitman, T., Wilson, K. & Lehmann, J. (2014). Biochar Systems
for Smallholders in Developing Countries: Lever-aging Current Knowledge and Exploring Future Po-tential for Climate-Smart Agriculture. World Bank
Studies. Washington, DC: World Bank.
Schultz, S. (2013). Biochar cookstoves boost
health for people and crops. National
Geoo-graphic News, January 29. Available at:
http://news.nationalgeographic.com/news/energy/ 2013/01/130129-biochar-clean-cookstoves/ (last accessed: 12.02.2016).
Sharma, R. K., Wooten, J. B., Baliga, V. L., Lin, X., Geoffrey Chan, W. & Hajaligol, M. R. (2004). Char-acterization of chars from pyrolysis of lignin. Fuel, 83, 1469–1482.
Sigua, G. C., Novak, J. M., Watts, D. W., Cantrell, K. B., Shumaker, P. D., Szögi, A. A. & Johnson, M. G. (2014). Carbon mineralization in two ultisols amended with different sources and particle sizes of pyrolyzed biochar. Chemosphere, 103, 313–321.
Skjemstad, J. O., Clarke, P., Taylor, J. A., Oades, J. M. & McClure, S. G. (1996). The chemistry and nature of protected carbon in soil. Australian Journal of Soil
Sohi, S., Lopez-Capel, E., Krull, E. & Bol, R. (2008). Biochar, climate change and soil: A review to guide future research. CSIRO Land and Water Science Re-port 05/09.
Wang, T., Camps-Arbestain, M., Hedley, M., Singh, B. P., Calvelo-Pereira, R. & Wang, C. (2014). De-termination of carbonate-C in biochars. Soil Re-search, 52 (5), 495–504.
Wurster, C. M., Lloyd, J., Goodrick, I., Saiz, G. & Bird, M. I. (2012). Quantifying the abundance and stable isotope composition of pyrogenic carbon using hy-drogen pyrolysis. Rapid Communications in Mass
Spectrometry, 26, 2690–2696.
Zhao, L., Cao, X., Mašek, O. & Zimmerman, A. (2013). Heterogeneity of biochar properties as a function of feedstock sources and production temperatures.
Journal of Hazardous Materials, 256–257, 1–9.
Zimmerman, A. R. (2010). Abiotic and
micro-bial oxidation of laboratory-produced black carbon (biochar). Environmental Science & Technology,