City, University of London Institutional Repository
Citation
:
Montes-Rojas, G. (2013). Can Poor Countries Lobby for More US Bilateral Aid?. World Development, 44, pp. 77-87. doi: 10.1016/j.worlddev.2012.12.006This is the accepted version of the paper.
This version of the publication may differ from the final published
version.
Permanent repository link:
http://openaccess.city.ac.uk/12038/Link to published version
:
http://dx.doi.org/10.1016/j.worlddev.2012.12.006Copyright and reuse:
City Research Online aims to make research
outputs of City, University of London available to a wider audience.
Copyright and Moral Rights remain with the author(s) and/or copyright
holders. URLs from City Research Online may be freely distributed and
linked to.
City Research Online: http://openaccess.city.ac.uk/ [email protected]
WD1308R1 - 2nd Revision
Can poor countries lobby for more US bilateral aid?
Abstract
This article explores if countries can lobby the US government for the allocation of
US bilateral foreign aid. We consider an informational lobby model where lobbying
have two effects. First, a direct effect by informing US policymakers about their
countries’ needs. Second, an indirect effect on policymakers by informing them about
common interests in economic or geopolitical terms. The lobbyist thus influences the
decisions about the allocation of aid resources. We estimate the effect of the recipient
country’s lobbying agents in obtaining foreign aid. The econometric results show that
lobbying positively affects the amount of bilateral aid received.
JEL Classification: F50, O19.
1
INTRODUCTION
Bilateral and multilateral aid is increasingly selective and allocated by donors
on the basis of objective criteria. Three-fourths of aid agencies, including Denmark,
Norway, Sweden, the United Kingdom, Ireland, and the Netherlands, have a positive
relationship between their aid allocations and a measure of sound policies and
institu-tions, after controlling for per capita GDP and population (Dollar and Levin, 2006).
The US has established the Millennium Challenge in 2004 where aid is related to
governance indicators. However, constructing a governance indicator is a futile task
and certainly a subjective and political one. In fact, the US Congress have significant
discretionary power to decide which country “deserves” US taxpayer money in the
form of aid. This study explores if recipient countries’ lobbying activities affects the
amount of US bilateral foreign aid.
Even though many other countries engage in substantial bilateral aid, we focus
on the US because this country systematically records data on lobbying activities
by foreign agents through the Foreign Agent Registration Act of 1938 (FARA), and
Nev-ertheless, the results in this paper are also useful to understand other bilateral aid
relations. In the economics literature, there are some studies on the effect of foreign
lobbying on trade using data from FARA (Gawande, Krishna, and Robbins, 2006;
Kee, Olarreaga and Silva, 2007; Gawande, Maloney and Montes-Rojas, 2009). These
studies share the common feature that foreign lobbying is used for trade related
pur-poses. Our study extends this literature beyond trade. The econometric results in
this paper show that lobbying affects the amount of aid received, but the reverse
effect (i.e. whether aid actually increases lobbying) is not statistically significant.
Our results are robust to the inclusion of a rich set of controls, such as other sources
of aid, bilateral trade and corruption and institutional development in the recipient
country.
The amount of literature analyzing the effect of foreign aid on economic growth
and the allocation of foreign aid between donor and recipient countries is staggering.
References to the aid allocation literature can be found in the survey by McGilivray
(2003), the book by Neumeyer (2003) and the data rich analysis by Berthelemy
ours. Alesina and Dollar (2000) find evidence that the direction of foreign aid is
dictated by political and strategic considerations, rather than by the economic needs
or performance of the recipients. Alesina and Weder (2002) analyzes whether corrupt
countries receive more aid. Chong, Gradstein and Calderon (2001) analyze the effect
of foreign aid on inequaity and poverty. Goldsmith (2001) studies if foreign aid
leads to state failure in Africa. Trumbull and Wall (1994) and Claessens, Cassimon
and Van Campenhout (2009) empirically study the allocation of aid among recipient
countries. Another branch of the literature, which is relevant for the study, is the
degree of “US policy influence” in aid allocations. Rigorous empirical analysis of
IMF’s allocation policy, using alignment with the US in UN-assembly voting, started
with Thacker (1999) and Barro and Lee (2005), while Andersen et al. (2006) shows
that the UN-voting behavior also has a bearing on World Bank allocations. The
reverse, i.e. the US use of aid to buy votes, is analyzed by Dreher et al. (2008).
The closest study to ours is Lahiri and Raimondos-Møller (2000), who argue
that preferences of ethnic groups within the donor country influence the allocation
party in power, and the amount that they contribute is contingent upon the policy
the government adopts. Contrary to Lahiri and Raimondos-Møller (2000) study, our
study is the first to estimate the influence of the recipient country’s lobbying agents
in obtaining foreign aid, where the foreign agent could be both the government and
private groups.
This paper is organized as follows. Section 2 discusses foreign lobbying in the
US. Section 3 presents the data and its sources. Section 4 presents the econometric
results. The last section concludes.
2
FOREIGN LOBBYING IN THE US
The Foreign Agent Registration Act of 1938 (FARA) provides a legal channel for
foreign governments and businesses to lobby the US government and to influence the
US public opinion. The main restriction is that such foreign “principals”must hire
an “agent” based in the US. These agents may contact the US government or engage
in a public relations capacity on behalf of the foreign principal. For simplicity, we
as a single individual the “lobbyist”. Moreover, we consider the US Congress as the
only US government agency of interest for our purposes of the allocation of bilateral
aid. Through this FARA channel, lobbying by foreign governments and foreign
busi-nesses has become a large and thriving industry. Foreign lobbying is not necessarily
the purview of rich countries, although it is positively correlated with the country’s
GDP per capita. A variety of rich and poor countries participate in lobbying
activ-ities through FARA channels. Moreover, it encompasses a wide range of activactiv-ities,
including lobbying those connected with the US government, lobbying the media,
and incurring expenditures on promoting trade through advertising (Husted, 1991).
The model of Austen-Smith and Wright (1992, 1994) stylizes lobbying. The main
premise of the model is that interest groups have private information about the
consequences of a legislative decision. Suppose the interest groups are government
and private agencies in countries interested in receiving foreign aid. The “policy”
they care about is the allocation of US aid where the US policymakers are relatively
uninformed. Austen-Smith and Wright predict that interest groups choose to lobby
the lobbyists. This implies that foreign principals use FARA agents to push US
policymakers’ priors closer to their own.
The effect of interest groups and lobbyists on government policy has been studied
in many areas. For instance, in a recent application, Facchini, Mayda and Mishra
(2011) find robust evidence that both pro- and anti-immigration interest groups play
a statistically significant and economically relevant role in shaping migration across
sectors in the US. Using the FARA data, Gawande, Krishna, and Robbins (2006)
study the impact of foreign lobbying on US protectionism and in a related vein, Kee,
Olarreaga and Silva (2007) analyze whether South American lobbies succeeded in
lowering US tariff preferences against those countries. In this case, foreign
lobby-ing “buys” reduction in a partner’s protectionism. The rollback of US protection
confers large rents to foreign exporters, and those exporters (via the help of FARA
agents) initiate the lobbying efforts (see also the model in Gawande and
Bandhopad-hyay, 2000). Gawande, Maloney and Montes-Rojas (2009) view foreign lobbying as
informational lobbying with the intention of effectively achieving the goal of trade
behalf of their clients for a large but finite pool of tourists.
The informational lobbying considered here follows the FARA studies where the
US Congress decisions are affected by the common interests between the US and the
foreign country. Lobbying may not have the direct purpose of attracting aid and it
is in fact done by a variety of agents (eg. government agency, industry association,
large private firms, ONGs) for a variety of reasons. However, on aggregate, these
unrelated lobbying activities inform US policymakers about their countries’ needs
(e.g. earthquake, severe drought, civil war, spread of infectious diseases, production
of narcotics, etc.) and about common interests in economic (trade, investment) or
geopolitical terms. This new set of information from the lobbyists influences the
decisions about the allocation of aid resources. Thus, the informational lobbying
model pursued here predicts that,ceteris paribus, the US Congress prefers to allocate
more bilateral aid to the countries from which citizens or associations lobbied them
more. Contrary to Lahiri and Raimondos-Møller (2000) study, where ethnic groups
within the donor country influence the allocation of foreign aid, we estimate the
Since many countries simultaneously compete for aid, lobbying may potentially
have two effects: first, it may increase the amount of resources available for foreign
aid for all countries; and second, it may compete with other countries for a larger
portion of a given amount of aid. This paper interest lies in the net effect of lobbying
on attracting aid, which is the result of a potentially non-cooperative game among
recipients. Of theoretical relevance is the question of whether lobbying competition
among them may be used strategically by policymakers being lobbied to capture rents
without benefiting any lobbyist. The ability of the policymaker being lobbied to take
advantage of lobbying competition and corner the rents is well established in the case
ofquid pro quo lobbying (e.g. Grossman and Helpman, 1994), but it is not clear if it
holds in the case of informational lobbying (Gawande et al., 2009). In the Grossman
and Helpman (1994) model the policymaker’s objective function explicitly trades off
public welfare for lobbying dollars, since the policy distortion that lobbies want causes
welfare loss. This sets the stage for cornering rents from lobbying competition since
the policymaker can now economize on the distortions and yet maximize lobbying
trade-off at all. The policymaker loses nothing by using the information-provision
by all lobbyists to update his priors and take the optimal (welfare-maximizing or
poverty-reduction) actions with respect to each of them separately.
3
DATA
We consider two subsamples based on the recipients’ GDP per capita, one for
GDP pc ≤U S$5,000 (117 countries, 1500 observations) and another for GDP pc≤
U S$10,000 (141 countries, 1812 observations). Summary statistics of the variables
used in the next section appear in Table 1.
The data set used in the estimation of our empirical model was assembled using
reports that FARA requires the US Attorney General to make available to Congress.
The report collects information about foreign agents operating within the United
States. A foreign agent, in the view of the US Department of Justice, is somebody
who (a) engages in political activities or acts in a public relations capacity for a
foreign principal, (b) solicits or dispenses anything of value within the United States
any agency or official of the US government. Each entry in the FARA semi-annual
reports contains (i) the name and address of the foreign agent, (ii) the name of the
foreign principal (usually an industry association or a government agency), (iii) the
purpose of the agency, including any US government entities contacted, and (iv)
amount of money paid to the agencies for their services. The results presented in
this paper use data taken from the reports that covered calendar years 1997-2009.
We collect each data entry provided by the US Congress and record the money spend
and the nationality of the foreign agent. Some entries are not specifically associated
to a country but to a region. Examples of those are regional tourism association, such
as the Caribbean Tourism Association. We opted to exclude this observations rather
than imputing the countries that belong to this regions for three reasons. First, the
imputation method (population or GDP or other) is arbitrary. Second, intra-regional
bargaining power is unknown and may vary depending on the nature of the lobby.
Third, US bilateral aid is assigned on a country-basis rather than on a
regional-basis. Our data do not include expenditures spent directly by the foreign principal
policymakers. While the FARA reports provide information about the money paid
by foreign countries and the industry they represent, they do not provide information
about how that money is used to achieve its objectives in (iii). Therefore, given the
informational lobbying model we use in the last section, we aggregate all lobbying
expenditures by year and country.
The data obtained from the FARA registries is summarized in the Appendix in
Table A1 (only for our sample of GDP pc ≤U S$10,000, 141 countries). In general
countries that lobbied the most are the largest countries (China, India, Russia, etc.)
and those with the closest economic and geopolitical ties with the US (i.e. Israel,
Mexico, Colombia, Saudi Arabia, together with those that want to change their
image in the US such as Venezuela and Libya). Moreover, lobbying per capita is
higher for countries with geopolitical ties with the US (i.e. Colombia, Saudi Arabia).
Countries that lobby do not necessarily lobby all years, and in general, different
foreign agents from the same country may have entries in different years. In fact,
different agents of the same nationality may lobby for different and even competing
lobbying. Another issue is a country like Tibet which has independent FARA entries,
but it does not have other information used in the regression analysis, and thus it
is excluded from our sample. We impute a value of 1 to make the logarithm equal
to 0 in those cases. Note that the fact that lobbying entries have different purposes
determine that a value of 0 does not correspond to a case of sample selection.
US Foreign Aid is taken from the US Overseas Loans and Grants, U.S. Bureau
of Census International Database. See http://gbk.eads.usaidallnet.gov/data/
fast-facts.htmlfor an overview. This database comprises several programs. Total
US assistance is disaggregated intoeconomic and military assistance. Each
compo-nent, however, may not be exclusive and it seems rather arbitrary. For instance, the
programs “Nonproliferation, Anti-Terrorism, Demining and Related” or “Narcotic
Control” might have an effect both on military capabilities and in poverty reduction.
Moreover,military assistance is closely related to direct expenditures on the country,
such as in Afghanistan, Colombia and Iraq. Thus, we aggregate total aid and we do
not pursue an analysis by type of aid. US aid is given to governmental institutions
Appendix Table A1 for the sample of countries used in the regression results below,
GDP pc≤U S$10,000, 141 countries. As we did for lobbying we impute a value of 1
to make the logarithm equal to 0 in those cases with no aid. However, in our sample
only 57 observations have a value of 0 aid, and this correspond to a few countries for
some years: Bhutan, Fiji, Iran, Lybia, Montenegro and Serbia.
GDP, population, net official development assistance (ODA) and corruption index
are taken from the World Development Indicators. ODA consists of disbursements
of loans made on concessional terms (net of repayments of principal) and grants by
official agencies of the members of the Development Assistance Committee (DAC),
by multilateral institutions, and by non-DAC countries to promote economic
devel-opment and welfare in countries and territories in the DAC list of ODA recipients.
It includes loans with a grant element of at least 25 percent (calculated at a rate of
discount of 10 percent). US trade variables are obtained from the US Department
of Commerce, Bureau of the Census, Foreign Trade.
We also consider the Corruption Control, produced by the World Bank and that
petty and grand forms of corruption, as well as “capture” of the state by elites and
private interests. It is coded from -2.5 to 2.5 with higher values corresponding with
better governance outcomes. This index is selected because it comprises the larger
number of countries (it has values for our sample of 141 countries) and years. It has
a strong correlation with other indexes with less observations, such as Rule of Law
(from the World Bank; it measures the extent to which agents have confidence in
and abide by the rules of society, in particular the quality of contract enforcement,
the police, and the courts, as well as the likelihood of crime and violence) and
the Corruption Perceptions Index (CPI) produced by Transparency International
measures the perceived level of public-sector corruption.
US trade variables (bilateral exports and imports) are obtained from the US
Department of Commerce, Bureau of the Census, Foreign Trade. Finally, alignment
with the US in UN-assembly voting is taken from the United Nations General
Assem-bly Voting Data mantained by Georgetown University, Department of Government
(http://dvn.iq.harvard.edu/dvn/dv/Voeten/faces/study/StudyPage.xhtml?studyId=
each country coincides with the US on the General Assembly on an annual basis.
Recipient countries’ needs are captured by aggregate data for all distasters, all
countries on an annual basis, estimated damage costs (U$S), from the Emergency
Events Database (http://www.emdat.be/). We transform the data to real terms and
computed the log value (imputing a value of 1 for the nonexistent log of 0). This
variable is now defined as Disaster.
4
ECONOMETRIC RESULTS
(a) Econometric models
Our interest lies in evaluating the link between foreign lobbying and foreign aid
for the period 1997-2009. Consider a panel data model of the form
ln(Aidi,t) =βln(Lobbyi,t−1) +γXi,t+µi+δt+i,t, (1)
whereidenotes country,tyear,Aidforeign aid,Lobbyrepresents the FARA lobbying
model with country- and time-specific effects. Country fixed-effects are intended
to capture country’s characteristics that cannot be controlled for using available
covariates. Year fixed-effects capture the business cycle in the US and global events
(such as 9/11), which affect the availability of resources and the US government
preferences for their allocation. See Trumbull and Wall (1994), Hansen and Tarp
(2001) and Claessens, Cassimon and Van Campenhout (2009) for a discussion about
the importance of using a fixed-effects specification. All covariates are lagged one
period to account for the fact that aid allocation decisions in the US Congress are
based on past information and that they are expected to have a certain delay. The
preferred specification uses one lag. Alternative specifications where we include two
(or more) lags of all the variables instead of one, that is t−1 and t−2, reported
similar results (not reported but available from the Author upon request). For all
variables, the coefficient corresponding to t−2 is not significant while that of t−1
is similar to the reduced specification with one lag.
Nominal variables are deflated to constant 2000 US dollars using the US GDP
in logs and real terms but with no other standardization. Alternative specifications
could use the variables in per capita or in GDP terms. In the baseline model we
include the lagged value of the logarithm of GDP (deflated to constant 2000 US
dollars), ln(GDPi,t−1), and the logarithm of population, ln(P OPi,t−1). As a result
β measures the elasticity of the effect on aid of increasing lobbying, conditional
on a given country size, given by the joint consideration of population and GDP.
Comparable results are obtained if we consider the variables in per capita or GDP
terms (not reported but available from the Author upon request).
Although model (1) would determine whether lobbying affects aid, a dynamic
specification is more appropriate for this particular sample. First, aid programs are
likely to show significant persistence. Aid programs usually spread over several years
once they start (in particular for multiannual programs), and similar to investment
models, they may include fixed costs (setting up an agency to administer the funds,
contacting local agents or governments, etc.) before the program starts working. In
our short panel 1997-2009 where yearly data is used this persistence is significant.
Gawande et al. (2009) proposes to use a dynamic specification to account for the
fact that lobbying has both a short-run and long-run effect. Therefore, the proposed
dynamic model is
ln(Aidi,t) =αln(Aidi,t−1) +βln(Lobbyi,t−1) +γXi,t+µi +δt+i,t. (2)
The long-run effect ofLobby onAid is 1−βα.
In dynamic panel data models with unobserved effects, the treatment of the
initial observations is an important theoretical and practical problem. As is well
known, the usual within estimator is inconsistent, and can be badly biased. We thus
follow the Anderson and Hsiao (1981) and Arellano and Bond (1991) strategy by
taking first order differences and using lagged values of the dependent variable and
other covariates in levels to instrument the autoregressive dependent variable. These
instruments are also valid for other potential endogenous variables. Thus we also
use instruments for the lobbying variable while we consider that all other covariates
(population, GDP, year dummies) are exogenous. In particular, we implement the
properties. The validity of this econometric method depends on the suitability of the
instruments. We report Hansen tests for over identification restrictions and Arellano
and Bond (1991) test AR(2) for second order serial correlation of the residuals. In
all cases, the tests cannot reject the null hypothesis of validity of the Blundell and
Bond (1998) instrumental variables strategy.
The System GMM estimator may suffer however from instrument proliferation
when all possible instruments are used in the GMM. This leads to the non-rejection
of the overidentification tests (Hansen test is weak as the number of instrument
in-creases, see Bowsher, 2002). A proposed solution in the literature is to reduce the
number of instruments by reducing the number of lags, or by collapsing some of
the instruments (see Roodman, 2009). We follow this strategy and report Roodman
(2009, pp.148-149) collapsed instruments System GMM estimator (this is
imple-mented by the optioncollapsein STATA), and we produce a separate table where
different System GMM estimators are compared in order to check the robustness of
the results. In particular, the System GMM estimator where only the first available
the lag 2, i.e. t−2, is used as an instrument) and not additional instruments are
constructed, and the full Blundell and Bond (1998) estimator with the maximum
number of instruments. In each case I report the number of instruments constructed
by the GMM estimator.
(b) Results
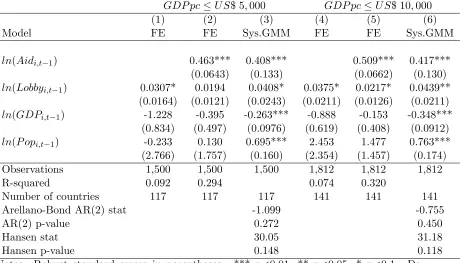
Table 2 studies the effect of FARA lobbying onTotal US Assistance forGDP pc≤
U S$5,000 andGDP pc≤U S$10,000 for the simplest baseline model. For both
sub-samples, the FE static estimation in columns (1) and (4) show a positive and
statis-tically significant effect of FARA. These estimates suggest that increasing lobbying
activities by 1% increases aid on average by 0.03%. The dynamic panel data
specifi-cation shows that aid disbursements are persistent with an autoregressive coefficient
of 0.463 and 0.509 for for GDP pc ≤ U S$5,000 and GDP pc ≤ U S$10,000,
respec-tively. In these cases columns (2) and (5) show that the short run effect of lobbying
0.5090) forGDP pc ≤U S$5,000 and GDP pc≤ U S$10,000, respectively. However,
note that this estimates are potentially biased and therefore, as discussed above,
the preferred specification is the System GMM estimator of collapsed instruments
of Roodman (2009), columns (3) and (6). This estimator produces larger short run
effects of 0.0408 and 0.0439 and long run effects of 0.0689 (=0.0408/(1-0.408)) and
0.754 (=0.0439/(1-0.417)) for GDP pc ≤ U S$5,000 and GDP pc ≤ U S$10,000,
re-spectively. Thus increasing lobbying expenditures by 1% increases aid receipts in
the long run by 0.07%. ln(GDPi,t−1) has a negative effect on ln(Aid) which
de-termines that poorer countries receive more aid. Moreover, ln(P OPi,t−1) has the
expected positive sign. The Arellano-Bond AR(2) and the Hansen tests show that
the instrumentation strategy is valid.
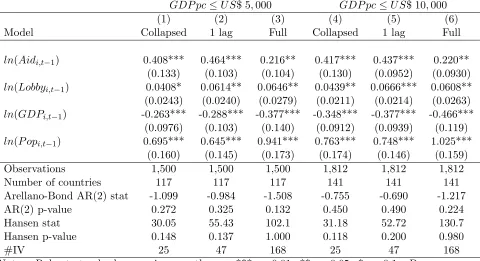
In order to check the robustness of the GMM estimator we compare it with other
System GMM estimators. Table 3 computes the estimates in Table 2 together with
other alternative instrumentation strategies discussed above. The Roodman (2009)
estimator appears in column Collapsed; the System GMM specification where only
lag, and the Blundell and Bond (1998) estimator with all possible instruments
ap-pears in columns Full. The Collapsed method has the lowest number of instruments
generated by the GMM method, while the full Blundell and Bond (1998) System
GMM estimator has the highest. In all cases the short run effect of lobbying and the
coefficient of the lagged dependent variable are positive and statistically significant.
The Collapsed method has the lowest number of instruments generated by the GMM
strategy, the Full the highest number, and the 1 lag is in between. The Hansen tests
cannot reject the validity of the generated instruments. Overall this suggests that
there is an unequivocal positive effect of lobbying on aid, and the GMM strategy in
Roodman (2009)-Collapsed is valid. This is our preferred estimator.
A potential problem of our estimates is endogeneity in lobbying. Although
lobby-ing is lagged one period and it is treated as endogenous in the Blundell-Bond
estima-tor (and thus lagged values of itself are used as instrumental variables), there may still
be a potential strategic effect of lobbying that relates to future aid. Unfortunately,
there are no suitable instrumental variables that work for our case. Other studies
endogeneity exploit inter-industry variation in lobbying activities (Gawande,
Kr-ishna and Robbins, 2006; Kee, Olarreaga and Silva, 2007; Gawande, Maloney and
Montes-Rojas, 2009) or factor shares and political economy variables (Gawande and
Bandhopadhyay, 2000). The former, when aggregated at the country level, is not
statistically significant in the first stage, reflecting weak instruments. The latter
cannot be justified for our particular case of foreign aid. Thus, in order to check
for the validity of our estimates, we use a Granger-causality-type analysis, where we
consider the reverse specification, that is we evaluate whether aid has a significant
effect on lobbying. This method, however, tests for a weaker type of causality than
IV methods.
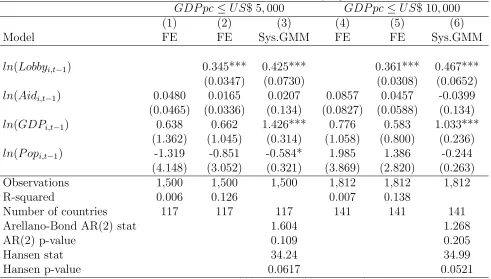
Table 4 studies the reverse effect of Total US Assistance on FARA lobbying, that
is, ln(Lobbyi,t) =αln(Lobbyi,t−1) +βln(Aidi,t−1) +γXi,t +µi+δt+i,t. The idea is
that if lobbying activities are caused by aid, past aid should be a predictor of future
lobbying activities. Foreign aid has been shown to increase goverment spending and
to reduce revenue generation (see Remmer, 2004), and thus aid could affect lobbying
statistically significant. Therefore, we can rule out a double causation mechanism
where aid incentivises recipient countries to lobby more or aid money is used for
lobbying activities. The results also confirm that conditional on population size
richer countries lobby more.
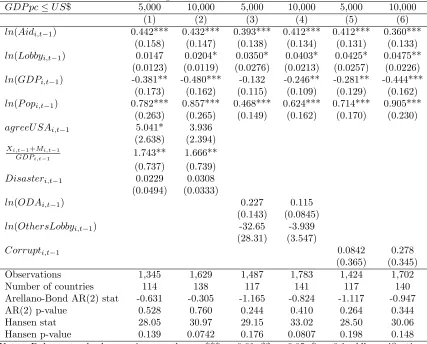
(c) Robustness checks
Several robustness checks are carried out. We consider different specifications
where additional covariates that has been found to be significant causes of aid in
the literature are included in the model. These additional covariates thus control
for potential biases arising because of omitted variables, that is variables that affect
both aid and lobbying, and that may be producing the effects in Table 2. The table
reports only the preferred GMM specification. The results appear in Table 5.
In our model of informational lobbying, both aid and lobbying reflect common
interests between the US and the recipient country. We thus include additional
Then we include the average annual agreement of the recipient country and the US
(agreeU SAi,t), and include this variable in the regression analysis. Second, bilateral
trade between the US and the recipient country is also a good measure of common
links as this reflects commercial interest between residents in both countries. On
this, Kee, Olarreaga and Silva (2007) show that lobbying is significantly related to
trade. For this we include Xi,t−1+Mi,t−1
GDPi,t−1 , where X and M correspond to exports and
imports, respectively, of the recipient country to and from the US. Furthermore,
as suggested by an anonymous referee, lobbying activities could also be related to
attracting foreign aid based on the countries’ needs after natural or other significant
disasters. Thus, controlling for disasters would determine whether lobbying has an
effect on aid not related to the countries’ needs in times of emergency. Columns (1)
and (2) consider the inclusion of the three variables discussed in the last paragraph.
In this case the coefficient of aid is 0.015 for GDP pc≤ U S$5,000 (not statistically
significant) and 0.020 forGDP pc ≤U S$10,000 (statistically significant at the 10%
level). This is half the coefficient value estimated in Table 2. Then, lobbying is
compared to the baseline regression coefficients), but controlling for needs-based aid
does not eliminate the effect of foreign aid. agreeU SAis positive in both cases and
statistically significant in the first sub-sample only. Trade is significant in both cases,
reflecting the fact that bilateral aid flows towards countries with large commercial
ties with the US. The constructed variable reflecting disasters is positive in both
cases, although not statistically significant.
As discussed above, lobbying-for-aid is a potential non-cooperative game. In
Table 5, columns (3)-(4), we also consider an alternative specification where we add
the lagged logarithm of net official development assistance (ODA), ln(ODAi,t−1), in
order to control for assistance from other sources other than bilateral US assistance.
Moreover we include the amount of lobbying simulataneously made by other countries
(ln(OthersLobby), constructed in the same way as the variable ln(Lobby)). Both
variables are included to control for general equilibrium effects. The first controls
for potential substitution and complementarity with aid from other sources (i.e.
multilateral institutions, Europe, Japan, etc.). The second accounts for the fact
potential zero effect if the total aid available does not change and only the allocation
among recipient countries is modified. Thus, including the latter variable would
provide the effect of lobbying on aid conditional on the amount of lobbying made
by other countries. The inclusion of these variables does not significantly affect the
coefficient estimate of lobbying, which slightly reduces to 0.035 and 0.040, for each
sub-sample respectively. In these regressions both ln(ODA) and ln(OthersLobby)
are not statistically significant.
Finally, we use Corruption Control index as a proxy for “good governance” of
the potential recipient country. As argued in the Introduction, the US established in
2004 new rules to allocate aid on the basis of governance indicators of the recipient
country. Thus, if the allocation of aid follows pre-established rules, and in particular,
if it only depends on the governance indicators of the recipient country, then it cannot
be influenced by foreign lobbying. We use this index as a proxy for the information
available to the US Congress related to the country governance. (Similar results are
obtained by other governance indicators.) The results appear in Table 5, columns
significant effect on bilateral US aid. Note that the effect of the index is positive (it
is coded from -2.5 to 2.5 with higher values corresponding with better governance
outcomes) but it is not statistically significant in both GMM specifications. These
results are in line with Alesina and Weder (2002) as there is no evidence that less (or
more) corrupt governments receive more foreign aid. Those authors stress that “the
United States appears to favor democracies, but seems to pay no attention to quality
of government of receiving countries” (p.1136). (See Wright, 2009, for a theoretical
discussion.)
5
DISCUSSION AND SUGGESTIONS FOR
FUTURE RESEARCH
There are many gaps in the economics and political science literature regarding
the pattern of foreign aid followed by donors. This paper contributes to this literature
by showing that foreign lobbying in the US has a statistically significant effect for
attracting US foreign bilateral aid, and thus the allocation of aid may not follow
allocation of resources. This channel is different from Lahiri and Raimondos-Møller
(2000) study, where ethnic groups within the donor country influence the allocation
of foreign aid. This paper extends the effect extends the effect of foreign lobbying
beyond policy of trade (Gawande, Krishna, and Robbins, 2006; Kee, Olarreaga and
Silva, 2007; Gawande, Maloney and Montes-Rojas, 2009), and thus shows that foreign
lobbying can be an effective tool to influence other international policy variables.
Given that aid could be a significant source of funds with respect to the
recip-ient’s country GDP, this determines that the lobbying channel cannot be ignored.
Increasing lobbying by 1% may increase US assistance up to 0.075% in the long run.
The effect of lobbying remains after controlling for a rich set of controls,
includ-ing common interests, recipient country needs for aid, aid from other donors and
governance indicators.
Of theoretical relevance is the question of whether the more countries that
partici-pate in lobbying, competition among them may be used strategically by policymakers
being lobbied to capture rents without benefiting any lobby. While that outcome is
demonstrated within the informational lobbying framework used here. Partial results
in this paper shows that the effect of lobbying remains the same after controlling by
other’s countries lobbying amount. Moreover, it shows that the effect of lobbying is
robust to the amount of foreign aid made by other donors. Finally, it shows that
foreign aid does not cause recipient countries to lobby more.
Further research is needed to evaluate the effect of lobbying on a program by
program basis. As argued in this paper, US Foreign Assistance classification of aid
programs into economic and military assistance is difficult to justify and it seems
arbitrary. For instance, focusing on military programs could contribute to
under-standing of the effect of US assistance on military conflicts and related effects on
their neighbors. Moreover, additional research is needed to evaluate if economic and
military assistance are substitutes or complements.
This study is further motivated to shed light on the large literature on the effect
of foreign aid on economic growth. Burnside and Dollar (2000, 2004) study shows
that foreign aid positively affects growth in developing countries with good fiscal,
numerous (see Easterly, 2003, Easterly, Levine and Roodman, 2004, Roodman, 2007,
Rajan and Subramanian, 2011). In fact, aid has also been argued to be detrimental
to growth (see for instance the examples in Easterly, 2006). However, the endogeneity
of aid is usually the main concern in all the empirical settings. Lobbying is related to
foreign aid, but it is arguably independent of the recipient country economic growth
as long as lobbying expenditures do not posse too much strain on the country’s
finances. Thus, lobbying can be used as an instrumental variable to study the effect
of foreign aid on growth. Unfortunately, our data span is not long enough to produce
meaningful instrumental variables estimates, but it can be used in the future for this
REFERENCES
- Alesina, A., & Dollar, D. (2000). Who gives foreign aid to whom and why? Journal
of Economic Growth,5(1), 33-63.
- Alesina, A., & Weder, B. (2002). Do corrupt governments receive less foreign aid?
American Economic Review, 92(4), 1126-1137.
- Anderson, T.W., & Hsiao, C. (1981). Estimation of dynamic models with error
components. Journal of the American Statistical Association,1981, 589-606.
- Arellano, M. (2002). Panel data econometrics. Oxford: Oxford University Press.
- Arellano, M., & Bond S. (1991). Some tests of specification for panel data: Monte
Carlo evidence and an application to employment equations. Review of Economics
Studies, 58(2), 277-297.
- Austen-Smith, D., & Wright, J.R. (1992). Competitive lobbying for a legislator’s
vote. Social Choice and Welfare, 9(3), 229-257.
- Austen-Smith, D., & Wright, J.R. (1994). Counteractive lobbying. American
Journal of Political Science, 38(1), 25-44.
threedimensional panel analysis. International Review of Economics & Finance,
13(3), 253-274.
- Blundell, R., & and Bond, S. (1998). Initial conditions and moment restrictions in
dynamic panel data models. Journal of Econometrics,87(1), 115-143.
- Bowsher, C.G. (2002). On testing overidentifying restrictions in dynamic panel
data models. Economics Letters, 77(2), 211-220.
- Burnside, C., & Dollar, D. (2000). Aid, policies, and growth. American Economic
Review, 90(4), 847-868.
- Burnside, C., & Dollar, D. (2004). Aid, policies, and growth: Reply. American
Economic Review, 94(3), 781-784.
- Chong, A., Gradstein, M., & Calderon, C. (2001). Can foreign aid reduce income
inequality and poverty? Public Choise,140(1/2), 59-84.
- Claessens, S., Cassimon, D., & Van Campenhout, D. (2009). Evidence on changes
in aid allocation criteria. World Bank Economic Review 23(2), 185-208.
- Dollar, D., & Levin, V. (2006). The increasing selectivity of foreign aid, 1984-2003.
- Dreher, A., Nunnenkamp, P., & Thiele, R. (2008). Does US aid buy UN general
assembly votes? A disaggregated analysis. Public Choice, 136(1), 139-164.
- Easterly, W. (2003). Can foreign aid buy growth? Journal of Economic Perspectives
17(3), 23-48.
- Easterly, W. (2006). The white man’s burden: Why the West’s efforts to aid the
rest have done so much ill and so little good. Oxford: Oxford University Press.
- Easterly, W., Levine, R., & Roodman, D. (2004). Comment: Aid, policies, and
growth. American Economic Review,94(3), 774-780.
- Facchini, G., Mayda, A., & Mishra, P. (2011). Do interest groups affect US
immi-gration policy? Journal of International Economics,85(1), 114-128.
- Gawande, K., & Bandhopadhyay, U. (2000). Is protection for sale? A test of
the Grossman-Helpman theory of endogenous protection. Review of Economics and
Statistics, 82(1), 139-152.
- Gawande, K., Krishna, P., & Robbins, M. (2006). Foreign lobbying and U.S. trade
policy. Review of Economics and Statistics, 88(3), 563-571.
en-hance development? The case of tourism in the Caribbean. Journal of Development
Economics,90(2), 267-75.
- Goldsmith, A.A. (2001). Foreign aid and statehood in Africa. International
Orga-nization, 55(1), 123-148.
- Grossman G., & Helpman E. (2002). Special Interest Politics. Cambridge, MA:
MIT Press.
- Hansen, H., & Tarp, F. (2001). Aid and growth regressions. Journal of Development
Economics,64(2), 547-570.
- Husted S. (1991). Foreign lobbying: A theoretical analysis. Eastern Economic
Journal, 17(1), 89-99.
- Kee, H.L., Olarreaga, M., & Silva, P. (2007). Market access for sale: Latin
Amer-ica’s lobbying for US tariff preferences. Journal of Development Economics 82(1),
79-94.
- Lahiri, S., & Raimondos-Møller, P. (2000). Lobbying by ethnic groups and aid
allocation. Economic Journal, 110(462), 62-79.
on Development Assistance. London: Routledge.
- Rajan, R.G., & Subramanian, A. (2011). Aid, Dutch disease, and manufacturing
growth. Journal of Development Economics, 94(1), 106-118.
- Remmer, K.L. (2004). Does foreign aid promote the expansion of government?
American Journal of Political Science, 48(1), 77-92.
- Roodman, D. (2007). The anarchy of numbers: Aid, development, and
cross-country empirics. World Bank Economic Review, 21(2), 255-277.
- Roodman, D. (2009). A note on the theme of too many instruments. Oxford
Bulletin of Economics and Statistics, 71(1), 135-158.
- Trumbull, W., & Wall, H. (1994). Estimating aid-allocation criteria with panel
data. Economic Journal, 104(425), 876-882.
- Wang, T.Y. (1999). U.S. foreign aid and U.N. voting: An analysis of important
issues. International Studies Quarterly,43(3), 199-210.
- Wright, J. (2009). How foreign aid can foster democratization in authoritarian
Table 1: Summary statistics
Variable Obs Mean Std. Dev. Min Max
ln(Aid)(a) 1812 16.58 3.68 0 23.45
ln(Lobby)(a) 1812 7.14 6.52 0 19.48
ln(GDP) 1812 22.62 2.08 17.85 28.71
ln(P OP) 1812 15.59 2.05 9.80 21.01
agreeU SA 1635 0.154 0.110 0 0.889 (X+M)/GDP 1803 0.125 .169 0 1.493
ln(OthersLobby)(a) 1812 20.02 0.1881 19.64 20.40
Disaster(a) 1812 2.98 5.03 0 18.74
ln(ODA) 1795 18.42 3.85 0 23.94
Corrup 1745 -0.438 0.613 -1.965 1.507
Notes: The statistics correspond to the sample of GDP pc ≤ 10,000. (a) A value of 0 is imputed forAid = 0 andLobby = 0. The same procedure is applied for the construction ofDisaster.
Table 2: Effect of Lobbying on Total US Assistance
GDP pc≤U S$ 5,000 GDP pc≤U S$ 10,000
(1) (2) (3) (4) (5) (6)
Model FE FE Sys.GMM FE FE Sys.GMM
ln(Aidi,t−1) 0.463*** 0.408*** 0.509*** 0.417***
(0.0643) (0.133) (0.0662) (0.130)
ln(Lobbyi,t−1) 0.0307* 0.0194 0.0408* 0.0375* 0.0217* 0.0439**
(0.0164) (0.0121) (0.0243) (0.0211) (0.0126) (0.0211)
ln(GDPi,t−1) -1.228 -0.395 -0.263*** -0.888 -0.153 -0.348***
(0.834) (0.497) (0.0976) (0.619) (0.408) (0.0912)
ln(P opi,t−1) -0.233 0.130 0.695*** 2.453 1.477 0.763***
(2.766) (1.757) (0.160) (2.354) (1.457) (0.174) Observations 1,500 1,500 1,500 1,812 1,812 1,812
R-squared 0.092 0.294 0.074 0.320
Number of countries 117 117 117 141 141 141
Arellano-Bond AR(2) stat -1.099 -0.755
AR(2) p-value 0.272 0.450
Hansen stat 30.05 31.18
Hansen p-value 0.148 0.118
Notes: Robust standard errors in parentheses. *** p<0.01, ** p<0.05, * p<0.1. De-pendent variable ln(Aidi,t). All specifications include year dummies. Sys.GMM is the
[image:39.612.96.558.347.610.2]Table 3: Effect of Lobbying on Total US Assistance: different GMM estimators
GDP pc≤U S$ 5,000 GDP pc≤U S$ 10,000
(1) (2) (3) (4) (5) (6)
Model Collapsed 1 lag Full Collapsed 1 lag Full
ln(Aidi,t−1) 0.408*** 0.464*** 0.216** 0.417*** 0.437*** 0.220**
(0.133) (0.103) (0.104) (0.130) (0.0952) (0.0930)
ln(Lobbyi,t−1) 0.0408* 0.0614** 0.0646** 0.0439** 0.0666*** 0.0608**
(0.0243) (0.0240) (0.0279) (0.0211) (0.0214) (0.0263)
ln(GDPi,t−1) -0.263*** -0.288*** -0.377*** -0.348*** -0.377*** -0.466***
(0.0976) (0.103) (0.140) (0.0912) (0.0939) (0.119)
ln(P opi,t−1) 0.695*** 0.645*** 0.941*** 0.763*** 0.748*** 1.025***
(0.160) (0.145) (0.173) (0.174) (0.146) (0.159) Observations 1,500 1,500 1,500 1,812 1,812 1,812
Number of countries 117 117 117 141 141 141
Arellano-Bond AR(2) stat -1.099 -0.984 -1.508 -0.755 -0.690 -1.217 AR(2) p-value 0.272 0.325 0.132 0.450 0.490 0.224 Hansen stat 30.05 55.43 102.1 31.18 52.72 130.7 Hansen p-value 0.148 0.137 1.000 0.118 0.200 0.980
#IV 25 47 168 25 47 168
Notes: Robust standard errors in parentheses. *** p<0.01, ** p<0.05, * p<0.1. De-pendent variable ln(Aidi,t). All specifications include year dummies. Collapsed is the
[image:40.612.94.574.220.481.2]Table 4: Effect of Total US Assistance on Lobbying
GDP pc≤U S$ 5,000 GDP pc≤U S$ 10,000
(1) (2) (3) (4) (5) (6)
Model FE FE Sys.GMM FE FE Sys.GMM
ln(Lobbyi,t−1) 0.345*** 0.425*** 0.361*** 0.467***
(0.0347) (0.0730) (0.0308) (0.0652)
ln(Aidi,t−1) 0.0480 0.0165 0.0207 0.0857 0.0457 -0.0399
(0.0465) (0.0336) (0.134) (0.0827) (0.0588) (0.134)
ln(GDPi,t−1) 0.638 0.662 1.426*** 0.776 0.583 1.033***
(1.362) (1.045) (0.314) (1.058) (0.800) (0.236)
ln(P opi,t−1) -1.319 -0.851 -0.584* 1.985 1.386 -0.244
(4.148) (3.052) (0.321) (3.869) (2.820) (0.263)
Observations 1,500 1,500 1,500 1,812 1,812 1,812
R-squared 0.006 0.126 0.007 0.138
Number of countries 117 117 117 141 141 141
Arellano-Bond AR(2) stat 1.604 1.268
AR(2) p-value 0.109 0.205
Hansen stat 34.24 34.99
Hansen p-value 0.0617 0.0521
[image:41.612.95.586.223.502.2]Table 5: Effect of Lobbying on Total US Assistance. Robustness checks
GDP pc≤U S$ 5,000 10,000 5,000 10,000 5,000 10,000
(1) (2) (3) (4) (5) (6)
ln(Aidi,t−1) 0.442*** 0.432*** 0.393*** 0.412*** 0.412*** 0.360*** (0.158) (0.147) (0.138) (0.134) (0.131) (0.133)
ln(Lobbyi,t−1) 0.0147 0.0204* 0.0350* 0.0403* 0.0425* 0.0475**
(0.0123) (0.0119) (0.0276) (0.0213) (0.0257) (0.0226) ln(GDPi,t−1) -0.381** -0.480*** -0.132 -0.246** -0.281** -0.444***
(0.173) (0.162) (0.115) (0.109) (0.129) (0.162) ln(P opi,t−1) 0.782*** 0.857*** 0.468*** 0.624*** 0.714*** 0.905***
(0.263) (0.265) (0.149) (0.162) (0.170) (0.230)
agreeU SAi,t−1 5.041* 3.936
(2.638) (2.394) Xi,t−1+Mi,t−1
GDPi,t−1 1.743** 1.666**
(0.737) (0.739)
Disasteri,t−1 0.0229 0.0308
(0.0494) (0.0333)
ln(ODAi,t−1) 0.227 0.115
(0.143) (0.0845)
ln(OthersLobbyi,t−1) -32.65 -3.939
(28.31) (3.547)
Corrupti,t−1 0.0842 0.278
(0.365) (0.345)
Observations 1,345 1,629 1,487 1,783 1,424 1,702
Number of countries 114 138 117 141 117 140
Arellano-Bond AR(2) stat -0.631 -0.305 -1.165 -0.824 -1.117 -0.947
AR(2) p-value 0.528 0.760 0.244 0.410 0.264 0.344
Hansen stat 28.05 30.97 29.15 33.02 28.50 30.06
Hansen p-value 0.139 0.0742 0.176 0.0807 0.198 0.148
[image:42.612.93.520.199.543.2]