RIT Scholar Works
Theses Thesis/Dissertation Collections
10-1-2012
Think aloud: Can eye tracking add value in
detecting usability problems?
Alekhya Paruchuri
Follow this and additional works at:http://scholarworks.rit.edu/theses
Recommended Citation
Think Aloud: Can Eye Tracking Add Value in Detecting Usability
Problems?
By
Alekhya Paruchuri
Thesis submitted in partial fulfillment of the requirements for the
degree of Master of Science in Human Computer Interaction.
Department of Information Sciences and Technologies
Rochester Institute of Technology
B. Thomas Golisano College
of
Computing and Information Sciences
Thesis Committee:
Dr. Evelyn Rozanski
Jill Hewitt
Dr. Michael Yacci
Table of Contents:
...
Abstract 5
...
1. Introduction 6
...
2. Literature Review 8
...
3. Statement of Problem 14
...
4. Methodology 15
...
4.1 Equipment, Location and Setup 15
...
4.2 Participants 15
...
4.3 Procedure 17
...
4.4 Experimental Design 18
...
4.6 Data Collected and Analysis 21
...
5. Results 22
...
5.1 Demographics 22
...
5.2 Field of Interest 23
...
5.3 Internet Usage and Study Experience 24
... 5.4 Experience with Government Related and Travel Websites 24
...
5.5 Tasks 26
...
5.5.1 Time on Task 26
...
5.5.2 Success / Failure of Tasks 27
...
5.5.3 Participants’ Website Experience 28
...
5.5.4 Ease of Finding Information 29
...
5.5.5 Usability Problems 29
...
...
6. Discussion 36
...
6.1. Limitations and Recommendations 37
...
6.1.1 Participant Recruitment 37
...
6.1.2 Usability Testing Equipment 37
...
6.1.3 Data Lost 38
...
6.1.4 Study Questionnaires 38
...
6.1.5 Tasks 38
...
7. Conclusion 40
...
8. Future Research 41
...
9. References 42
...
Appendix A - Participant Screener 45
...
Appendix B - Participant Recruitment Email 48
...
Appendix C - Websites 49
...
Appendix D - Formal Script 51
...
Appendix E - Consent Form 54
...
Appendix F - Pre-Study Questionnaire 56
...
Appendix G - Website Tasks Scenarios 58
...
Appendix H - Post-Task Questionnaire 60
...
Appendix I - Post-Study Questionnaire 62
...
Appendix J - Heuristic Evaluation 64
...
Appendix K - Evaluation Conditions/Rationale 71
...
Appendix L - Usability Problems By Each Condition 81
...
Figures:
Figure 1 - Values representing the participants response information...22
Figure 2 - Values representing the age of the participants...23
Figure 3 - Values representing the educational background of the participants...23
Figure 4 - Values representing no. of government agency websites previously visited...25
Figure 5 - Values representing no. of travel related websites previously visited...25
Figure 6 - Values representing the participants’ experience of the websites...28
Figure 7 - Values representing the participants’ ease of finding information...29
Figure 8 - Values representing the total number of usability problems per condition...30
Figure 9 - Values representing the number of unique usability problems per condition..32
Tables: Table 1 - User Profile...16
Table 2 - Participant Breakdown Per Condition...19
Table 3 - Task Counterbalance...20
Table 4 - Session Timing...20
Table 5 - Time Taken to Complete Each Task...26
Table 6 - Time Taken to Complete Each Task Per Condition...26
Table 7 - Success and Failure of Tasks...27
Table 8 - Total number of usability problems per website...30
Table 9 - Between Groups Effect...31
Table 10 - Tukey HSD Post-Hoc Test Table...31
Table 11 - User Impressions...33
Abstract
The protocols of Think Aloud and Eye Tracking, in their own unique way have proven to be
great methods to understand users’ thought processes, and their mental models when interacting
with interfaces. However the effectiveness of the combination of the two protocols in
discovering usability problems has not been explored. This study aimed to discover if the
addition of Eye Tracking data (fixations and scan movements) to the traditional protocol of
Think Aloud can uncover more usability problems. Web users were split into three groups: Eye
Tracking Only (ET), Think Aloud Only (TA), and Eye Tracking and Think Aloud Only (ET+TA).
Participants in all conditions were asked to complete two tasks on two websites each. Along with
questionnaires, eye movement data was collected for conditions with the Eye Tracking aspect
and verbalizations were collected for conditions with the Think Aloud aspect. The analysis of the
data showed that the total number of usability problems (not unique) identified by the
participants in the ‘Eye Tracking and Think Aloud’ (ET + TA) condition was higher than the
other two conditions. However, a Tukey HSD post-hoc test revealed that the differences between
‘ET + TA’ and the ‘Eye Tracking Only’ (ET) conditions was non-significant. The analysis also
which resulted in non-significant differences between the conditions ‘Eye Tracking’ (ET) and
‘Eye Tracking and Think Aloud’ (ET + TA) led to inconclusive results on whether the Think
Aloud method is disruptive or not. This may lead future researchers to develop robust practice
1. Introduction
Over the past few years it has become apparent that interaction with various interfaces in
daily living is inevitable. Cellphones, alarm clocks, coffee makers, etc commence the path to
endless interactions through the rest of the day. In order to craft these products to every
consumer category and make them useable and user-friendly, companies have adopted the use of
Usability Testing. Usability Testing is a technique where people are observed using the product
to uncover any problems, frustrations and discover areas of improvement. For products to be
categorized as useable, they should be efficient, effective (less-errors), learnable, satisfy the
users’ feelings and perceptions, and memorable (Nielsen, 2003). Usability Testing measures how
participants respond to these particulars.
• Efficient -- Can a set of basic tasks be completed in the fewest number of steps? Can the
steps be done proficiently? (Nielsen, 2003)
• Effective -- Does the product function in the way it is expected to? Does the functionality
of the product match the mental model of the user? Is accurate and appropriate
information/feedback given to the user? (Nielsen, 2003)
• Learnable -- How easy is it for the users to grasp the working of the product and its
features? How easily can users ramp themselves up on the functionalities of the product?
(Nielsen, 2003)
• Statisfaction -- How the person feels about the overall product? How they feel when
using or interacting with the product? Is the person confident, stressed? Would the user
recommend this system to a friend? (Nielsen, 2003)
It is important for the user to be immersed in the system during testing as it will result in
more authentic data. Once a realistic scenario or situation is presented to the user, various
techniques (depending on the test) are used to gather information. One of the most popular
evaluation methods used is the Think Aloud Protocol (TAP) (Ericsson & Simon, 1980). Here the
participants involved are requested to verbalize every action, thought, and feeling while they are
performing the tasks. This facilitates the testers to understand the mental model of the user and
see a product and its features through the user’s perspective.
Another evaluation technique to gather information during Usability Testing is Eye
Tracking (Yarbus, 1967). Eye movements provide an insight into a user’s thought process and
their mental model. A device known as an eye tracker is used to measure eye position, scan paths
(how users are scanning the interface), and fixation duration (how long users are focusing on a
single part of the interface). This information is further analyzed to better grasp the visual
2. Literature Review
The Think Aloud protocol is one of the most popular techniques followed during
Usability Testing (Nielsen et. al., 2002). When participants follow this protocol, their
concentration is solely on the task they are performing while merely verbalizing their thoughts.
The thoughts expressed during a Think Aloud session are similar to the thoughts expressed when
a person is thinking normally (Rhenius & Deffner, 1990). As the focus is undisrupted and
sustained, the participants completely immerse themselves in the tasks and thereby reveal their
genuine views and impressions. It can also be noted that as their attention is channeled towards
the tasks, their verbalization is often in phrases, words and incomplete sentences (Ericsson, &
Simon, 1998). The validity of these verbalizations is speculated to be accurate as everything
reported by participants at this point is from their short-term memory (Eger et al., 2007). This
information provides the conceptual principles for the cognitive models thereby helping usability
experts take another step into the cognitive world of the user.
While Think Aloud is very popular in the world of usability testing, it poses a variety of
problems. In everyday life, a person does not verbalize their every thought and action loudly to
the people around them. Thus the process of Thinking Aloud on what is going on is peculiar and
not typical (Krahmer & Ummelen, 2004). This suggests one or both of two things: the
participants would have to be coached before testing in order for them to understand how and
what thoughts to verbalize or necessarily make sure the participants are not disturbed during the
process, as that would break their train of thought and make them conscious of the fact that
Another common complication faced when collecting data through the Think Aloud
protocol is that people tend to think quicker than they are able to verbalize those thoughts. It
leads to omission of important information. While this happens without conscious effort for
certain participants, there are instances where in order to project an effective and proficient
image, participants choose to omit and keep some information undisclosed (Eger et al., 2007).
Recent research is still debating the performance of participants on completion of complex tasks
when Thinking Aloud. But it is presumed that Think Aloud adds a great deal of stress and
demands that participants concentrate and focus harder (Cooke & Cuddihy, 2005). As mentioned
earlier, since Think Aloud is unnatural, participants often forget that they are required and
expected to verbalize. This leads to pockets of silence and utterances as “hmm..”, “ahh..”, etc.
Researchers Hertzum, Hansen and Andersen (2009) argue that Think Aloud has little
effect on participants’ behavior and mental workload only on short tasks with precise instructions
and minimal interactions. But as tasks prolong, the effect increases and users will tend to change
their mental processes to gather resources to verbalize. Regardless of the pitfalls that the Think
Aloud protocol poses, studies show that 89% to 98% of the verbalizations by the users are indeed
accurate (Rhenius & Deffner, 1990). It can be agreed upon that users do not omit data purposely,
but at the same time, verbalizations do not provide a whole picture or version of what is going on
(Cooke, 2010). The Think Aloud is often thought of as a “quick and dirty” method to get into a
user’s head and regardless of how structurally sound or organized the protocol is, there will
continue to be gaps (Ramey et. al., 2006).
Since 1967 Eye Tracking has made its way as a method for acquiring insight into a
Usability Testing, Eye Tracking has tried to connect these cognitive processes to understand how
users interact with various interfaces (Cooke, 2006). The aspect that most researchers appreciate
about Eye Tracking, is the availability of instantaneous real-time data. Unlike the traditional
methods that are used to collect data, eye movements are natural and at all times “on” logging
and recording. Eye tracking keeps up with the speed at which the mind thinks, thereby outputting
more current information. Thus it has a high chance and capacity to provide refined data.
As opposed to standard self-reporting protocols and methods, Eye Tracking data is
considered to be more authentic. Researchers also argue that while the standard protocols
provide information on a user’s behavior and shed light on the problem at a descriptive level,
Eye Tracking data reveals the origin of the problem (Schiessl et. al., 2003). Eye movement data
collected on pre-known and existing usability problems can lead to a more extensive
understanding of those problems (Rozanski et. al., 2005). While there are several metrics (see
Jacob, & Karn, 2003 for more detailed report on metrics), the most frequently used are number
of fixations (concentrated view point on the visual display), fixation duration (amount of time
spent on each fixation), scan paths (sequence of fixations) and areas of interests (areas on the
visual display that of are interest to the tester) (Jacob, & Karn, 2003). Fixation duration and task
difficultly are directly related, that is as the fixation duration increases, task difficulty is also
expected to increase thereby requiring the user to intensify their processing resources (Van Gog
et. al., 2005). Fixation durations can help capture usability problems in instances where users
themselves cannot recognize the problems (Pretorius et. al., 2010).
that are either uncomfortably head mounted, or restrict the range within which data can be
collected. Additional comprehension of the data is required in order to correlate to the
appropriate cognitive activities. The question of which metric will solve which problem can be
stressful and overwhelming. The volatile nature of modern interfaces (example: animations, pop
ups, etc) and the movement of these interfaces onto non-traditional devices (example: cell
phones, touch screen tablets, etc) limit the use of eye trackers. Blinking of eyes, glare in the
surroundings, and normal eye jittering add to the list of limitations that eye trackers pose (Jacob
& Karn, 2003).
Eye trackers are limited to track only the foveal vision through which majority of the
information is acquired. Thus any information a person gains through the peripheral vision is lost
(Manhartsberger & Zellhofer, 2005). A great deal of raw data is yielded by the foveal vision and
sorting through this data is proven to be tedious and time consuming. And as there is no yardstick
measure of what is considered a good eye pattern, it is hard to set standards for a given interface
(Cowen, Ball, & Delin, 2001). Despite all the weakness, Eye Tracking is proven to be a valuable
tool to explore the usability issues.
As observed, both Think Aloud and Eye Tracking methods assist in gaining more
information on what the users’ are thinking and doing. While both methods present flaws and
gaps, the question of whether a combination of thetwo protocols can be usedin usability studies
was researched further. Researchers Rhenius and Deffner (1990) used eye movement data with
Think Aloud protocol to conclude that 87% to 98% of the verbalizations during Think Aloud are
accurate, and that concurrent Think Aloud does not differ from normal thinking. While it is
verbalize information, it was observed that even proficient users tend to do the same. Subtle cues
that can contribute to understanding users’ expectations might be overlooked with Think Aloud
and observation. Thus a combination of Think Aloud protocol and eye movement data was used
by researchers Cooke and Cuddihy(2005)to address the limitations of the Think Aloud protocol.
In order to get thorough information regarding a user’s experience, the Think Aloud
method alone cannot provide the information (Manhartsberger & Zellhofer, 2005) and
self-assessed reports are often considered to be biased or wrong (Schiessl et. al., 2003). Thus
researchers believe that adding Eye Tracking data can not only help gain valuable information
but also eliminate any biased responses. A combination of these protocols were used in Gerjets
et. al (2010), to understand the differences in the scan paths and fixation durations for users who
were informed with neutral Think Aloud protocol and instructed evaluation methods. In a study
to understand if users experience different levels of mental workload when Thinking Aloud
versus performing in silence, Eye Tracking data such as fixations and saccades were recorded. It
was observed that the fixations, fixation durations and saccades in both cases were similar,
leading to the conclusion that normal Think Aloud did not have any effect on the workload of a
user. But this was noted to be applicable only for short tasks (Hertzum et. al., 2009).
Researcher Cooke (2010) added eye movement data to Think Aloud verbalizations to
verify and confirm the findings of researchers Rhenius and Deffner that the verbalizations during
Think Aloud are in fact accurate. This integration of data also led to infer that when users are
searching, exploring, and mentally processing what is on the screen, they use verbal fillers
not only found to be 80% accurate, but it was also suggested that the complexity of the task has
no repercussion on the validity of the data collected. Verbal areas of interest sequences were
found to be different from eye areas of interest sequences thereby demonstrating that users omit
information during RTA (Guan et al., 2006). Cooke also used this integration of data (eye
movement data with Retrospective Think Aloud) to evaluate whether users can confirm fixation
duration as a measure of ease or difficulty and fixation frequency as a measure of search
efficiency or inefficiency (Cooke, 2006).
In the domain of instructional design, data obtained from eye movements in coalition
with Concurrent Think Aloud data, led to view the difference between students at different levels
of expertise in regards to performance in troubleshooting (Van Gog et. al., 2005) . The results of
that study implied that in order to gain insight into unacknowledged cognitive processes. And
3. Statement of Problem
From the examination of previous studies, it is suggested that a combination of Think
Aloud protocols with eye movement can yield to refined insight into the processes of a user.
Research Questions:
Question 1: Can the addition of Eye Tracking and eye movement data to the traditional Think Aloud method uncover more usability problems?
When participants Think Aloud during usability testing, there are instances when they become
quiet as they are thinking or trying to figure out something. This leaves gaps in the information
that the participant is trying to convey. In situations as such, data obtained from Eye Tracking the
participants would provide an insight into where and how long the participants are fixating on
uncovering additional usability problems that are not verbalized.
Question 2:Is the Think Aloud method disruptive in such a way that it would yield fewer usability problems when compared to Eye Tracking conditions?
As a person does not verbalize their every thought and action loudly to the people around them,
the process of Thinking Aloud is peculiar and not typical (Krahmer & Ummelen, 2004). In order
to project an effective and proficient image, participants choose to omit and keep some
information undisclosed (Eger et al., 2007). Thus Thinking Aloud would require participants to
4. Methodology
In order to answer the research questions, an experimental study with three conditions
was conducted. The first condition was ‘Think Aloud’ only, where the verbalizations of the
participants thoughts were recorded while performing the tasks given. The second condition was
‘Eye Tracking’ only, where the eye movements of the participants were recorded. The third
condition was ‘Think Aloud and Eye Tracking’, where verbalizations and eye movement data of
the participants was collected. A between-subjects comparison on the total number of usability
problems was done.
4.1 Equipment, Location and Setup
The test was conducted from 7th May, 2011 to 15th May, 2011 at the HCI Eye Tracking
Lab 2258 in RIT’s Golisano College, building 70. The stimulus was displayed on a 17-inch
external monitor connected to a PC, with a keyboard and mouse. The computer that was used by
the participants in the lab, was running on the Windows 7 platform, Internet Explorer 8 with high
speed internet, and Techsmith Camtasia 7.1 to collect and record user’s actions on the screen and
any dialogue that took place within the room. The lab PC was also equipped with Mirametrix S1
Eye Tracker, and Mirametrix software to collect and record users’ gaze, scan paths and fixations.
4.2 Participants
Twenty-four participants (12 Female, 12 Male, Mage = 22.1 years, Age Range: 18-30
years) were recruited for this study through a screener questionnaire (See Appendix A) that was
emailed to the entire student body (See Appendix B). Candidates were selected based on the user
profile created for this study (See Table 1). The participants were given explicit instructions
subjects were composed of students from Rochester Institute of Technology, Rochester, New
York. The eye tracker was calibrated for each participant, so the system can understand the
characteristics of participant's eyes. For this calibration, participants were requested to keep their
head still and fixate their eyes at each of the dots that appeared on the screen and follow them
with their gaze.
User Characteristics User Profile
Demographics Gender:
- Female (12 participants) - Male (12 participants) Demographics
Age: - 18 to 30 Demographics
Physical Limitations:
- May be fully able-bodied. Must not have physical limitations in relation to sight, speech, hearing, or dexterity
Other Limitations:
- Must have no previous usability testing experience. - Must have no previous eye tracking experience.
- Willing to consent for their voice, computer screen and eye movements to be recorded.
Motivation:
- Probably motivated to explore various websites Cognition Internet Usage:
- 13 + hours a week Cognition
Access to Computer:
- Owns or accesses a computer Cognition
Hardware Skills:
World Wide Web Knowledge: - Experience using WWW
[image:18.612.65.543.72.143.2]- Ability in accessing and navigating a web browser - Recognizes clickable elements
Table 1. User Profile
4.3 Procedure
In order to ensure that all participants received the same information, a formal script was
read (See Appendix D). After the participants were presented with an overview of the study, they
were requested to sign a consent form. The consent form informed the participants with a brief
description of the goals of the study, risks involved, compensation for participation, and what
information will be recorded (See Appendix E). After instructions pertaining to that usability
testing method were read, a pre-study/background questionnaire was presented to all the
participants to understand the participants’ conceptual thought process when using web interfaces
(See Appendix F).
Once the participants were acquainted with the instructions for the testing method, the
first website along with the two tasks were presented (See Appendix G). After the two tasks
were completed, the participants completed post-task questionnaires (See Appendix H). The
post-task questionnaire helped understand the participants’ perceived satisfaction. The same
process was followed to test the second website. After all the tasks and post-task questionnaires
were completed, participants with ‘Think-Aloud’ as a testing method were asked to complete a
post-study questionnaire. This questionnaire provided insight into what the participants felt about
4.4 Experimental Design
The three conditions in the experiment were ‘Think Aloud’, ‘Eye Tracking’ and ‘Think
Aloud and Eye Tracking’. In the ‘Think Aloud’ only condition, participants were asked to
verbalize their thoughts and actions when performing a task on the given website. In the ‘Eye
Tracking’ only condition, participants’ eyes were calibrated to collect and record eye movements,
scan paths, number of fixations and duration of fixations. In the ‘Think Aloud and Eye Tracking’
condition, participants were asked to verbalize their thoughts while their eye movements and
scan paths were recorded.
The experiment was a between subjects where each participant was presented with only
one condition. Each test condition had eight participants and each participant was presented with
two tasks on each of the two websites, Norwegian Cruise Lines (www2.ncl.com) and California
Department of Motor Vehicles (www.dmv.ca.gov) (Appendix C) . On the Norwegian Cruise
Lines website, the tasks were to find cruise excursion information and to book a cruise to the
Bahamas from Miami (Detailed Task Scenarios in Appendix G). On the California Department
of Motor Vehicles website, the tasks were to find information about moving driver’s license and
moving license plates to the state of California (Detailed Task Scenarios in Appendix G). In
order to eliminate order effect, the order in which the tasks were presented were counterbalanced
(See Table 2 and Table 3). The condition under which the participant performed the assigned
tasks was the independent variable. The number of usability problems, scan patterns, number of
Think Aloud Eye Tracking Think Aloud & Eye Tracking
Participant 1 Participant 9 Participant 17
Participant 2 Participant 10 Participant 18
Participant 3 Participant 11 Participant 19
Participant 4 Participant 12 Participant 20
Participant 5 Participant 13 Participant 21
Participant 6 Participant 14 Participant 22
Participant 7 Participant 15 Participant 23
[image:20.612.144.468.70.343.2]Participant 8 Participant 16 Participant 24
Table 2. Participant Breakdown Per Condition
Participant # Sequence of TasksSequence of TasksSequence of TasksSequence of Tasks
Participants 1, 9, 17
Website 1 Task 1 Website 1 Task 2 Website 2 Task 1 Website 2 Task 2 Participants 2, 10, 18
Website 1 Task 1 Website 1 Task 2 Website 2 Task 2 Website 2 Task 1 Participants 3, 11, 19
Website 1 Task 2 Website 1 Task 1 Website 2 Task 1 Website 2 Task 2 Participants 4, 12, 20
Website 1 Task 2 Website 1 Task 1 Website 2 Task 2 Website 2 Task 1 Participants 5, 13, 21
Website 2 Task 1 Website 2 Task 2 Website 1 Task 1 Website 1 Task 2 Participants 6, 14, 22
Website 2 Task 1 Website 2 Task 2 Website 1 Task 2 Website 1 Task 1 Participants 7, 15, 23
Participant # Sequence of TasksSequence of TasksSequence of TasksSequence of Tasks
Participants 8, 16, 24
[image:21.612.73.543.76.140.2]Website 2 Task 2 Website 2 Task 1 Website 1 Task 2 Website 1 Task 1
Table 3. Task Counterbalance
Condition 1:
Think Aloud Eye TrackingCondition 2: Think Aloud &Condition 3: Eye Tracking
5 minutes Introduction to the SessionIntroduction to the SessionIntroduction to the Session
5 minutes Pre-Test ArrangementsPre-Test ArrangementsPre-Test Arrangements
5 minutes Think Aloud Protocol Set-up Eye Tracker and
Calibrate the Participant Think Aloud Protocol, Set-up Eye Tracker and Calibrate the Participant
30 minutes
Tasks Tasks
Think Aloud Protocol, Set-up Eye Tracker and Calibrate the Participant
30 minutes
Tasks Tasks
Tasks
15 minutes
Post Test Questionnaire and Debriefing Post Test Questionnaire and Debriefing
Tasks
15 minutes
Post Test Questionnaire and Debriefing Post Test Questionnaire and Debriefing
Post Test Questionnaire and Debriefing 15 minutes
Post Test Questionnaire and Debriefing
Table 4. Session timing
Details (See Table 4):
Introduction to the Session (5 minutes)
[image:21.612.72.540.186.595.2]• Set-up the eye tracker as per the condition and participant. Calibrate the participant's eyes. Tasks (Approximately 30 minutes)
• Participant will examine the stimuli presented to them to perform the tasks. Post Test and Debriefing (15 minutes)
• Participant will fill out post-task questionnaires, post-test questionnaire and be asked general questions to collect qualitative data.
• Confer about any particular issues that came up for the participant.
4.6 Data Collected and Analysis
A heuristic evaluation (Appendix J) of each of the websites was used as a benchmark for
identifying thirty-two (32) unique usability problems in the Norwegian Cruise Lines website and
nineteen (19) unique usability problems with the California DMV website. In the ‘Think Aloud
Only’ (TA) condition, data gathered through post-task questionnaires and verbalizations of the
participants were analyzed to find the number of usability problems discovered or recognized by
the participants in the condition. Traditionally in usability testing a moderator’s observations are
accounted for in discovering usability problems. But in order to eliminate any bias from the
moderator’s experience in observations and to make sure that only Think Aloud data and
participant reported questionnaires are accounted for, the moderator’s observations were
excluded from the usability problems analysis. For the ‘Eye Tracking Only’ (ET) condition, data
gathered through post-task questionnaires, scan paths and evaluation conditions/rationale
(Appendix K) were evaluated to obtain the total number of usability problems. For the ‘Eye
Tracking and Think Aloud’ (ET+TA) condition, data gathered through post-task questionnaires,
verbalizations, scan paths and evaluation conditions/rationale were combined to calculate the
5. Results
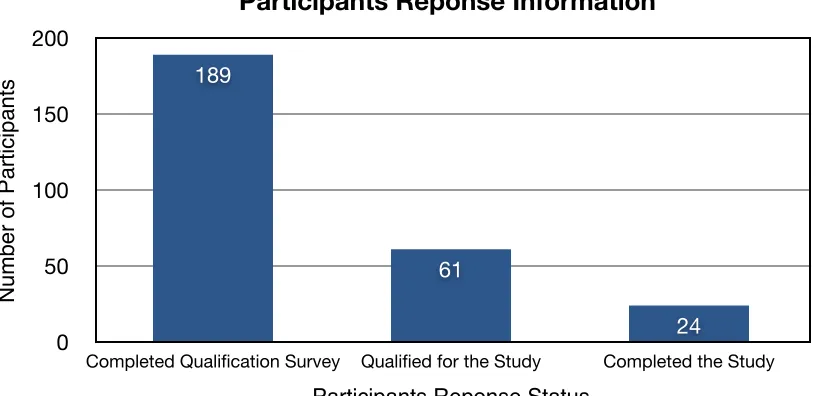
Participants for the study were recruited through a qualification survey between April
2011 and May 2011. A total of 189 people completed the survey. Approximately 32% (actual
32.28%) qualified for the study. Twenty four participants were successfully recruited and
completed the study. The remainder of the qualified participants did not either respond to the
[image:23.612.105.513.269.467.2]study recruitment email or were no longer interested in participating in the study.
Figure 1. Values representing the participants response information.
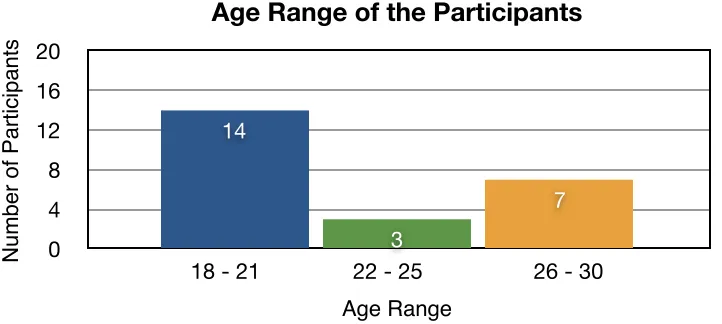
5.1 Demographics
Fourteen (14) participants were between the ages of ‘18 and 21’, three (3) participants
were between the ages of ‘22 and 25’, and seven (7) participants were between the ages of ‘26
and 30’. Sixteen (16) participants were undergraduate students and eight (8) participants were
graduate students at Rochester Institute of Technology. There were no participants younger than
the age of eighteen and older than the age of thirty.
0 50 100 150 200
Completed Qualification Survey Qualified for the Study Completed the Study
24 61
189
Participants Reponse Information
N
u
mb
e
r
o
f
Pa
rt
ici
p
a
n
ts
Figure 2. Values representing the age of the participants.
5.2 Field of Interest
Nine (9) participants were from an Engineering background, six (6) participants were
from Computing and Information science, three (3) participants from Math and Science, two (2)
participants each from Liberal Art studies and Business and Finance, and One (1) participant
each from Arts and Other educational background.
Figure 3. Values representing the educational background of the participants.
0 4 8 12 16 20
18 - 21 22 - 25 26 - 30 7 3
14
Age Range of the Participants
N u mb e r o f Pa rt ici p a n ts Age Range 0 2 4 6 8 10 12 Education 1 3 2 9 6 2 1 Participants’ Education
Number of Participants
[image:24.612.80.483.423.693.2]5.3 Internet Usage and Study Experience
Internet Usage: Participants recruited for the study reported that they spend more than thirteen
hours per week using the internet (browsing through websites) on a computer.
Usability and Eye Tracking Studies: All the twenty-four participants recruited for this study did
not have any prior experience with usability studies and eye-tracking studies.
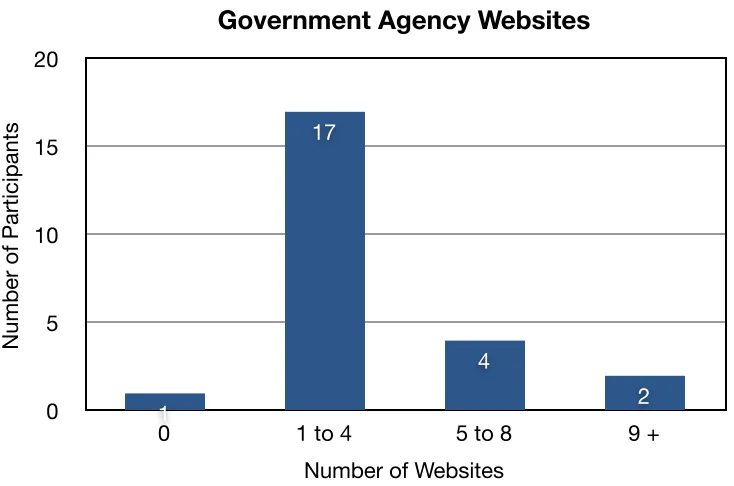
5.4 Experience with Government Related and Travel Websites
Seventeen (17) participants had experience with ‘1 to 4’ government related websites in
searching and browsing through the content to find information. Six (6) participants had
experience with 5 or more government related websites (See Figure 4).
Fourteen (14) participants had experience with ‘1 to 4’ travel related websites in
searching and browsing to book a trip. Seven (7) participants had experience with 5 or more
Figure 4. Values representing the number of participants and the number of government agency websites previously visited.
Figure 5. Values representing the number of participants and the number of travel related websites previously visited.
0 5 10 15 20
0 1 to 4 5 to 8 9 +
2 4
17
1
Government Agency Websites
Number of Participants
Number of Websites
0 5 10 15 20
0 1 to 4 5 to 8 9 +
3 4
14
3
Travel Related Websites
Number of Participants
[image:26.612.123.493.399.636.2]5.5 Tasks
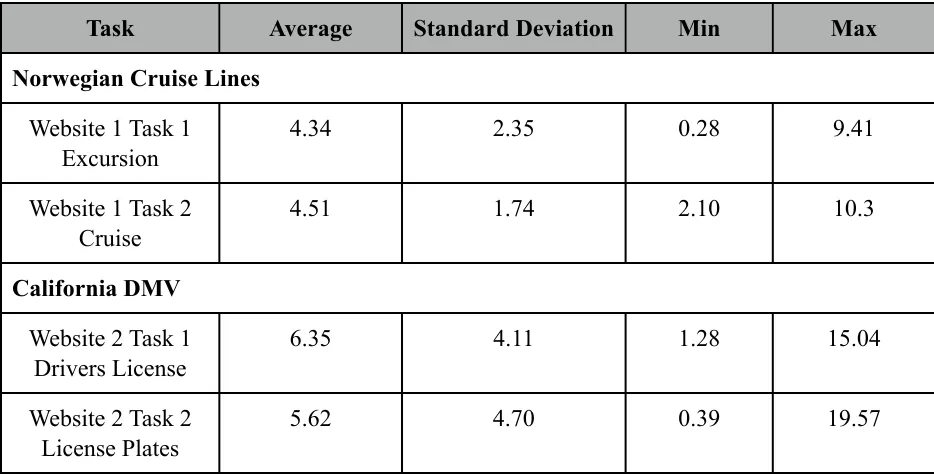
5.5.1 Time on Task
The time on task for all the twenty-four participants was calculated. It was noted that it
took participants on an average approximately six and a half (6.5) minutes to complete the task
on finding drivers license information, and approximately six (6) minutes to complete the task on
finding license plate information on the California DMV website. It took participants
approximately four and a half (4.5) minutes each to complete the task of finding excursion
information, and cruise information on the Norwegian Cruise Lines Website (See Table 5 and
Table 6).
Task Average Standard Deviation Min Max
Norwegian Cruise Lines Norwegian Cruise Lines Norwegian Cruise Lines Norwegian Cruise Lines Norwegian Cruise Lines
Website 1 Task 1 Excursion
4.34 2.35 0.28 9.41
Website 1 Task 2 Cruise
4.51 1.74 2.10 10.3
California DMV California DMV California DMV California DMV California DMV
Website 2 Task 1 Drivers License
6.35 4.11 1.28 15.04
Website 2 Task 2 License Plates
5.62 4.70 0.39 19.57
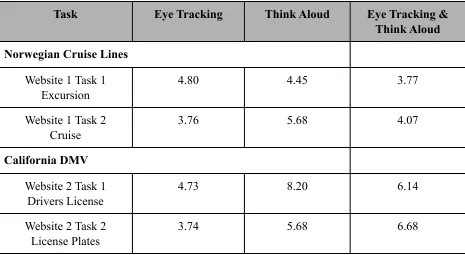
[image:27.612.72.539.335.572.2]Task Eye Tracking Think Aloud Eye Tracking & Think Aloud Norwegian Cruise Lines
Norwegian Cruise Lines Norwegian Cruise Lines
Website 1 Task 1 Excursion
4.80 4.45 3.77
Website 1 Task 2 Cruise
3.76 5.68 4.07
California DMV California DMV California DMV
Website 2 Task 1 Drivers License
4.73 8.20 6.14
Website 2 Task 2 License Plates
[image:28.612.74.539.90.345.2]3.74 5.68 6.68
Table 6. Time Taken to Complete Each Task Per Condition
5.5.2 Success / Failure of Tasks
Upon analysis, it was noted that 37.5% of the participants (9 out of 24) did not complete
the task of finding license information and 41.67% of the participants (10 out of 24) did not
complete the task of find license plates information on the California DMV website (See Table
7). The rate of task completion for the tasks on Norwegian Cruise Lines website was higher.
Only two (2) participants did not finish the task on find an excursion. (Detailed Table in
Appendix M)
Task Success Failure
Norwegian Cruise Lines Norwegian Cruise Lines Norwegian Cruise Lines
Website 1 Task 1 Excursion
24 0
Website 1 Task 2 Cruise
Task Success Failure California DMV
California DMV California DMV
Website 2 Task 1 Drivers License
15 9
Website 2 Task 2 License Plates
[image:29.612.69.536.72.203.2]14 10
Table 7. Success and Failure of Tasks
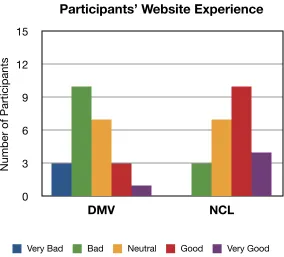
5.5.3 Participants’ Website Experience
After the tasks were finished, all the participants completed a survey to rate their
experience with the websites. Approximately 54% of the participants expressed their experience
as ‘bad’ or ‘very bad’ with the California DMV website. Approximately 58% of the participants
expressed their experience as ‘good’ or ‘very good’ with the Norwegian Cruise Lines (NCL)
website (See Figure 6).
0 3 6 9 12 15
DMV NCL
Participants’ Website Experience
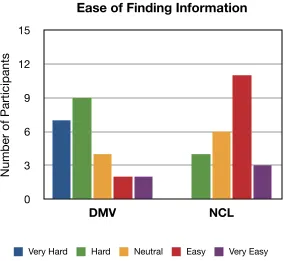
[image:29.612.164.448.438.695.2]5.5.4 Ease of Finding Information
Approximately 67% of the participants expressed it was ‘hard’ or ‘very hard’ to find
information on the California DMV website (See Figure 7). Approximately 54% of the
participants expressed it was ‘easy’ or ‘very easy’ to find information on the Norwegian Cruise
[image:30.612.164.450.227.488.2]Lines (NCL) website (See Figure 7).
Figure 7. Values representing the participants’ ease of finding information
5.5.5 Usability Problems
For each of the conditions, the number of usability problems (non-unique) was calculated
using the data collected. The usability problems discovered by the participants on each of the
website were combined together to obtain the total number usability problems per condition and
per website. It was observed that the total number of usability problems discovered the ‘Eye
Tracking and Think Aloud’ (ET + TA) condition was higher than the conditions of ‘Think Aloud
Only’ (TA) and ‘Eye Tracking Only’ (ET) (Eye Tracking = 89, Think Aloud = 55, Eye Tracking
0 3 6 9 12 15
DMV NCL
Ease of Finding Information
Number of Participants
+ Think Aloud = 103) (See Figure 8 Below). For both websites, the ‘TA’ condition had the least
number of usability problems (Total Think Aloud = 55, NCL = 32, DMV = 23) (See Table 8) .
Refer to Appendix L for a detailed table of usability problems per condition and the number of
[image:31.612.130.482.229.458.2]participants who identified the problems.
Figure 8. Values representing the total number of usability problems per condition (Not Unique).
Condition Eye Tracking Think Aloud Eye Tracking +
Think Aloud Norwegian Cruise Lines
Norwegian Cruise Lines Norwegian Cruise Lines Norwegian Cruise Lines
62 32 73
California DMV California DMV California DMV California DMV
27 23 30
0 22 44 66 88 110
Eye Tracking Think Aloud Eye Tracking + Think Aloud
103
55 89
Total Number of Usability Problems Per Condition
[image:31.612.70.541.530.678.2]A one way ANOVA revealed that there was a significant difference between the
conditions (F (2,21) = 21.574, p < .05, see Table 9 Below). A Tukey HSD post-hoc test on the
number of usability problems revealed that there was a statistically significant difference
between the conditions ‘ET’ and ‘TA’, and ‘TA’ and ‘ET + TA’ (p< 0.05, see Table 10). The test
also revealed that there was no significant difference between the conditions ‘ET’ and ‘ET +
[image:32.612.75.539.283.372.2]TA’ (p>0.05, see Table 9 Below).
Table 9. Eye Tracking, Think Aloud, Eye Tracking & Think Aloud Between Groups Effect
[image:32.612.78.537.455.616.2]A total of nineteen (19) unique usability problems on the California DMV website and
thirty-two (32) unique usability problems on the Norwegian Cruise Lines website were
discovered through heuristic evaluations. For each of the conditions, the number of unique
usability problems discovered were calculated. It was observed that the number of unique
usability problems discovered by the conditions ‘Think Aloud Only’ (TA) and ‘Eye Tracking
and Think Aloud’ (ET + TA) on the California DMV website were same. The number of unique
usability problems discovered by the conditions ‘Eye Tracking Only’ (ET) and ‘Eye Tracking
and Think Aloud’ (ET + TA) on the Norwegian Cruise Lines website were same. (See Figure 9
[image:33.612.119.484.374.627.2]Below).
Figure 9. Values representing the number of unique usability problems discovered per condition.
0 5 10 15 20 25 30 35 DMV NCL 17 9 17 8 16 9 32 19
Number of Unique Usability Problems Discovered Per Method
N u mb e r o f U sa b ili ty Pro b le ms
5.5.6 Thinking Aloud During the Study
A total of sixteen (16) participants from the conditions ‘TA’ and ‘ET+TA’ completed a
post-study questionnaire. The analysis of the responses showed that 62.5% of the participants (10
out of 16 participants) felt that they were unable to verbalize all their thoughts, actions and feelings (pertaining to the task) successfully. A post-study questionnaire also captured the users’
impressions on what areas they had difficulty expressing or verbalizing (See Table 11).
User Impressions on Difficulty Expressing/Verbalizing
“I was looking for information so I kept forgetting to think out loud.”
“It was difficult because I would start thinking to myself and it was hard not to think to myself. I feel like I do not say as much when compared to the amount of thoughts in my head.”
“It was hard to voice the way I analyze the information. I can say what i am looking at but it is hard to also say how I processing that information.”
“It was hard to say what I was doing and thinking at the same time. My brain moved too fast to explain every thing that was happening and then when i thought I was close, I would become quieter because I was thinking more than trying to verbalize.”
“It was hard trying to say everything I was thinking.”
“Most of what I did was read aloud and couldn’t verbalize how I made choices.”
“I could read the website text accurately at times but could not correctly read the words out aloud.”
“Most of what is experienced or read is unconscious anyways.”
“It was hard to capture all of my frustration when dealing with the California DMV website. It was must easier to explain my positive emotions.”
Table 11. User Impressions
5.5.7 Other Results
A correlation between the gender of the participants and the comfort level in verbalizing
thoughts during the Think-Aloud sessions resulted in statistically insignificant results (r = 0.074,
p-value [2 sided] = 0.79, p-value [1 sided] = 0.39) (See Table 12).
[image:35.612.135.477.257.501.2]
Table 12. Correlation between Gender of Participants and Comfort Level in Verbalizing Thoughts
Similarly a correlation between the gender of the participants and task completion resulted in
insignificant results (p>0.05).
• Gender and task completion of drivers license information : r = 0.086, p-value [2 sided] =
• Gender and task completion of license plates information : r = 0, value [2 sided] = 1,
p-value [1 sided] = 0.5
• Gender and task completion of excursion : r = NA, p-value [2 sided] = NA, p-value [1
sided] = NA
• Gender and task completion of Cruise : r = -0.30, p-value [2 sided] = 0.15, p-value [1
6. Discussion
Question 1: Can the addition of Eye Tracking and eye movement data to the traditional Think Aloud method uncover more usability problems?
The analysis of the data showed that the total number of usability problems (non-unique)
identified by the participants in the ‘Eye Tracking and Think Aloud’ (ET + TA) condition was
higher than the other two conditions (Total Usability Problems = 103, DMV = 55, NCL = 89).
However a Tukey HSD post-hoc test revealed that the difference between ‘ET + TA’ and the ‘Eye
Tracking Only’ (ET) conditions was not significant. It is possible that the difference between the
two conditions could have been higher if the participants were able to verbalize their thoughts
and were comfortable with Thinking Aloud their actions. As Krahmer and Ummelen (2004)
suggested, the atypical nature of Think-Aloud made it harder to capture that Think-Aloud data.
Few of the participants have expressed during the study that their actions and thoughts were too
fast to verbalize and that they omitted some for the information. This is consistent with what
Eger et al. (2007) suggested.
Question 2:Is the Think Aloud method disruptive in such a way that it would yield in fewer usability problems when compared to Eye Tracking conditions?
The non-significant difference between the conditions ‘Eye Tracking’ (ET) and ‘Eye
Tracking and Think Aloud’ (ET + TA) led to inconclusive results on whether the Think Aloud
method is disruptive or not. But the qualitative data collected from the Think Aloud participants
that Think Aloud stresses and demands the participants to pay more attention and focus harder.
During the usability test sessions, it was observed that the participants often became quiet,
stopped verbalizing and forgot to Think Aloud. As a result, they had to be reminded constantly to
express their thoughts, actions and feelings pertaining to the task. As Krahmer & Ummelen
(2004) suggested, it is possible that since Thinking Aloud is not typical in daily life, the
participants had to be prompted to verbalize. Another possible explanation for this observation is
that the participants selected for this study did not have any prior experience with the Think
Aloud method and thus might have required more coaching or practice exercises.
6.1. Limitations and Recommendations
6.1.1 Participant Recruitment
Participants for this study were recruited in the months of April and May of 2011.
Although the response rate for the participant screener was high (189 responses), a lot of the
participants did not qualify as they did not match the study’s user profile. Moreover final exams
and graduation made it hard to recruit qualified participants to dedicate 60 minutes to 90 minutes
of their time. In four (4) instances, recruited participants did not show up for the study. Perhaps
providing a $5 - $10 incentive for every participant instead of two $30 gift cards from a drawing
of twenty-four (24) participants might have ensured participant attendance.
6.1.2 Usability Testing Equipment
For the Eye Tracking conditions, it was hard to calibrate several of the participant's eyes.
Restarting the eye tracker and the computer, dimming the lights (to reduce glare), or asking the
participant to reposition their head helped solve the problem. There were instances when the eye
tracker completely stopped and restarted tracking the eye movement of the participants thereby
6.1.3 Data Lost
In the Think Aloud condition, the audio file for the 8th participant was found to be
corrupted. However, data from the post-task questionnaire and the post-study questionnaire were
used in the analysis. As California DMV changed their website and redoing the session with
another participant was not possible. The average number of usability problems for the other
seven(7) participants in the condition was calculated. The average was then applied to the 8th
participant to calculate the total number of usability problems in the condition.
In the Think Aloud condition, for the 5th participant, some of the links on the California
DMV website did not work. So the participants verbalized, where he would have found that
information and the task had to be stopped after that.
6.1.4 Study Questionnaires
During the study the participants filled out paper-based questionnaires, a pre-study
questionnaire, two(2) post-task questionnaires and a post-study questionnaire (Think Aloud Only
Condition and Eye Tracking and Think Aloud Only Condition). For the open-ended questions,
participants either choose to not answer the questions or expressed their thoughts in one or two
sentences. As computer users are more accustomed to filling surveys, and forms online using a
keyboard, perhaps have the participants complete on-line/digital questionnaires could have
yielded in more gathering more information.
6.1.5 Tasks
One of the tasks on the Norwegian Cruise Lines website was to find a cruise that offers
‘Wild West Clear Kayak’ excursion. Several participants were confused by the word/term
‘License Plates’. Some of the participants did not know that in order to new license plates for a
vehicle in another state, a vehicle would have to be registered. Perhaps choosing websites and
tasks that are similar to everyday users‘ tasks might have avoided any misunderstanding or
uncertainty, like checking the weather, finding out a sport’s team’s score, etc.
6.1.6 Think Aloud and Eye Tracking Protocols
When analyzing the data to count the number of usability problems discovered by a
participant, the gaps and pitfalls of both the protocols, Think Aloud and Eye Tracking become
more evident. Participants who were Thinking Aloud during the sessions became quite and often
started to omit their verbalizations. And since there was no verbal data on what the participants
were thinking or were looking at, it was hard to conclude whether they found the usability
problems on the websites or not. Thus the total number of usability problems were found to be
lower when compared to other conditions. (Refer to Table 8 for participant impressions on Think
Aloud).
As Cowen, Ball, and Delin (2001) suggested, there are no benchmarking rules for Eye
Tracking data, thus making the analysis of the data subjective. Thus for each of the usability
problems discovered through heuristic evaluation, an evaluation rule had to be created. Post-task
and post-study questionnaires, scan paths, and mouse clicks were applied to created the
evaluation rules. While these evaluation rules set for this study revealed more usability problems
through the Eye Tracking sessions, the results could vary based on different moderators setting
7. Conclusion
The Think Aloud method is effective in capturing the thoughts of participants
concurrently as they perform the tasks in a usability study. But in this study, the traditional
protocol of usability testing has proven to play a less significant role as the data collected during
Think Aloud sessions was incomplete compared to the data collected during the Eye Tracking
sessions. The lack of experience of novice participants left room for gaps and allowed for only
small bursts of limited verbalizations to be captured. This led to the inference that Think Aloud
alone cannot provide all the necessary information during testing.
Eye Tracking has proven to be a very resourceful method in providing valuable insight
into users’ eye patterns and scan paths. This has helped answer questions and problems relating
to whether and how users view a certain component in the interface, and what areas do and do
not capture users’ gaze, etc. But the lack of analysis rules, as described by Cowen et. al., makes
Eye Tracking data hard to evaluate. And this shortfall has proven to be more evident in this study
and has led to the conclusion that Eye Tracking data can be analyzed in various and dissimilar
ways based on the guidelines set by an evaluator resulting in different conclusions.
All in all, the results of this study suggest that Think-Aloud data is insufficient, and
without analysis rules, Eye Tracking data also is inadequate and restricted in finding all the
usability problems of an interface. The insignificant difference between the total number of
usability problems between the condition ‘Eye Tracking’ and ‘Eye Tracking and Think Aloud’
8. Future Research
Future Think Aloud research could benefit from determining how much and what
practice sessions can be exercised with the participants on how to comfortably verbalize their
thoughts out loud. Participants with more practice might understand how to verbalize and
provide verbal data about what they are doing and why. In future studies, it would also be
interesting to understand how a moderator’s observations can effect the results in finding the
total number of usability problems.
Research on how to create evaluation rules for Eye Tracking can help eliminate any
ambiguity on analyzing the participants’ eye movement data. A standard model or procedure can
9. References
Cooke, L. (2010). Assessing Concurrent Think-Aloud Protocol as a Usability Test Method : A
Technical Communication Approach, 53(3), 202-215.
Cooke, L., & Cuddihy, E. (2005). Using eye tracking to address limitations in think-aloud
protocol. IPCC 2005. Proceedings. International Professional Communication
Conference, 2005., 653-658. Ieee. doi: 10.1109/IPCC.2005.1494236.
Cooke, L. (2006). Is Eye Tracking the Next Step in Usability Testing? 2006 IEEE International Professional Communication Conference, 236-242. Ieee. doi: 10.1109/IPCC.
2006.320355.
Cowen, L. (2001). An Eye Movement Analysis of Web-Page Usability. Unpublished Masters’ thesis, Lancaster University, UK.
Eger, N., Ball, L. J., Stevens, R., & Dodd, J. (2007). Cueing Retrospective Verbal Reports in
Usability Testing Through Eye-Movement Replay. Test, 129-137.
Ericsson, K, & Simon, H. (1980). Verbal reports as data. Psychological Review, 87(3), doi: 10.1016/j.physletb.2003.10.071
Ericsson, K, & Simon, H. (1998). How to study thinking in everyday life: contrasting think-aloud protocols with descriptions and explanations of thinking. Mind, Culture & Activity,
5(3), 178-186.
Gerjets, P., Kammerer, Y., & Werner, B. (2010). Measuring spontaneous and instructed
evaluation processes during Web search: Integrating concurrent thinking-aloud protocols and eye-tracking data. Learning and Instruction, 21(2), 220-231. Elsevier Ltd. doi: 10.1016/j.learninstruc.2010.02.005.
Goldberg, J., & Kotval, X. (1998). Computer interface evaluation using eye movements: methods and constructs. International Journal of Industrial Ergonomics, 24(6), 631-645. doi: 10.1016/S0169-8141(98)00068-7.
Guan, Z., Lee, S., Cuddihy, Elisabeth, & Ramey, J. (2006). The validity of the stimulated retrospective think-aloud method as measured by eye tracking. Proceedings of the
SIGCHI conference on Human Factors in computing systems - CHI ’06, 1253. New York, New York, USA: ACM Press. doi: 10.1145/1124772.1124961.
Jacob, R, & Karn, K. (2003). Eye tracking in human–computer interaction and usability research: ready to deliver the promises. The Mind’s Eye: Cognitive and Applied Aspects of Eye Movement Research. (pp. 573-605).
Krahmer, E., & Ummelen, N. (2004). Thinking About Thinking Aloud: A Comparison of TwoVerbal Protocols for Usability Testing. IEEE Transactions on Professional Communication, 47(2), 105-117. doi: 10.1109/TPC.2004.828205.
Krug, S. (2005). Don’t Make Me Think: A Common Sense Approach to Web Usability, 2nd ed.
Berkeley, CA: New Rider’s Press
Manhartsberger, M., & Zellhofer, N. (2005). Eye tracking in usability research : What users really see. Usability Symposium, 198, 141-152.
Nielsen, J., Clemmensen, T., & Yssing, C. (2002). Getting access to what goes on in people ’ s heads ? - Reflections on the think-aloud technique. October, 101-110.
Nielsen, J. (2003, August 25). Usability 101: introduction to usability. Retrieved from http:// www.useit.com/alertbox/20030825.html
Nielsen, J, & Pernice, K. (2009). Eyetracking Web Usability. Berkeley, CA: New Riders Pub.
Pretorius, M. C., Biljon, J. V., & Kock, E. D. (2010). Added Value of Eye Tracking in Usability Studies : Expert and Non-expert Participants. Ifip International Federation For
Information Processing, 110-121.
Ramey, J, Boren, T, Cuddihy, E, Dumas, J, Guan, Z, van den Haak, M.J., & De Jong, M.D.T.
(2006). Does think aloud work? how do we know?. Proceedings of the CHI 2006, doi:
10.1145/1125451.1125464.
Rhenius, D, & Deffner, G. (1990). Evaluation of concurrent thinking aloud using eye-tracking data. Proceedings of the Human Factors Society 34th Annual Meeting, 2, 1265-1269
Rozanski, E., Haake, A. R., Karn, K. S., Vigliotti, A. M., Pelz, J. B. “Simplified Eye tracking
Enhances Problem Understanding and Solution Discovery in Usability Testing,” Human
Factors and Ergonomics Society 49th Annual Meeting (HFES 2005), Orlando, FL, Sept. 26-30, 2005
Rubin, J. (1994). Handbook of Usability Testing: How to Plan, Design, and Conduct Effective Tests. New York: Wiley
Schiessl, M., Duda, S., Thölke, A., & Fischer, R. (2003). Eye tracking and its application in usability and media research. MMIInteraktiv, 6, 41–50. Retrieved from http://
Van Den Haak, M. J., De Jong, M. D. T., & Schellens, P. J. (2003). Retrospective vs. concurrent think-aloud protocols: testing the usability of an online library catalogue. Behaviour and Information Technology, 22(5), 339-351.
Van Gog, T., Paas, F., & Van Merrienboer, J. J.G (2005). Uncovering expertise-related
differences in troubleshooting performance: combining eye movement and concurrent verbal protocol data. Applied Cognitive Psychology, 19(2), 205-221.
Yarbus, Alfred. (1967). Eye movements during perception of complex objects. Eye Movements
Appendix A - Participant Screener
1. What is your gender?
Male
Female2. To which age group do you belong?
Under 18
18 - 21
22 - 25
26 - 30
31 and over3. Are you currently a student at RIT?
Yes
No4. If yes, what area is your field of study at the University?
Arts
Business and Finance
Computing and Information Sciences
Engineering
Liberal Arts
Math And Science
Other______________________________________________5. Do you require glasses in order to read a computer screen?
Yes
No
Yes
No7. Do you have any other visual impairments?
Yes
No8. If yes, please explain in detail below:
9. Do you require any assistance using a computer keyboard and a mouse?
Yes
No10.Do you have any hearing or speech impairments?
Yes
No11.Do you own or have access (e.g Labs, etc) to a computer on a daily basis?
Yes
No12.Approximately how many hours per week do you spend using the computer Internet
(Browsing through websites, not email)?
0 – 6
7 - 12
No14.Have you ever participated in an eye tracking study?
Yes
No15.Would you be willing to consent to have your voice and the computer screen recorded?
All information will be kept confidential and will be used for research study purposes
only.
Yes
NoPlease fill out name and email address in case you are selected for the study:
Appendix B - Participant Recruitment Email
---Hello all,
I am currently looking for students to participate in a usability study on web interfaces. There are two parts to the study. The first part is a survey which will take about 10 to 15 minutes to
complete. The second part is a usability test session that will be conducted on campus (Bldg 70). The details regarding the second part of the study will be presented to you at a later time.
The link to the survey (1st part): https://spreadsheets.google.com/a/g.rit.edu/spreadsheet/ embeddedform?formkey=dEhPaFE1Zzg2S01fVGZtMWVjWFdoYUE6MQ
Also, if you participate in both parts of the study, you will entered in a random drawing to win 1 of 2 $30 Visa gift cards. Both winners will be contacted at the conclusion of the second part of the study. If you have any questions or concerns, do not hesitate to contact Alekhya Paruchuri at [email protected].
Thanks!
Regards,
Alekhya Paruchuri
MS - Human Computer Interaction Rochester Institute of Technology '11
---Appendix C - Websites
Appendix D - Formal Script
Usability Study Of Web Interfaces
Agenda
Thank you for your willingness to participate in this usability study to assist in assessing the usability of web interfaces. This study will be comprised of seven parts:
Overview
Informed Consent
Usability Testing Method
Background Questions
Tasks
Follow-Up Questions
Overview (Orientation Script)
This study is designed to help understand user behavior and thought processes in navigating through the websites to find the necessary information. In order to gain this understanding, a set of tasks will be provided for you to perform. During and after performing each task, you will be asked to give your comments on what areas are designed well and what areas need improvement.
I would like to stress that the goal of the study is not to assess you or your abilities, but rather to evaluate the usability of specific web pages and the information they present to you.
As a moderator I’ll be taking notes and your image, voice, and computer screen will be recorded during the session for analysis purposes only. All of the equipment in the room is to make sure that my notes are accurate.
The data and observations gathered from you today, combined with data and observations from other participants, will provide me with a better understanding of the current usability testing methods. Your participation is completely voluntary, and you may discontinue your participation at any time. This study should last about 60 minutes.
You are welcome to take a break at any time during the session. Do you have any questions so far?
---Informed Consent
Before we begin, let’s go over the informed consent document. Please follow along as I read this form aloud.
---Think Aloud Method
During this study, I ask that you please think aloud while you perform each task. As you work through the tasks, say out loud what you are thinking, doing, or feeling. Let’s try a simple exercise to give you a better understanding of the think aloud method.
Eye Tracking
During the set up of the equipment, you will go through a process of calibration for you eyes. This enables the system to record the areas and paths of how you view the computer screen. For the calibration process, nine dots will appear on the screen one after another. Please follow the dots with your eyes.
---Pre-Study Questionnaire
Please fill the pre-study questionnaire.
---Tasks
On the table in front of you, are the first set of tasks I would like you to perform. You’ll do the tasks one at a time, using the computer in front of you.
When you have completed the tasks, please say aloud, “I’m done.”. After the first two tasks, you’ll answer a couple questions about your experience performing the task.
After you have completed the questions, I will give you next set of tasks to perform. Do you have any questions before we begin?
---Post-Task Questionnaire
Please fill the pre-task questionnaire.
---Debriefing and Wrap-Up
Appendix E - Consent Form
PROJECT NAME – WEBSITE USABILITY STUDY
RESEARCHER’S STATEMENT
My name is Alekhya Paruchuri ([email protected]) and I am conducting this usability study as a part of my thesis research. I appreciate you for taking the time and invite you to be in the usability study today. The purpose of this consent form is to give you the information you will need to help you decide whether to participate in this study. Please read the form carefully. You may ask questions about the purpose of the study, what I will ask you to do, the possible risks and benefits, your rights as a volunteer, and anything else about the research or this form that is not clear. When I have answered all your questions, you can decide whether or not you want to participate in the study.
PURPOSE OF THE STUDY
I am testing the usability of two websites during the course of this study. I am conducting this usability study to better understand user behavior and thought processes in navigating through the websites to find the necessary information. By testing the usability of the websites, I can uncover site errors and analyze feedback to improve a users’ interaction with web interfaces. The conclusions drawn from this research can provide the knowledge for a better and improved usability testing methods of web based interfaces. This is not a test of you, or your abilities. Rather, we are evaluating the usefulness of the website.
RISKS
There are no physical risks to this usability study.
BENEFITS
A potential benefit of participating in this study is that your feedback will be taken into
consideration to improve upon the current usability testing methods. As a participant, you will gain the experience of being involved in a real usability test.
OTHER INFORMATION
Subject’s Statement
This study has been explained to me, and I have had the opportunity to ask questions. I
volunteer to take part in this research. If I have questions later about the research, I can contact Professor Evelyn Rozanski via email at [email protected]. If I have questions about my rights as a research subject, I can contact Sara Renna from RIT’s Human Subjects Research Office by phone at (585) 475-5429 or via email at [email protected].
Appendix F - Pre-Study Questionnaire
1. What is your gender?
Male
Female2. What is your age? ________________ years old
3. What is your college status?
Freshman
Sophomore
Junior <