Vortex shaking study of REBCO tape with consideration of anisotropic characteristics Fei Liang1, Timing Qu2, Zhenyu Zhang1, Weijia Yuan1, Yukikazu Iwasa3, Min Zhang1
1 Applied Superconductivity Group, Department of Electronic and Electrical Engineering, University of Bath, Bath,
UK
2Department of Mechanical Engineering, Tsinghua University, Beijing, China
3Francis Bitter Magnet Laboratory, Plasma Science and Fusion Center, Massachusetts Institute of Technology,
Cambridge, USA
E-mail: m.zhang2@bath.ac.uk
Abstract
The second generation high temperature superconductor, specifically REBCO, has become a new research focus in the development of high-field (>25T) magnets. Previous research shows that applying an AC field in plane with the circulating current will lead to demagnetization due to vortex shaking. To unveil the vortex shaking mechanism of REBCO stacks, this paper provides an in-depth study, both experimentally and numerically,. A new experiment was carried out to measure the demagnetization rate of REBCO stacks exposed to an in-plane AC magnetic field. Meanwhile, 2D finite element models, based on the E-J power law, are developed to simulate the vortex shaking effects. Qualitative agreement was obtained between the experiment results and the simulation results. Our results show that the in-plane magnetic field leads to a sudden decay of the trapped magnetic field in the first half shaking cycle, due to magnetic field dependence of the circulating current. Furthermore, the decline rate of demagnetization with the increase of tape number is due to the increase of trapped magnetic field in the stack. Further study concerning the frequency of the applied AC magnetic field shows that it has little impact on the demagnetization process. Our modeling tool and findings will provide useful guidance in the development of future shaking devices for REBCO magnets.
1. Introduction
REBCO, which is commercially available, has high critical currents even in magnetic fields higher than 30 T. This feature makes them attractive materials for superconducting permanent magnets, which is used in high-power density rotating machines and high field magnets, such as nuclear magnetic resonance (NMR). For both applications, it is crucial and significant to study the vortex shaking effect of superconducting stacks made of REBCO. REBCO stacks have been reported trapped magnetic field higher than 7 T at 4.2 K[1, 2], making them promising candidate for high power density rotating machines. In the operation of rotating machines, the superconducting stacks are subjected to alternating external magnetic field, which may lead to the decay of the trapped magnetic field and results in lower performance of the machines. Thus it is paramount to understand the impact of external magnetic fields to the superconductor properties such as current density distribution and demagnetization. Also, screening currents have become a major concern in applying REBCO to high-field magnets. The screening current is mainly caused by the high aspect ratio (>20) of REBCO tapes and it may result in magnetic field distortion, temporal magnetic field drift in magnets and remnant magnetic fields [3-6], all of which have become design concerns of REBCO magnets [5, 7-9]. Previous studies show that screening current can be eliminated by applying a parallel AC magnetic field to the ab-plane [6, 10, 11], which is the so-called vortex shaking effect. Therefore, from the point of view of eliminating the screening current, it is also critical to understand the vortex shaking effect of crossed magnetic field to the superconducting stack.
Based on the double critical-state model and the two-velocity hydrodynamic model, Fisher et al studied the suppression of magnetic moment of hard superconductors under a crossed magnetic field both experimentally and theoretically [19-22]. Studies show that the double critical-state model does not works in describing the process for small values of crossed magnetic field; on the contrary, the two-velocity hydrodynamic model explains well the main features of the suppressing magnetic moment for any crossed field strength [22].
Based on the critical state model, Badía-Majós and López studied the demagnetization effect in Type II superconductor of oscillating perpendicular magnetic field [23]. Their model predicts the existence of two relaxation regimes, either a true equilibrium state of superconductor or a metastable configuration [23]. This prediction has been confirmed by an experimental study of the magnetic relaxation in MgB2 [24].
Besides these theoretical works, finite element methods (FEMs) based on Maxwell equation and E-J power law have also been widely used for simulating vortex shaking processes of superconductors [25-28]. The cross-magnetic-field effect on YBCO bulk was investigated by Vanderbemden et al [25] with both experiment and finite-element model based on H formulation and E-J power law. The H formulation is also described in details in Section 3 of this paper. Their results show that the model can predict the experimental results qualitatively. Further investigation has shown that the current redistribution in the sample causes magnetization decay. Baghdadi et al investigated the demagnetization effect of crossed magnetic field to the trapped field of REBCO stacks[26]. Their study shows that there is a striking reduction of the demagnetization factor for stacks and the demagnetization factors increase linearly with the amplitude of the ac crossed magnetic field [26]. Subsequently, Celebi et al. have also used H formulation and E-J power law to investigate the demagnetization effect of a cross-magnetic field in Bi2223 tape: experiment and analysis agree quite well [27]. Recently, Archie Campbell et al. have used both A- and H- formulation models to study the demagnetization of superconductors under cross-magnetic field [28]. The simulation results are compared with the theory of Brandt and Mikitik: simulation of a REBCO strip with an aspect ratio of 20 shows good agreement with theory, while the simulation of a REBCO stack shows slow decay.
Most previous simulation works have investigated the demagnetization process of superconducting bulks or stacks by using simplified 2D cross section models with small aspect ratios. In these models two main assumptions are made to simplify the calculation: (i) an infinitely long superconducting tape; and (ii) thick superconducting layer having small aspect ratios. The real aspect ratio of coated conductor can reach as high as 12000 and the resulting mesh will make the simulation work cumbersome and time-consuming. In our simulation, the first assumption is also used for simplifying the calculation. However, our research shows that the magnetic interaction between tapes will largely affect the demagnetization rate. Therefore, the real geometry of superconductors is taken into consideration in our simulation. Furthermore, our research shows that the magnetic field dependence of critical current density is important in accelerating the demagnetization process, thus it is also taken into account in our
model by using the experimentally measured
I B
c( , )
.This paper reports our latest study for vortex shaking on REBCO stacks. We studied how the magnetic interaction between tapes and the anisotropic characteristics affect vortex shaking. The paper is organized in the following way. In section 2, the experimental system and test procedures are presented in detail. Section 3 introduces the proposed simulation. Section 4 compares the simulation and experimental results. In Section 5 the phenomena observed in experiment are discussed with the model. Section 6 studies the impact of frequency on the vortex shaking process of REBCO stacks. Finally, the conclusions are summarized in Section 7.
2. Experiment setup
Table 1 Specification of the superconducting tape
Copper stabilizer [µm] 40
Silver layer [µm] 4
(RE)BCO-HTS layer [µm] 1
Buffer layer [µm] 0.2
Substrate layer [µm] 50
Table 2 Hall sensor parameters
Overall dimension [mm]
7 5 1
Magnetic field range [T]
5
Sensitivity at 20 mA [mV/T] 94
Active area [mm2] 0.05
The temperature range [K] 1.5-350
The experiment setup is shown in Figure 1 (a). A 2-pole copper electromagnet (henceforth, electromagnet) produces both perpendicular and crossed magnetic fields to the sample, with magnetic field waveform shown in Figure 2. An NI SCXI-1125 data acquisition card (DAQ) records both the trapped magnetic field and the electromagnet current. The Hall sensor, at the top center of a test sample stack, is bolted to the G10 cube, as shown in Figures 1 (c) and (d). The distance between the test sample and Hall sensor active area is 0.35 mm. Finally, the G10 shelf (Figure 1 (c)) is placed in the G10 container (Figure 1(b)) with a square groove in the bottom G10 plate that affixes the bar, as shown in Figure 1 (b). During the experiment, the G10 container is continuously filled with liquid nitrogen to provide a constant temperature environment (77 K) for the experiment sample. Furthermore, the test sample is always placed in the electromagnet center to ensure that a magnetic field is uniform over the test sample.
(a)
Power supply 2
DC power supply 1
DAQ Copper electromagnet
Experiment samples Hall
probe
(b) (c) (d)
Figure 1 Experimental setup: (a) Schematic diagram of the experiment platform; (b) G10 container; (c) G10 shelf; (d) arrangement of the experiment sample and Hall sensor, represented by a gray rectangle. (Note: Hall sensor active area always faces the test sample center and the G10 cube is always immersed in liquid nitrogen during the experiment.)
In the experiment, a 1/30-Hz magnetic field not only magnetizes the test sample but also shakes its magnetic field. In the experiment, the test sample is firstly cooled down to 77 K and then placed parallel to the electromagnet pole face to magnetize the test sample with a 500 mT ac field in the c-axis. Subsequently, the external magnetic field is removed for 40 s to enable the trapped magnetic field to stabilize. Finally, the test sample, rotated 90° horizontally,
is subjected to a crossed AC magnetic field
0H
ab (with amplitude 25, 50, 100, 200 or 300 mT) for 50 continuous cycles for demagnetization.0 5 10 15 20 25 30
0 100 200 300
ab
(m
T
)
Time (s)
Figure 2 Illustration of magnetic field waveform generated by the DC electromagnet, with field amplitude 300 mT and frequency 1/30 Hz.
3. Introduction to simulation model
We made several assumptions in our simulation: (1) the test samples are simulated with 2D cross-section models by neglecting the edge effects, and, to save computation time, (2) a 100-Hz triangle waveform frequency, instead of a 1/30 Hz actual frequency. The reason for a higher frequency being used in the simulation is that, based on Brandt
Hall sensor Sample stack
G10 cube G10 shelf
[image:4.612.82.326.390.589.2]and Mikitik theory, the frequency has negligible impact to the relaxation cycle of the trapped magnetic field in superconducting stacks. However, to further validate the conclusion, it is further discussed in Section 6 based on both simulation and experiment. Based on the above assumptions, 2D cross-section models are built for the test samples introduced in Section 2 [29, 30]. The 2D model is based on H formulation (Equation 1) and the E-J power law (Equation 2). Only the superconducting layer is simulated in the model, where its real thickness (1 µm) is used.
(
)
(
)
0
H
H
t
(1)(n 1)
z z
z z c
c c
J
J
E
J
E
J
J
(2)Where
is magnetic permeability,
is electric resistivity,E
c is 1 µV/cm,J
c is the critical current density of superconductor, n is the superconductor index.To take into consideration the magnetic field dependence of critical current density and superconductor index, we
measure the critical current of a 10-cm long REBCO sample as functions of angle
for selected values of field strength, the results of which are shown in Figure 3 and 4.As shown in Figure 3, when the external magnetic field is lower than 100 mT, there is critical current peak in the ab plane angle (H//ab), however, when the external field increase above 100 mT, the ab-plane angular peak weakens gradually and a c-axis angular peak appears. This c-axis angular peak might be caused by the artificial pinning centers. Previous research shows that the introduction of nanoparticles such as BaZrO3 [31], Y2BaCuO5 [32] into
YBCO films could results in artificial pinning centers with strong pinning forces, thus greatly increasing the in-field critical current density [33]. This technology is introduced in the manufacturing of SuperPower tapes[34], which is where the experimental tape from, therefore the c-axis peak in high external field is reasonable.
After obtaining the critical current of superconductor under external magnetic field of different amplitudes and
angles (
I B
c(
norm, )
), the critical current density is derived based on Equation (3).(
, )
(
, )
c normc norm
I B
J B
wd
(3)Where
B
norm is the amplitude of external magnetic field,
is the angle of external magnetic field, as shown in Figure 3 (b),w
andd
are the width and thickness of superconductor respectively.To include the
J B
c(
norm, )
into the simulation model, a two-variable interpolation method is used [35]. In this method, the measuredJ B
c(
norm, )
can be incorporated into the model with the interpolation function in COMSOL, with two input variableB
norm and
and one output variableJ
c. This method avoids the complicated data fitting and takes advantage of the experimental data directly.Similarly, the magnetic field dependence effect of the index
n B
(
norm, )
(Figure 4), which is also function of applied field magnitude and orientation [36], is taken into account in the simulation with the same method for-90 0 90 180 270 0
100 200 300 400 500
H//ab
H//c 0 mT
10 mT 20 mT 40 mT 60 mT 100 mT 200 mT 300 mT 500 mT 700 mT
C
rit
ic
al
current
(A)
Angle (°)
H//ab H//c
(a) (b)
Figure 3 (a) measured critical current density of a 10-cm long REBCO sample vs. field angle plots at selected external field; (b) schematic diagram of superconductor in external magnetic field.
-90 0 90 180 270
5 10 15 20 25
30 0 mT 10 mT
20 mT 40 mT 60 mT 100 mT 200 mT 300 mT 500 mT 700 mT
n
[image:6.612.76.500.75.323.2]Angle(°)
Figure 4 measured superconductor index of a 10-cm long REBCO sample vs. field angle plots at selected
external field
In the simulation, an AC magnetic field
0H
//c with amplitude 500 mT is applied along the c-axis for 1 cycle firstly to magnetize the superconductor, then the external magnetic field is removed for 40 s to enable the trappedmagnetic field to stabilize, and finally an AC parallel field
0H
ab is applied in the transversal direction of the test sample for 50 cycles.
x
y
[image:6.612.89.366.384.592.2]Since 2D cross section model of superconductor is used, where the end effect is neglected, current flows in the direction perpendicular to the cross section only. Furthermore, considering the current generated in superconductor are all magnetization current and there is no current exchange between superconducting layers in a stack, the total current in the cross section of each superconducting layer should be zero. To constrain the total current in the cross section of each superconducting layer to be 0, pointwise constraint of COMSOL is applied to each tape in the stack
by integrating current density Jz across the cross section of each superconductor layer so that
I
i
J ds
z i
0
,where Si is the cross-section area of the i-th tape and Ii is the total current in the i-th tape[37, 38].
In addition, both the external magnetic fields in the c-axis and that in the ab plane are applied to the superconducting stack by using dirichlet boundary conditions in the model[39, 40]. The definitions of Hx and Hy in the boundaries are
shown in Equation 4 and 5 respectively.
0
,0
40 1/
, 40 1/
40 51/
x
ab
t
f
H
H
f
t
f
(4),0
1/
0
,1/
40 51/
c y
H
t
f
H
f
t
f
(5)where f is the frequency of external magnetic field, which is 100 Hz.
H
c andH
ab correspond the external magnetic field in the c-axis and in the ab plane respectively.
Figure 5 Illustration concerning the meshing of 3-tape stack: for the meshing of superconductor, mapped mesh is used, with element number in width direction 70 and in thickness direction 3; for the meshing of air space, free triangular mesh is used.
4. Comparison of experimental and simulation results
We tested the demagnetization process of the three test samples (stacks with 1, 3 and 5 tapes) under different crossed magnetic field ( with amplitude equaling 25, 50, 100, 200, 300 mT), measuring the trapped magnetic fields of each sample as shown in Figures 6 and 7. Figure 6, where trapped field, µ0Hy, is normalized to the initial value,
µ0Hy0, shows Hy/Hy0 vs. cycle data from the 1st shaking cycle to the 50th cycle. Because the 1st shaking cycle
removes trapped field much more dramatically than in the subsequent cycles, Figure 7, where µ0Hy is normalized to
the trapped field after the first shaking cycle, µ0Hy1, presents Hy/Hy1 vs. cycle data from the 2nd cycle to the 50th
cycle. As shown in Figure 8, the more tapes in the stack, the less trapped field declines.
Meanwhile, corresponding simulation works were also carried out based on the model proposed. The
J B
c(
norm, )
shown in Equation 3 is taken into consideration to get more accurate results. In the simulation with 1-tape stack, the thickness is meshed into 7 elements, while for 3-tape stack and 5-tape stack the thickness is meshed into 3 elements for saving computation time.
It is worth noting here that our 2D model can provide qualitatively agreeable results with those of experiments. The discrepancy between experimental and simulation results are mainly because the model neglects the end effect. In the experiment, a current loop is generated in the ab-plane when the superconductor is magnetized in the c-axis direction. Therefore, when a magnetic field in the ab plane of superconductor is applied, both crossed and longitudinal shakings are generated [15-17]. However, based on the assumption of infinite length of superconductor, only the crossed shaking process can be simulated in our model.
In the experiment, the trapped magnetic fields µ0Hy of 1-tape, 3-tape and 5-tape stack in the beginning of shaking
are 25, 80 and 112 mT respectively, which are measured by the hall sensor shown in Figure 1(d). Considering it is difficult to compare the demagnetization processes of different stacks, the normalized values are used for comparison, as shown in Figure 6, 7 and 8. By comparing the experimental and simulation results in Figure 6, 7, and 8, we may make the following observations;
The 1st shaking cycle results in a sharp decline of the trapped field and the size of this decline increases
with crossed magnetic field (Figure 6).
After the 1st cycle, the trapped field (H
y/Hy1) decays faster with crossed magnetic field (Figure 7).
[image:8.612.98.513.73.186.2]0 10 20 30 40 50 60 0.0
0.2 0.4 0.6 0.8 1.0
Sim-25 mT Sim-50 mT Sim-100 mT Sim-200 mT Sim-300 mT Exp-25 mT Exp-50 mT Exp-100 mT Exp-200 mT Exp-300 mT
H y /H y0
Cycle 1-tape stack
(a)
0 10 20 30 40 50
0.0 0.2 0.4 0.6 0.8 1.0
H y /H y0
Cycle
Sim-25 mT Sim-50 mT Sim-100 mT Sim-200 mT Sim-300 mT Exp-25 mT Exp-50 mT Exp-100 mT Exp-200 mT Exp-300 mT 3-tape stack
0 10 20 30 40 50 0.0
0.2 0.4 0.6 0.8 1.0
Sim-25 mT Sim-50 mT Sim-100 mT Sim-200 mT Sim-300 mT Exp-25 mT Exp-50 mT Exp-100 mT Exp-200 mT Exp-300 mT
Hy
/Hy0
Cycle 5-tape stack
(c)
Figure 6 Comparison of the demagnetization processes for three test samples at selected crossed magnetic fields
(with
0H
abmax 25, 50, 100, 200, 300 mT), plotted as Hy/Hy0 vs. cycle, where trapped field, µ0Hy, is normalized tothe initial value, µ0Hy0: (a) Experimental and simulation results of 1-tape stack, (b) Experimental and simulation
results of 3-tape stack, (c) Experimental and simulation results of 5-tape stack. Note: the experimental results shown here corresponds the shaking processes from 1st to the 50th cycle. ‘Exp’ and ‘Sim’ means experimental and
simulation results respectively.
0 10 20 30 40 50
0.0 0.2 0.4 0.6 0.8 1.0
Sim-25 mT Sim-50 mT Sim-100 mT Sim-200 mT Sim-300 mT Exp-25 mT Exp-50 mT Exp-100 mT Exp-200 mT Exp-300 mT
Hy /Hy1
Cycle 1-tape stack
[image:10.612.80.374.75.324.2]0 10 20 30 40 50 0.5
0.6 0.7 0.8 0.9 1.0
H y /H y1
Cycle
Sim-25 mT Sim-50 mT Sim-100 mT Sim-200 mT Sim-300 mT Exp-25 mT Exp-50 mT Exp-100 mT Exp-200 mT Exp-300 mT 3-tape stack
(b)
0 10 20 30 40 50
0.6 0.7 0.8 0.9 1.0
H y /H y1
Cycle
Sim-25 mT Sim-50 mT Sim-100 mT Sim-200 mT Sim-300 mT Exp-25 mT Exp-50 mT Exp-100 mT Exp-200 mT Exp-300 mT 5-tape stack
[image:11.612.59.370.75.583.2](c)
Figure 7 Comparison of the demagnetization processes for three test samples under selected crossed magnetic fields
0
H
ab
(with amplitudes of 25, 50, 100, 200, 300 mT), plotted as Hy/Hy1 vs. cycle, where trapped field, µ0Hy, isnormalized to the trapped magnetic field after the first shaking cycle, µ0Hy1: (a) Experimental and simulation results
0 10 20 30 40 50 0.5
0.6 0.7 0.8 0.9 1.0 1.1
H y /H y1
Cycle
[image:12.612.89.345.78.294.2]Sim-1-tape Sim-3-tape Sim-5-tape Exp-1-tape Exp-3-tape Exp-5-tape
Figure 8 Normalized demagnetization data (Hy/Hy1) vs. cycle under crossed magnetic field with amplitude 200 mT
for three test samples: simulation and experimental results.
5. Analysis of demagnetization data 5.1 1st-cycle trapped field decline
As shown in Figure 6, the 1st shaking cycle produces a distinct decline in the trapped field, and the effect is more
profound with the increase of shaking field.
To analyze this phenomenon, we applied our 2-D simulation model to the 1-tape stack, with three cases of critical
current density taken into consideration--
J B
c(
0, )
(self-field critical current density),J B
c( , )
(critical current density that is function of both magnetic field amplitude and angle
, as shown in Figure 3) and( ,
0)
c
J B
(critical current density that is function of external magnetic field amplitude only). For(
0, )
c
J B
, the magnetic field dependence effect of critical current density is totally neglected, this is the case considered in the Brandt and Mikitik theory. ForJ B
c( , )
, both the impact of external magnetic field amplitude and direction to the critical current density is taken into account, which is expected to provide the most accurate-1 0 1 2 3 4 0.0
0.2 0.4 0.6 0.8 1.0 1.2
Experiment
Sim-Jc(B, )
Sim-Jc(B=0,)
Sim-Jc(B,)
H y /H y0
Cycle
Figure 9 Hy/Hy0 vs. cycle plots, experiment and simulation, for the 1-tape stack subjected to a 300-mT crossed
magnetic field. (Note: three simulation results are given, which corresponds
J B
c( , )
,J B
c(
0, )
,( ,
0)
c
J B
respectively)Figure 9 shows Hy/Hy0 vs. shaking cycle plots, simulation and experiment, for the 1-tape stack subjected to a
300-mT crossed magnetic field. When
J B
c(
0, )
is used in the simulation, there is no trapped magnetic field drop in the first cycle. However, when the magnetic field dependence effect is considered by usingJ B
c( , )
, distinct drop in the trapped magnetic field in the first half shaking cycle is observed, which indicates the magnetic field dependence effect plays an important role in the distinct drop. However, it is still unknown whether the drop is caused by the magnetic field amplitude dependence of Jc or the angular dependence of Jc. To figure out this question,the
J B
c( ,
0)
is used in the model by neglecting the effect of
, which produce approximately the same results with that whenJ B
c( , )
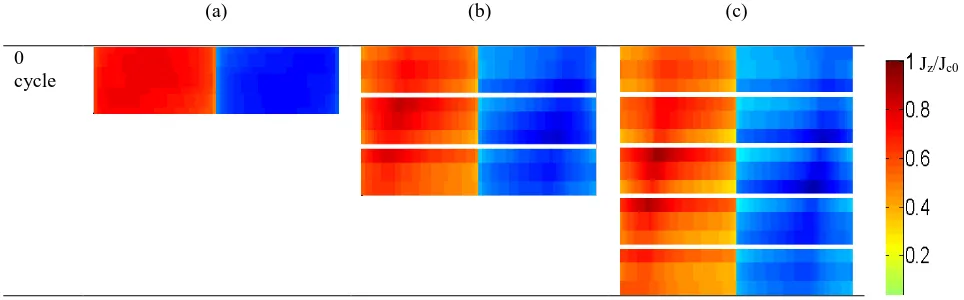
is used. Therefore, it is derived that the drop of trapped field is mainly because of the dependence of Jc on the external magnetic field amplitude.To get a deep understanding concerning the impact of magnetic field, the current density distribution of superconductor in the first half shaking cycle in these different simulation cases are compared in Figure 10, where the current density is normalized to the self-field critical current density Jco (3.725e10 A/m2). Considering the huge
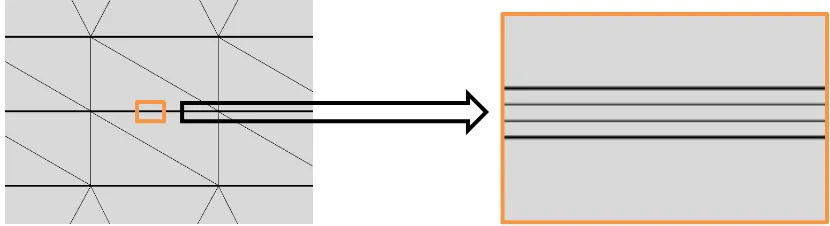
width/thickness ratio (12000:1) used in the model makes it difficult to observe the distribution of current density, the current density distribution is visually enlarged by 3000 in thickness direction to make it easy to observe, as shown in Figure 10. Similarly, the same visual enlargement is used for all the remaining current density and magnetic field distribution graphs in this paper.
As shown in Figure 10, in the beginning of shaking the current densities in both cases are nearly the same and both are lower than the critical current density Jc0. However, with the increase of the applied cross field, the current
density distributions in the two cases show different characteristics. In the simulation with constant Jc, there is an
[image:13.612.87.352.69.294.2]because, although the current distribution changed dramatically, the current that was used for generating the trapped magnetic field does not decrease. The current redistribution can be explained with the generation of shielding current in the superconducting layer, which tends to prevent the penetration of the crossed magnetic field.
For the simulation with
J B
c( , )
, the current density decreases dramatically with the increase of cross field. This can be attributed to the magnetic field dependence of critical current density (Figure 3). Large cross field magnitude applied resulted in the decrease of critical current density in superconductor, leading to the decay of the trapped field. A similar phenomenon is also observed in the simulation of the 3-tape stack and the 5-tape stack, while consideringthe
J B
c( , )
characteristics respectively, as shown in Figure 11.Furthermore, based on the above analysis, it is easy to understand why the sudden decay of trapped field increases with the increase of crossed magnetic field. With the increase of crossed magnetic field the critical current density
decreases much further based on
J B
c( , )
(Figure 3), which eventually leads to less current in the superconductor and thus lower trapped magnetic field.(a)
J B
c(
0, )
(b)J B
c( , )
0 cycle
0.2 cycle
0.4 cycle
0.5 cycle
0.0 0.2 0.4 0.6 0.8 1.0 0
50 100 150 200 250 300 350
ab
(m
T
)
Cycle
0.2 cycle 0.4 cycle
0.5 cycle
0 cycle
(c) (d)
Figure 10 Current density distribution in the superconductor cross section of 1-tape stack in the first half shaking cycle under crossed magnetic field with magnitude of 300 mT: (a) simulation results with Jc; (b) simulation results
with
J B
c( , )
.(c) cross field waveform in the first cycle, where the time of each graph in (a) and (b) is pointed out; (d) illustration of the widthw
and thicknessd
of the superconductor cross section. For Figure (a) and (b), normalized current density is used, where Jc0 is the self-field critical current density 3.725e10 A/m2. (Note:considering the thickness of superconducting layer used in the model is 1 µm only, which make it difficult for readers to compare the data if the real aspect ratio (12000:1) is used, therefore, for all graphs that presenting the magnetic field and current density distribution in this paper, the superconductor thickness is visually enlarged by 3000.)
(a) (b) (c)
0
cycle Jz/Jc0
w
[image:15.612.65.547.481.631.2]
0.2 cycle
0.4 cycle
[image:16.612.65.499.71.432.2]0.5 cycle
Figure 11 Current density distribution in the superconductor cross sections of 1-tape, 3-tape and 5-tape stack in the first half shaking cycle under crossed magnetic field with magnitude of 300 mT: (a) simulation results of 1-tape
stack with
J B
c( , )
; (b) simulation results of 3-tape stack withJ B
c( , )
; (c) simulation results of 5-tape stack withJ B
c( , )
.5.2 Impact of cross field amplitude to demagnetization rate
As analyzed in Section 4, the trapped field (Hy/Hy1) decays faster with the increase of the crossed field (Figure 7).
Based on the Brandt and Mikitik theory [15, 16], the application of a crossed magnetic field upon a magnetized superconductor tilts the vortices in the superconductor periodically. This periodic tilt leads to the shift of vortices, which generates DC electric field in the superconductor. Due to the generation of the DC electric field, the current as well as the trapped field in superconductor will decay gradually.
Concerning the impact of cross field amplitude upon the demagnetization of superconductor, the analytical equation concerning 1-tape stack in Brandt and Mikitik theory [15, 18] can provides detailed understanding for this phenomenon.
Based on Equation 6, the DC electric field generated in the superconductor is proportional to the amplitude of
increase the electric field generated in superconductor. Base on Brandt and Mikitik theory, higher electric field generated in the superconductor will result in more decay of the current as well as the trapped magnetic field.
Furthermore, Equation 7 [15] might provide more direct explanation and leads to clear conclusion. The increase in
cross magnetic field amplitude (h) leads to decrease of critical current density (
j
c ). The change of both parameters will decrease the relaxation time
.14
( )
(
/ )
o/
c8.4 10
c
hJ
E J
dh
J
J
J
(6)1
2
2
2
622.28
1 10
c c
c c c
d
h
J
h
j d
h
w
J
w
j
j
(7)Here,
w
and d are the half width and the thickness of superconductor, which are 6 mm and 1µm respectively, h isthe amplitude of crossed magnetic field,
ois the vacuum permeability,
is the relaxation time, constant
=0.6386,
=2
f
is the angular velocity, with f equals 1/30 in the experiment,J
c andj
c are the critical sheet current density and the critical current density, which are function of external magnetic field.For the stacks with more than one tape, the same explanation also applies. When each tape in a stack is considered separately, the larger the cross field is, the more the vortices tilts, therefore the generated DC electric field is higher and the demagnetization is faster. However, there are some differences between the trapped magnetic fields in stacks with different tape numbers, which is discussed in Section 5.3.
5.3 Impact of tape number to demagnetization rate
Another important phenomenon observed is that the trapped field decay slower with the increase of tape numbers (Figure 8) after the 1st shaking cycle. Considering the magnetic field interaction between tape in stack with more
than 1 tape, the crossed magnetic field might be screened out in the top/bottom several layers, hence leading to the slow or even little demagnetization in the central layers.
To verify this assertion, the in-plane magnetic fields experienced by different layers of 5 tape stack during the one shaking cycle are extracted and shown in Figure 12. Here the in plane magnetic field experienced by a
superconductor (
0
0
H
( , )x t
) is defined as the parallel magnetic field difference between the time t0 and the start ofthe shaking cycle, as shown in Equation 8.
0 0
0
H
( , )x t 0H
( , )x t 0H
( ,x nT)
(8) [image:17.612.123.494.174.254.2]Where
nT
t
0(
n
1)
T
, T is the period and n means the n-th shaking cycle.Figure 12 compares the parallel magnetic field experienced by the 1st, 2nd and 3rd superconductor in different time of
the 29th shaking cycle. Comparisons in (a) (b) and (c) shows that the cross magnetic field experienced by the 1st tape
is higher than that of the 2nd tape, which again is higher than that of the 3rd tape (middle tape in (d)). These
0 3 6 9 12 80
84 88 92 96
H (x,
29
.2
5T
)
(m
T
)
Y (mm)
1st tape 2nd tape 3rd tape
(a)
0
H
( ,29.25 )x T0 3 6 9 12
180 184 188 192 196 200
H (x,
29
.5
T
)
(m
T
)
Y (mm)
1st tape 2nd tape 3rd tape
0 3 6 9 12 90
93 96 99 102
H (x,
29
.7
5T
)
(m
T
)
Y (mm)
1st tape 2nd tape 3rd tape
(c)
0
H
( ,29.75 )x T [image:19.612.72.327.79.458.2](d)
Figure 12 Comparison of parallel magnetic field
0
H
x experienced by different layers of 5-tape stack in the 29thcycle: (a) the parallel magnetic field experienced by superconductor at time of 29.25T; (b) the parallel magnetic field experienced by superconductor at time of 29.5T; (c) the parallel magnetic field experienced by superconductor at time of 29.75T. In the figures, ‘1st tape’, ‘2nd tape’ and ‘3rd tape’ corresponds the first, second and third tape of 5
tape stack counted from bottom to the top, as shown in (d). The in plane magnetic field extracted in (a) (b) and (c) corresponds the parallel magnetic fields in the horizontal centerline of superconductor cross section, as shown in the red line of each tape in figure (d).
Furthermore, this phenomenon might also be associated with the current density distribution during shaking. Figure 13 indicates the comparison of current density distribution of 1-tape, 3-tape and 5-tape stacks in the 29.5-cycle. It is shown that the current density in the right/left half of superconductors is far from uniform. The current density magnitude at the upper left corner and the lower right corner of stack is higher than that in other areas.
The non-uniform current density distribution is mainly because of the interaction between externally applied crossed magnetic field and generated magnetic field of stack. The application of cross field to the stacks’ original self-field will result in lower magnetic self-field in the upper left corner and lower right corner, and higher magnetic self-field in the upper right corner and lower left corner, as shown in Figure 14. Based on the magnetic field dependence of critical current density, the higher the magnetic field applies, the lower the critical current density is. Therefore, current density in the upper left corner and lower right corner of the stack will be higher.
5
thtape
4
thtape
3
rdtape
2
ndtape
Based on the Brandt and Mikitik theory, higher Jc will lead to lower demagnetization rate. From Figure 13, the more
the tape number in stack, the more current are concentrated in the area with high critical current density (upper left corner and lower right corner). Therefore, for stacks with more tapes, the trapped field decay will be slower.
(a) (b) (c)
29.5 cycle
Figure 13
Simulated
current density (Jz/Jc0) distribution at 29.5 cycle in 1-tape, 3-tape and 5-tape stack undercrossed magnetic field with amplitude 200 mT: (a) simulation of 1-tape stack with
J B
c( , )
; (b) simulation of 3-tape stack withJ B
c( , )
; (c) Simulation of 5-tape stack withJ B
c( , )
.(a) (b) (c)
[image:20.612.81.535.122.310.2]29.25 cycle
Figure 14 Simulated parallel magnetic field distribution (µ0Hx/0.3) at 29.25T in 1-tape, 3-tape, 5-tape stack under
crossed magnetic field with amplitude 200 mT: (a) simulation of 1-tape stack with
J B
c( , )
; (b) simulation of 3-tape stack withJ B
c( , )
; (c) simulation of 5-tape stack withJ B
c( , )
.6. Impact of frequency to the demagnetization process
The impact of frequency to the demagnetization process is investigated both with simulation and experiment. In the simulation, the demagnetization process of 3-tape stack under crossed magnetic field of 40, 100 and 500 Hz are
simulated by considering the magnetic field dependence of critical current density
J B
c( , )
. In the experiment, the demagnetization process of 3-tape stack under crossed magnetic fields of 1/10, 1/30 and 1/60 Hz are studied. µ0Hx/0.3 [image:20.612.79.544.374.569.2]Simulation and experimental results are shown in Figure 15 and Figure 16 respectively. Both results show that the decay curves of the trapped magnetic fields under cross fields of different frequencies are approximately the same. As shown in Figure 16, there are small fluctuation in the demagnetization process of the trapped magnetic field under cross magnetic field of 1/10 Hz, especially for 200mT and 300mT. This phenomenon is mainly due to the property of the power supply, which cannot produce very stable triangular waveform under high frequency of 1/10 Hz, leading to the unstable demagnetization of trapped magnetic field.
0 10 20 30 40 50
0.5 0.6 0.7 0.8 0.9 1.0
40 Hz 100 Hz 500 Hz
H y /H y1
[image:21.612.89.341.172.381.2]Cycle
Figure 15 Simulated demagnetization process of 3-tape stack under crossed magnetic field with amplitude 200 mT and with frequencies 40, 100, 500 Hz
0 10 20 30 40 50 60
0.5 0.6 0.7 0.8 0.9 1.0
100mT-10s 100mT-30s 100mT-60s 200mT-10s 200mT-30s 200mT-60s 300mT-10s 300mT-30s 300mT-60s
H y /H y1
Cycle
[image:21.612.84.371.441.659.2]These results agree well with the Brandt and Mikitik theory, which proves that the relaxation cycles have no relevance with the frequency of shaking magnetic field, as shown in Equation 9 [15, 28]. Therefore, it is reasonable to simulate the vortex shaking process of crossed magnetic field with a higher frequency of 100 Hz, instead of the actual frequency of 1/30 Hz.
3
0
1.5 10
1.28
(
)
p p
T p T p
wB
B
n
d B
B
B
B
(9)Where
n
0 is the characteristic number of cycles for the exponential demagnetization, Bp is the crossed penetrationfield and BT is the applied crossed field
7. Conclusions
In this paper, the demagnetization processes of three stacks samples (with 1, 3 and 5 tapes respectively) under different crossed magnetic fields (with amplitudes of 25, 50, 100, 200 and 300 mT) were studied both experimentally and numerically. 2D cross section models are built to simulate the demagnetization process, where both the real thickness and the anisotropy characteristics of superconductors are taken into consideration. Qualitative agreement has been achieved between experiment and simulation. Based on these qualitative agreements, some valuable conclusions are made, as shown below:
Due to the magnetic field dependence of the critical current density, there is a sudden decline of the trapped magnetic field in the first half shaking cycle. This decline gradually increases with crossed magnetic field amplitude.
The demagnetization rate increases with the crossed field amplitude, which can be attributed to the enhanced vortex shaking.
The slower demagnetization with tape number increase is mainly due to the cross magnetic field being screened by the top and bottom stacks during the shaking process. Furthermore, the non-uniform current density distribution will also contribute to this process.
The impact of frequency to the demagnetization process is also studied with both experiment and simulation, both of which show that frequency has little impact on the demagnetization process of superconducting stacks.