City, University of London Institutional Repository
Citation
:
Van der Molen, M. J., Henry, L. and Van Luit, J. E. H. (2014). Working memory development in children with mild to borderline intellectual disabilities. Journal of Intellectual Disability Research, 58(7), pp. 637-650. doi: 10.1111/jir.12061This is the unspecified version of the paper.
This version of the publication may differ from the final published
version.
Permanent repository link:
http://openaccess.city.ac.uk/3821/Link to published version
:
doi: 10.1111/jir.12061Copyright and reuse:
City Research Online aims to make research
outputs of City, University of London available to a wider audience.
Copyright and Moral Rights remain with the author(s) and/or copyright
holders. URLs from City Research Online may be freely distributed and
linked to.
Working memory development in children with mild to borderline intellectual
disabilities
2
Abstract
Background The purpose of the current cross-sectional study was to examine the developmental progression in working memory (WM) between the ages of 9 and 16
years in a large sample of children with mild to borderline intellectual disabilities
(MBID). Baddeley’s influential WM model was used as a theoretical framework.
Furthermore, the relations between working memory on the one hand, and scholastic
skills (arithmetic and reading) on the other were examined.
Method One-hundred-and-ninety-seven children with MBID between 9 and 16 years old participated in this study. All children completed several tests measuring
short-term memory, working memory, inhibition, arithmetic and single word reading.
Results WM, visuo-spatial short-term memory and inhibition continued to develop until around age 15 years. However verbal short-term memory showed no
further developmental increases after the age of 10 years. Verbal short-term memory
was associated with single word reading, whereas inhibition was associated with
arithmetic.
Discussion The finding that verbal short-term memory ceases to develop beyond the age of 10 years in children with MBID contrasts with results of studies involving
typically developing children, where verbal short-term memory develops until around
age 15 years. This relative early developmental plateau might explain why verbal
short-term memory is consistently considered weak in children with MBID.
Keywords: intellectual disabilities, short-term memory, working memory, inhibition,
3
Introduction
Although there is a substantial literature on how short-term memory (STM) and
working memory (WM) develop with age in typical children (e.g. Alloway et al.,
2006; Gathercole et al., 2004a), there is very little work tracking such developmental
changes in children with mild to borderline intellectual disabilities (MBID; IQ score
50-85). The purpose of the current cross-sectional study was to examine a large
sample of children with MBID from a wide age range to determine how STM and
WM develop. We hoped this would further our understanding of why children with
MBID perform below their mental age levels in some aspects of STM and WM. We also examined how various aspects of STM and WM are related to important
scholastic abilities, adding to the limited research evidence in this area.
The starting point for this work was existing cross-sectional research on STM
and WM in participants with MBID. Although this work has focused almost
exclusively on samples of individuals with MBID with restricted age ranges, findings
have shown consistent short-term memory (STM) and working memory (WM) delays
compared to chronological age matched typically-developing children (CA control
group; Alloway, 2010; Hasselhorn & Maehler, 2007; Henry, 2001; Henry &
MacLean, 2002; Schuchardt et al., 2010; Van der Molen et al., 2007; 2009). This is
not surprising considering that children with MBID have younger mental ages than
CA control children. However, more noteworthy is that delays on some types of STM
and WM tasks have been reported in children with MBID compared to younger
typically-developing mental age matched children (MA control group; Henry &
MacLean, 2002; Henry & Winfield, 2010; Van der Molen et al., 2007; 2009). This
suggests that at least some aspects of STM and / or WM are characterised by
4
memory problems are of particular concern because STM and WM are important
factors contributing to multiple scholastic abilities such as reading and arithmetic
(Henry & Winfield, 2010; Van der Sluis et al., 2004).
In terms of theoretical approaches, one generally accepted view is that the
cognitive abilities of people with non-organically (or non-detectable organically)
based intellectual disabilities (true for most children with MBID, see Heikura et al.,
2005), fall at the lower end of the normal distribution. On this account, cognitive
abilities in children with MBID should develop along a broadly comparable trajectory
to that of typically-developing children, but at a slower rate. A further prediction of
this account is that cognitive abilities in children with MBID are expected to plateau
at a lower level than in the typically developing population (Bennet-Gates & Zigler,
1998). The first aim of the present study was, therefore, to explore if and how STM
and WM developed in a cross-sectional sample of children with MBID between the
age of 9 and 16 years.
The theoretical framework for this research was Baddeley’s working memory
model (Baddeley, 2007), which is frequently used to explain and explore STM and
working memory WM in populations of children with and without developmental
disorders, including those with MBID (e.g. Henry, 2012). This model comprises four
components: (1) a phonological loop to temporarily hold and maintain verbal
information, with an accompanying automatic rehearsal component that prevents
information from fading away; (2) a visuo-spatial sketchpad to temporarily hold and
maintain visual and spatial information; (3) a central executive which functions as an
attentional control system by focusing, directing and switching attention (this system
is hypothesised to be involved in a range of ‘executive’ functions relevant for
5
response inhibition – here we focused on executive-loaded working memory and
response inhibition); and (4) an episodic buffer, a multidimensional storage system
that binds information from different sources into a coherent experience (Baddeley,
2000). In the current terminology, STM is represented by the phonological loop
(verbal STM) and the visuo-spatial sketchpad (visuo-spatial STM) while WM refers
to the capacity to simultaneously store and manipulate information over brief periods
of time, i.e. on memory tasks with a ‘central executive’ load.
Several studies have focussed on the development of STM and WM in typically
developing children. The results regarding verbal STM are mixed. Some have
reported improvements until around 11 years (Alloway et al., 2006), after which
verbal STM performance levels off; whereas others have reported a more extended
period of development up to around 15 years (Conklin et al., 2007; Gathercole et al.,
2004a). Turning to visuo-spatial STM, a distinction is generally made between visual
STM and spatial STM. Research on spatial STM has provided evidence of a linear
improvement from 4 to 10 years (Pickering et al., 2001), levelling off at around 15
years (Farrell Pagulayan et al., 2006; Gathercole et al., 2004a; Luciana et al., 2005),
although note that one study found that spatial STM stabilized somewhat earlier at
around 12 years (Conklin et al., 2007). Visual, or static, STM seems to plateau
somewhat earlier than spatial, or dynamic, STM, at around 11 years (Gathercole et al.,
2004a).
For the more complex skill of WM, which requires executive control to
co-ordinate both processing and storage concurrently, somewhat longer developmental
trajectories might be predicted. Most studies have reported that WM develops linearly
from 4 to 10 years, levelling off at around 15 years (Conklin et al., 2007; Gathercole
6
but there is some evidence for a more protracted development in WM - up until age
20 (for visual WM; Hamilton et al., 2003) or even age 45 (for visual and verbal WM;
Swanson; 1999). In the current data set, we also had the opportunity to look at
response inhibition, another function ascribed to the central executive component of
Baddeley’s working memory system (Baddeley, 1996). In terms of previous research
on typical children, the development of response inhibition may reach its asymptotic
level at around age 7 years (Gerstadt et al., 1994) or around late adolescence /
beginning young adulthood (Huizinga et al., 2006; McAuley & White, 2011; although
in this study, the developmental changes disappeared when corrected for processing
speed; Williams et al., 1999). Nevertheless, there is also research showing that
inhibition performance may plateau by the age of 10 years (Welsh et al., 1991;
Klenberg et al., 2001, Lehto et al., 2003). As such, the developmental time course for
improvements in inhibition shown by typical children remains unresolved in the
literature.
Although findings regarding the development of STM, WM and inhibition in
typical children are not entirely consistent, it does seem that STM and WM develop at
least until around age 15 years. Note, however, that the only study on visual STM
indicated that this construct may level off earlier at around age 11 years and some
studies show a levelling off at age 10-11 years for verbal STM and inhibition.
Although there is no existing work that focuses specifically on the
developmental trajectories of STM and WM in children with MBID, there is some
relevant work that points to areas of relative strength and weakness. For example,
many studies have found that verbal STM is particularly vulnerable in children with
MBID. Performance levels on measures such as digit span and / or word span in
7
studies (Bayliss et al., 2005; Henry & MacLean, 2002; Henry & Winfield, 2010;
Russell et al., 1996; Schuchardt et al., 2010; Van der Molen et al., 2007; 2009). One
exception was a study by Hasselhorn and Mähler (2007) who found no difficulties
relative to mental age on verbal STM in 10-year-old children with MBID. Henry
(2001) also pointed out that different areas of STM and WM may be differentially
affected by the severity of the intellectual disability, with children who have
borderline ID showing fewer relative difficulties compared to typical age-matched
comparisons (only verbal STM was weaker), than children with mild ID (all aspects
of STM and WM were weaker).
By contrast, visuo-spatial STM may be either at mental age level or possibly
slightly higher as indicated by studies that included MA control children (Henry &
MacLean, 2002; Henry & Winfield, 2010; Rosenquist et al., 2003; Schuchardt et al.,
2010; Van der Molen et al., 2007; 2009; although see Bayliss et al., 2005 for
contradictory findings). Existing findings in relation to WM are also somewhat
contradictory, but many indicate that the performance levels of children with MBID
compared to MA control children, are at mental age level or just below (e.g. Bayliss
et al., 2005; Henry & MacLean, 2002; Henry & Winfield, 2010; Van der Molen et al.,
2007; Van der Molen et al., 2009). Research on inhibition in children with ID
suggests that performance may be somewhat below that of MA control children and,
therefore, below mental age level (Danielsson et al., 2012), although Van der Molen
et al. (2007) found that 15-year old adolescents with mild to borderline ID performed
as well as CA control children on inhibition scores from the Random generation task
(Towse & Mclachlan, 1999). In a further study, 15-year old adolescents with
borderline ID performed better on the Stroop task (Hammes, 1971), than their mild ID
8
might be due to differences in methodology, this inconsistent picture makes it hard to
formulate specific predictions in relation to inhibition skills in children with MBID.
Therefore, based on the previous literature, the following general prediction was
tested concerning developmental changes in STM and WM in children with MBID in
relation to chronological age: STM and WM develop linearly with chronological age
in children with MBID as they do in typical children. The developmental trajectories
of children with MBID show the same general characteristics as those of typically
developing children. In other words, development proceeds in a linear manner in
relation to chronological age, but some areas of STM and WM may plateau earlier
than others.
Finally, the importance of STM and WM in the development of scholastic
abilities has been demonstrated in several studies. Verbal STM is related to reading
and spelling in typically developing children (e.g. Leather & Henry, 1994) and in
children with intellectual disabilities (Henry & Winfield, 2010). Furthermore, visual
and spatial STM is related to early number skills (e.g. Bull et al., 2008) in typically
developing children, but probably not in children with intellectual disabilities (Henry
& MacLean, 2003; Henry & Winfield, 2010). Concerning WM, there is extensive
evidence that it is an important predictor of achievement in reading (e.g. Christopher
et al., 2012; Gathercole et al., 2004b) and arithmetic (e.g. Bull & Scerif, 2001;
Gathercole et al., 2004b) in typically developing children. In children with intellectual
disabilities, WM has been shown to be a predictor of number skills in these children
(Henry & MacLean, 2003; Henry & Winfield, 2010). Studies on the relationship
between inhibition and arithmetic and reading are sparse and results are ambiguous. A
positive, although modest, relationship between inhibition and arithmetic has been
9
Kroesbergen et al., 2009; St Claire-Thompson & Gathercole, 2006). However, recent
studies using latent variable analysis showed inhibition had no predictive value for
arithmetic (Van der Ven et al., 2011) or reading (Christopher et al., 2012). Relevant
data for children with ID are not currently available. Therefore, the second aim of the
study was to assess how STM, WM and inhibition skills contributed to important
scholastic achievements; in particular the speed and accuracy of single word reading
and arithmetic.
In summary, this study examined developmental changes in STM and WM in a
large sample of children who had MBID, and went on to explore relationships
between the memory measures and scholastic achievement in this group. As much is
already known about STM and WM development in typical children, and the
methods and measurements chosen here were comparable to those used in studies
with typically developing children, no control group of MA matched children was
deemed necessary to address our central question: How do STM and WM change
over age in children with MBID?
Method
Participants
A total of 197 young people with MBID attending schools for special education were
available for this study. A criterion for entrance in this type of school is an IQ score in
the range 50/55 - 85. The mean age of the MBID group was 12.09 (SD = 2.31, range
9.0 - 16.08) and their mean IQ score, based on the Raven Standard Progressive
Matrices (SPM; Raven, Court, & Raven, 1990, German norm scores of 2009), was 70
(SD = 9.37, range 50-85). We explored whether STM and WM developed similarly or
10
groups are presented here. The MID group consisted of 107 children (56 boys, 51
girls) with a mean age of 12.04 (SD = 2.13, age range 9.05 - 16.05) and a mean Raven
IQ score of 62 (SD = 5.16, range 50-70). The BID group comprised 90 children (54
boys, 36 girls) with a mean age of 13.03 (SD = 2.43, age range of 9.0 - 16.08) and a
mean Raven IQ of 78 (SD = 4.35, range 71-85). An ANOVA revealed that the mean
age of the BID group was significantly higher than that of the MID group, F(1, 195) =
9.09, p <.00.
There was no main effect of gender for the eight memory scores, F(1, 187) = 1.24, p
= .28, so this will not be considered further.
Adolescents diagnosed by psychiatrists as having attention deficit/hyperactive
disorder, pervasive developmental disorder-not otherwise specified, or other specific
etiologies were excluded because these psychiatric problems are associated with
specific working memory strengths and weaknesses (Gathercole & Alloway, 2006),
which might influence the results. Informed consent was obtained for every
participant. All participants had normal or corrected vision and were reported to be
healthy; none of them were taking psychotropic medication. All children were born in
The Netherlands.
Materials
To be able to test our hypotheses, a comprehensive battery of tests was composed, measuring
short-term memory, working memory, inhibition, arithmetic and reading speed. Only tests
with a proven track record for use in MBID populations in the Netherlands were included
(e.g., Alloway, 2010; Van der Molen et al., 2009; 2010).
11
Two verbal and two visual STM tests were used. Digit Recall and Nonword Recall
(Pickering & Gathercole, 2001) both measure verbal STM and require children to
repeat items, respectively digits or (Dutch sounding) nonwords, in the same order as
presented. For both tests there were six trials per list length. List lengths increased
incrementally, provided at least four of the six trials were completely correct. When
four trials of a list length were correctly repeated with no errors, the next list length
was immediately offered, with the omitted trials awarded one point each. Memory
scores represented the number of trials that were completely correct. Digit Recall
started with a list length of two digits with a maximum list length of eight digits,
therefore scores varied from 0 to 42. Nonword Recall started with a list length of 1
nonword with a maximum list length of six nonwords, therefore scores varied from 0
to 36.
Visual STM was assessed using Block Recall and the Visual Patterns test. Block Recall is identical to the Corsi test (see Lezak, 1995), but in this study we used the
instructions from Pickering and Gathercole (2001). The experimenter taps a sequence
of three-dimensional blocks that the child has to repeat in the same order. The task
started with one block, and the maximum list length was nine blocks. For each list
length, there were six trials. List length increased incrementally, provided at least four
of the six trials were completely correct. When four trials of a list length were
correctly repeated, the next list length was offered immediately, with the omitted
trials awarded one point each. Scores varied from 0 to 54.
In the Visual Patterns test (Della Sala et al., 1997) the child was shown a matrix
depicted on a stimulus card, varying from 2x2 to 5x6 squares, with half of the squares
being marked. After inspecting a stimulus card, the child had to indicate the marked
12
for each of the fourteen list lengths. List length referred to how many individual
squares had to be recalled from a particular matrix. Each stimulus card was always
shown three seconds, regardless of list length. List length increased incrementally,
provided at least two of the three trials were completely correct. Scores varied from 0
to 42.
Working memory tasks
Two verbal tests and one visual WM test were used. The two verbal WM tests were
Backward Digit Recall and Listening Recall. Backward Digit Recall (Pickering & Gathercole, 2001) requires the repeating back of spoken lists of digits, but in the
reverse order. Listening Recall (Pickering & Gathercole, 2001) requires listening to
simple statements to determine whether they are true or false, whilst at the same time
remembering the last word of each statement. Following each trial, these last words
had to be repeated in the same order as presented. Trials in Backward Digit Recall
started with a list length of two digits, with a maximum list length of seven digits,
while Listening Recall started with a list length of one sentence, up to a maximum list
length of six sentences. For each list length, there were six trials. List length increased
incrementally, provided at least four of the six trials were completely correct. When
four trials of a list length were correctly repeated, the next list length was offered
immediately, with the omitted trials awarded one point each. Scores varied from 0 to
36 for both tests.
Visual WM was examined using a manual version of the Spatial Span (Alloway, 2007). A card is shown with two shapes of which the right one has a red dot on top.
The right shape can be exactly the same (p−p) or opposite (p−q) to the left shape and
13
whether the shape on the right is the same as the shape on the left or different At the
same time, the position of the red dot on the right shape has to be remembered. This
position can be at three different locations according to the three rotation possibilities.
After each trial, the child has to point to a response card with three dots (at 0°, 120°
and 240°) to indicate which dots were on the stimuli cards and in which sequence.
The trials started with a list length of one card, with a maximum list length of six
cards. For each list length, there were six trials. List length increased incrementally,
provided at least four of the six trials were completely correct. When four trials of a
list length were correctly repeated, the next list length was offered immediately, with
the omitted trials awarded one point each. Scores varied from 0 to 36.
Response inhibition
The Stroop (Hammes, 1978), measuring response inhibition, consists of three cards.
First, the participant has to read as quickly as possible the names of four colours
(yellow, red, green and blue) written on the first card. Then on the second card, the
participant sees blocks filled in with the four colours and has to name these colours as
quickly as possible. Finally on the third card, the words of the four colours are written
and printed in a different coloured ink. The participant has to name the colour in
which the words are printed and inhibit the prepotent response to name the word. The
total (inference) score is the amount of time in seconds needed to read out the third
card minus the time in seconds needed for the second card (seconds needed to ‘read’
card three – seconds needed to ‘read’ card two). Scores can vary, as they depend on
how long the participant takes to read aloud cards two and three. The lower the
14
The Stroop is used more often in studies with MID children (e.g. Alloway, 2010; Van
der Molen et al., 2010) and already in 1976 a study by Bassett and Schellman
revealed that the Stroop colour word task can be used in ‘retardates’ with an average
IQ score of 61. Also, a study presented at the 2010 APA Annual Convention (Ikeda et
al., 2010), showed that the Stroop is suitable for adults with ID with a mean mental
age of 7 years. Furthermore, a recent article by Ikeda et al. (2011), showed that
typically developing children from age 7 years on were able to read the words, most
of them showing no errors in the word reading.
Scholastic abilities
Two tests were administered to tap scholastic abilities, one test for arithmetic and
another one for reading abilities. In the Arithmetic test (De Vos, 1992) the child was presented five rows for different arithmetic operations: adding subtracting,
multiplying, dividing and a row combining these four operations. In this study, only
the total score for three rows, adding, subtracting and multiplying was used, as most
of the children with MBID did not know how to solve dividing sums. The child had to
complete as many items in each row as possible within one minute by writing down
the correct answers. For every correct answer, one point was given. Total scores
reflected correct performance on the three rows, and varied between 0 and 120.
Reading fluency was assessed by the One minute Reading test (Brus & Voeten, 1979). The child was presented with a list with 116 unrelated words of increasing
difficulty and had to read aloud as many words as possible within one minute. Total
scores reflected the number of correctly read words, and varied from 0 to 116.
15
All children were tested at their schools in two sessions. In the first session Digit
Recall, Block Recall, Listening Recall and Raven’s SPM were administered. The
remaining tasks were administered in the second session. At the end of the second
session the participants received a small present. Ethical approval for the study was
granted from the Research Ethics committee of the Department of Psychology of the
University of Amsterdam.
Results
First the data were screened for outliers. Therefore, all scores were converted to
Z-scores. Of the 1,970 subtest scores, 8 had a Z-score more than 2.58 above or below
the mean. All those scores were from different participants, except two scores which
were from the same participant. These data were normalized by replacing them with
values corresponding to Z-scores = +/- 2.59 as appropriate (Field, 2009). Next, the
relation between IQ and age was explored in both groups. First we did some
correlational analyses. For the total group, the correlation between age and IQ was
low and non-significant, r= .10. Dividing the group in two: the correlation for MID
was r= -.09 and for BID it was r= -.17. These correlations were both non significant.
Then, we assessed whether the relations between age and IQ differed between both
groups. We therefore ran a linear regression analysis with IQ as the dependent
variable and in the first step group and age as predictors, and in the 2nd step dummy x
age for the interaction effect. The BID group had a higher IQ (as expected), age did
16
interaction effect. In short, the relation between age and IQ was similar for both the
MID and BID groups.
In order to test our predictions concerning developmental changes in WM and
STM, a series of eight linear regression analyses were carried out with each of the
eight STM, WM and Inhibition Z-scores included as the dependent variables. In each
case, chronological age, group (MID, BID) and age x group were included as
predictors. Quadratic and cubic models were also tried, but they yielded virtually no
improvement over the linear model for all of the eight scores, so they will not be
considered here. A second series of two linear regression analyses were then carried
out with the two separate scholastic-based Z-scores as dependent variables in order to
test the relations between these variables and the various STM and WM predictors.
The predictors for these regressions were the eight STM, WM and Inhibition Z-scores
in the first step, and chronological age, group and age x group in the second step. The
order of steps was determined this way, because some of the variables were more
affected by age than others, which could distort the findings. Again, quadratic and
cubic models were tried, but yielded no improvement over the linear model of the two
scholastic-based scores.
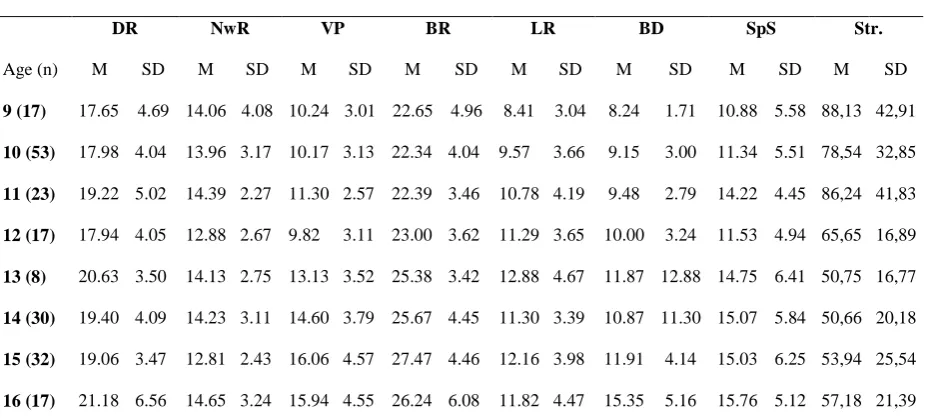
Mean scores and standard deviations for each raw STM, WM and Inhibition variable
by age are provided in Table 1. Raw scores rather than z-scores are included to give
an impression of the data according to the original scales.
____________________
Table 1 about here
____________________
17
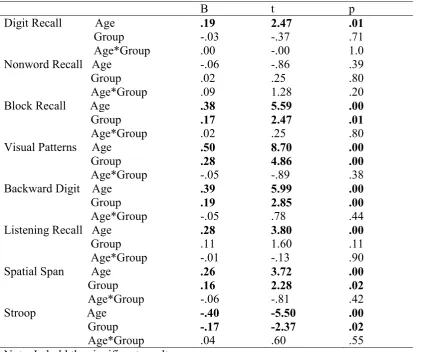
The first series of regression analyses examined the development of STM, WM and
inhibition, assessing whether chronological age, group, and the interaction between
age and group explained variance in each score. The findings showed that age was a
significant predictor of all scores except Nonword Recall. Age accounted for 3.1% of
the variation in Digit Recall, 1.1% of the variation in Nonword Recall, 19.2% of the
variation in Block Recall, 38.5% of the variation in the Visual Patterns Test, 9.6% of
the variation in Listening span, 21.5% of the variation in Backward Digit task, 10.8%
of the variation in Spatial Span, and 18.4% of the variation in inhibition (the Stroop
task). See Table 2 for details of these analyses.
There was also an effect of group on several tasks: the children with BID
performed better than the children with MID on Block Recall, Visual Patterns Test,
Backward Digit task, Spatial span and the Stroop task but not on Digit Recall,
Nonword Recall and Listening span.
There were no interaction effects of group x age: Both groups developed
similarly on all tasks.
____________________
Table 2 about here
____________________
The development of reading and arithmetic, and how they are influenced by STM, WM and inhibition
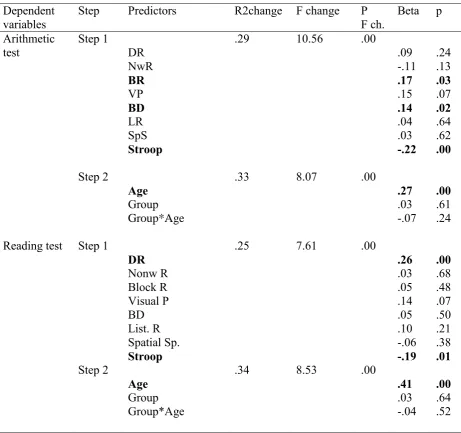
Table 3 gives details of the second series of regression analyses, which examined the
extent to which STM, WM and inhibition Z-scores were able to predict the Z-score on
18
Of particular interest was the effect on the Reading and Arithmetic tests, of
the eight STM, WM and Inhibition scores. These measures were entered in step one
of each regression, and were significant predictors of performance in both analyses.
Looking at the individual beta-values, Digit Recall and Inhibition significantly
predicted the score on the Reading test. When age was entered in step 2, the effect of
Inhibition disappeared. As Digit Recall and Nonword Recall are supposed to measure
the same; verbal STM, additional analyses were done to see what the shared variance
of both tasks is in predicting the score on the Reading task. This shared variance was
5%.
For the Arithmetic test, three significant predictors emerged: Inhibition, Block
Recall and Backward Digit recall. When age was entered in step 2, the effects of
Block Recall and Backward Digit recall disappeared. Shared variance for both Block
Recall and Visual Patterns test were calculated, as they are both visuo-spatial STM
measures. Shared variance was in this case 9%. Again the same was done for
Backward Digit recall and Listening Recall, both verbal WM tests. Here, shared
variance was 7%.
As might be expected, age was a significant predictor of the Reading test and
the Arithmetic test. There was no effect of group in either regression, nor was there an
interaction between age and group. Hence, the developmental changes in the Reading
and Arithmetic tests were comparable in both the MID and BID group (see Table 3).
____________________
Table 3 about here
____________________
19
The first purpose of the present study was to explore the development of verbal and
visuo-spatial STM, WM and inhibition in a large sample (N=197) of 9- to 16-year-old
children with mild to borderline intellectual disability (MBID). The second purpose
was to explore the relative influence of STM, WM and inhibition on arithmetic and
reading.
In terms of the first research question, the key findings were as follows: verbal
STM hardly improved between 9 and 16 years of age in children with MBID. Age
accounted for a non-significant 1% of the variance in nonword recall and accounted
for just 3% of the variance in digit recall (this was, however, significant). These were
very modest age effects and they contrasted with the other measures of visual and
spatial STM, verbal and visual WM, and inhibition. Age accounted for between 10
and 39% of overall performance on these other variables, providing evidence of the
linear increases in performance with chronological age. These findings suggest that
children with MBID show relatively little improvement with age in verbal STM;
reflecting their underperformance compared to younger typically developing children
matched on mental age (MA control group) in previous work (e.g. Henry & MacLean,
2002; Van der Molen et al., 2009). We speculate that the findings of Schuchardt et al.
(2010), who did not show mental age-relative underperformance in 10-year-old
children with ID, might have been a reflection of the age group they studied. At the
age of 10 years, children with ID may have only just reached their maximum
performance (plateau) on measures of verbal STM, therefore demonstrating their best
relative performance in relation to mental age. These chronological age-related
developmental paths did not differ between children with mild intellectual disability
(MID) and children with borderline intellectual disability (BID), as demonstrated by
20
BID groups did not differ in terms of level of verbal STM performance, providing
further evidence that this was a particularly weak memory skill in children with
MBID, irrespective of IQ score. By contrast, the severity of the ID was relevant for
other aspects of STM and WM performance: the BID group outperformed the MID
group on four assessed memory constructs including visual STM, spatial STM, verbal
WM and visual WM.
Compared to the existing research on typically developing children, there were
some differences in the developmental memory paths of children with MBID, varying
according to working memory component. Studies of typically developing
populations have shown verbal STM improvement until around age 15 (Conklin et al.,
2007; Gathercole et al., 2004a; although see Alloway et al., 2006), but a more
truncated improvement in visual STM only until around age 11 (Gathercole et al.,
2004a). This contrasts with the current results. Here, for children with MBID, very
little or no verbal STM development was found between 9 and 16 years of age, but,
instead, an improvement in visual STM was observed until at least age 16. The latter
finding may not come as a surprise, as some studies have found visual STM
performance to be at the level of typically developing peers in children with BID
(Henry, 2001), and in many studies, visual STM performance reaches or exceeds
mental age level (Henry & MacLean, 2002; Henry & Winfield, 2010; Rosenquist et
al., 2003; Schuchardt et al., 2010; Van der Molen et al., 2009). In summary, there
were two key differences between typical children and children with MBID: verbal
STM in children with MBID did not develop after age 10 and appeared to be
particularly weak; while visual STM developed until at least age 16 and appeared to
21
An important question concerns why verbal STM is relatively weak in children
with MBID shown here and elsewhere (e.g. Bayliss et al., 2005; Henry & MacLean,
2002; Henry & Winfield, 2010; Russell et al., 1996; Schuchardt et al., 2010; Van der
Molen et al., 2007; 2009). One possibility concerns automatic rehearsal in the
phonological loop. Typically developing children, from age 7-9 years, show
automatic rehearsal (e.g. Gathercole et al., 1994; Henry & Millar, 1993). Information
that is kept in the verbal short-term store is automatically repeated to prevent this
information of fading away. Studies investigating automatic rehearsal in children with
MBID are not straightforward in their conclusions. Several studies have found no
evidence for automatic rehearsal in children with MBID (e.g. Hasselhorn & Maehler,
2007), whereas others have reported some evidence for either speech coding or verbal
rehearsal (Henry, 2008; Schuchardt et al., 2011; Van der Molen et al., 2007). In a
recent study, Schuchardt et al. (2011) concluded that automatic rehearsal was intact in
both children with MID and BID, provided the children had mental age levels of at
least 7 years. However, although these authors claimed that verbal processing kept
pace with mental age, they, nevertheless, concluded that the verbal short-term store
itself was severely impaired in children with MID. Here, the fact that Nonword recall
did not develop with age whereas Digit recall did (slightly) could support this position.
Nonwords may be more difficult and time-consuming to rehearse because, lacking
lexical entries, they require greater processing time; whereas digits can be processed
rapidly due to their high familiarity.
If the verbal short-term store is constrained in children with ID, this leads to
further questions as to whether it is constrained from birth (or before), or whether it is
something that changes with development. Further research utilising brain scanning
22
tasks from infancy and/or toddlerhood until around age 10 years (after which we
suggest that it does not develop further). Studies in the typically developing
population have shown that WM tasks activate brain regions like dorsolateral and
ventrolateral prefrontal cortex and superior parietal cortex, and that these regions
become more activated as children grow older (e.g. Klingberg et al., 2002). Verbal
STM is especially associated with ventral regions (Conklin et al., 2007), although
dorsolataral regions become involved in adults when the number of items to be
recalled increases (Veltman et al., 2003). This is in line with Gathercole et al. (2004a)
who argued that typically developing children, as they get older, take greater
advantage of the central executive to enhance the limited verbal STM storage. The
question remains whether or not ventral regions in children with MBID become
sufficiently involved when performing verbal STM tasks, and if this activation
increases with age. Furthermore, as STM tasks rely increasingly on dorsolateral
regions when memory load increases, it is of interest to explore if children with
MBID do show (increasing) activation in that brain region when task load increases,
to see whether they rely on the central executive like typically developing children do.
Therefore, although we conclude that verbal STM develops very little after the
age of 10 years in children with MBID, we still do not know if and how it develops
before that age. Future research should, therefore, focus on memory performance in
these children at earlier ages (below 10 years). However, mental ages should
preferably not be below 4 years to be able to test the children with a range of practical
instruments (e.g. the Automated Working Memory Assessment for children, AWMA,
Alloway, 2007, is appropriate for children from 4 years of age and older), although
some STM and WM tasks can be adapted for children with weak (visuo-spatial)
23
should be examined to see if the developments in visual and spatial STM, WM and
inhibition continue beyond mid-adolescence.
Relatively few of the STM, WM and inhibition measures were predictors of
reading and arithmetic in children with MBID, and even fewer were significant after
age and group had been controlled. However, the shared variance of both administered
verbal STM measures in predicting the score on the Reading task was 5%. This
finding is in line with some previous work suggesting that verbal STM is the best
predictor of reading and spelling in children with ID (Henry & Winfield, 2010),
although such findings have not been reported by everyone (Alloway & Temple, 2007;
Bayliss et al, 2005). Such a relationship implies that the basic ability to hold speech
items in mind for brief periods of time is crucial for reading in those with intellectual
disabilities, although we might expect stronger contributions from measures of WM in
typical children (Christopher et al., 2012). It is important to note, however, that before
age was controlled, inhibition also made a significant contribution to reading,
suggesting that the ability to inhibit incorrect ‘guesses’ when reading might be an
important skill that develops with age.
With respect to arithmetic, previous work has been relatively consistent in
demonstrating a link between WM and arithmetic in children with ID (Alloway &
Temple, 2007; Henry & MacLean, 2003) and in typically developing children (e.g.
Bull & Scerif, 2001; Raghubar et al., 2010). We found similar relationships: one
measure of WM, Backward Digit recall, was a significant predictor of arithmetic
before age was controlled; and so was Block Recall (a measure of visuospatial STM),
giving some evidence that these skills may be important predictors of arithmetic in
populations of children with MBID. Arithmetic is said to depend on WM as
24
processing new information to arrive at a solution (Raghubar et al., 2010). However, it
is important to note that once age had been controlled, the only variable to relate to
arithmetic was inhibition. In fact, the links between WM and arithmetic are likely to
be complex, probably depending on several factors like age, skill level and the type of
sum (Raghubar et al., 2010). The current finding that arithmetic and inhibition were
related in children with MBID is in line with some studies carried out with typically
developing children (e.g. Bull & Scerif, 2001, Kroesbergen et al., 2009; but see Van
der Ven et al., 2011). It is assumed that inhibition is involved in arithmetic when
inappropriate strategies have to be suppressed like for example addition when
multiplication is required (Toll et al., 2011). If inhibition is indeed a predictor of
arithmetic, then it might be worthwhile to explore the possibilities for training
inhibition, for example by Braingame Brian, a cognitive training package that includes
response inhibition (Prins et al., 2013).
In conclusion, the current findings showed that most aspects of STM, WM and
inhibition in children with MBID developed between 9 and 16 years of age. However,
contrary to the typically developing population, very little or no verbal STM
development was found between 9 and 16 years of age. Again, contrary to the typical
population, an improvement in visual STM was observed until at least age 16. Why
verbal STM hardly improves in children with MBID beyond the age of 10 years,
remains an unresolved question, but given the link found between verbal STM (digit
span) and reading, this should be a priority for future research.
25
References
Alloway T. P. (2007). Automated working memory assessment. London, UK: Harcourt Assessment.
Alloway, T. P. (2010). Working memory and executive function profiles of individuals
with borderline intellectual functioning. Journal of Intellectual Disability Research, 54, 448-456. doi:10.1111/j.1365-2788.2010.01281.x
Alloway, T. P., Gathercole, S. E., & Pickering, S. J. (2006). Verbal and visuospatial
short-term and working memory in children: Are they separable? Child Development, 77, 1698-1716. doi:10.1111/j.1467-8624.2006.00968.x
Alloway, T.P. & Temple, K.J. (2007). A comparison of working memory skills and
learning in children with developmental coordination disorder and moderate
learning difficulties. Applied Cognitive Psychology, 21, 473-487. doi:10.1002/acp.1284
Baddeley, A. (1996). Exploring the central executive. The Quarterly Journal of Experimental Psychology, 49A(1), 5-28. doi:10.1080/027249896392784
Baddeley A. D. (2000) The episodic buffer: A new component of working memory?
Trends in Cognitive Sciences 4, 417-423. doi:10.1016/S1364-6613(00)01538-2
Baddeley A. D. (2007) Working memory, thought, and action. Oxford, UK: Oxford University Press.
Bassett, J. E., & Schellman, G. C. (1976). Performance of retardates on the stroop
color-word test. Perceptual and Motor Skills, 43, 1259-1262. http://www.ncbi.nlm.nih.gov/pubmed/1012904
Bayliss, D. M., Jarrold, C., Baddeley, A. D., & Leigh, E. (2005). Differential constraints
26
difficulties and typically developing children. Journal of Experimental Child Psychology, 92, 76-99. doi:10.1016/j.jecp.2005.04.002
Bennett-Gates, D., & Zigler, E. (1998). Resolving the developmental-difference debate:
An evaluation of the triarchic and systems theory models. In R. M. H. J. A. Burack
& E. Zigler (Eds.), Handbook of mental retardation and development (pp. 115-131). Cambridge, UK: Cambridge University Press.
Brus, B. Th, & Voeten, M. J. M. (1997). Een-Minuut Test, verantwoording en handleiding [One-minute test, manual]. Amsterdam, The Netherlands: Pearson. Bull, R., Espy, K. A. & Wiebe, S. A. (2008). Short-term memory, working memory,
and executive functioning in preschoolers: Longitudinal predictors of mathematical
achievement at age 7 years. Developmental Neuropsychology 33, 205-228. doi:10.1080/87565640801982312
Bull, R., & Scerif, G. (2001). Executive functioning as a predictor of children’s
mathematics ability: shifting, inhibition, and working memory. Developmental Neuropsychology, 19(3), 273-293. doi:10.1207/S15326942DN1903_3
Christopher, M. E., Miyake, A., Keenan, J. M., Pennington, B., DeFries, J. C.,
Wadsworth, S. J., ... Olson, R. (2012). Predicting word reading and comprehension
with executive function and speed measures across development: A latent variable
analysis. Journal of Experimental Psychology: General, 141, 470-488. doi:10.1037/a0027375
Conklin, H. M., Luciana, M., Hooper, C. J., & Yarger, R. S. (2007). Working memory
performance in typically developing children and adolescents: Behavioural
27
Danielsson, H., Danielsson, H., Henry, L., Messer, D., & Rönnberg, J. (2012). Strengths and
weaknesses in executive functioning in children with intellectual disability. Research in Developmental Disabilities, 33, 600-607. doi:10.1016/j.ridd.2011.11.004
Della Sala, S., Gray, C., Baddeley, A., & Wilson, L. (1997). Visual patterns test: A new test of short-term visual recall. Suffolk, UK: Thames Valley Test Company.
De Vos, T. (1992). Tempo Test Rekenen [Tempo Test Arithmetic]. Lisse, The Netherlands: Swets Test Publishers.
Diamantopoulou, S., Rydell, A-M, Thorell, L. B., & Bohlin, G. (2007). Impact of
executive functioning and symptoms of attention deficit hyperactivity disorder on
children’s peer relations and school performance. Developmental
Neuropsychology, 32, 521-542. doi:10.1080/87565640701360981
Farrell Pagulayan, K., Busch, R. M., Medina, K. L., Bartok, J. A., & Krikorian, R.
(2006). Developmental normative data for the Corsi Block-Tapping Task. Journal of Clinical and Experimental Neuropsychology, 28, 1043-1052. doi:10.1080/13803390500350977
Field, A. (2009). Discovering statistics using SPSS. London: Sage.
Gathercole, S. E., Adams, A.-M., & Hitch, G. (1994). Do young children rehearse? An
individual-differences analysis. Memory and Cognition, 22(2), 201-207.
Gathercole, S. E., & Alloway, T. P. (2006). Short-term and working memory
impairments in neurodevelopmental disorders: Diagnosis and remedial support.
Journal of Child Psychology & Psychiatry, 47, 4-15. doi:10.1111/j.1469-7610.2005.01446.x
Gathercole, S. E., Pickering, S. J., Ambridge, B., & Wearing, H. (2004a). The structure
28
Gathercole, S. E., Pickering, S. J., Knight, C., & Stegmann, Z. (2004b). Working
memory skills and educational attainment: Evidence from national curriculum
assessments and 7 and 14 years of age. Applied Cognitive Psychology, 18, 1-16. doi:10.1002/acp.934
Gerstadt, C. L., Hong, Y. J., & Diamond, A. (1994). The relationship between cognition
and action: Performance of children 3½-7 years old on a Stroop-like day-night test.
Cognition, 53, 129-153. doi:10.1016/0010-0277(94)90068-X
Hamilton, C. J., Coates, R. O., & Heffernan, T. (2003). What develops in visuo-spatial
working memory development? European Journal of Cognitive Psychology, 15, 43-69. doi:10.1080/09541440303597
Hammes, J. (1978). De Stroop kleur-woord test: Handleiding [The Stroop colour-word test: Manual]. Amsterdam: Swets & Zeitlinger.
Hasselhorn, M., & Maehler, C. (2007). Phonological working memory of children in
two German special schools. International Journal of Disability, Development and Education, 54, 225-244.doi:10.1080/10349120701330545
Heikura, U., Linna, S. L., Olsen, P., Hartikainen, A. L., Taanila, A., & Jarvelin, M. R.
(2005). Etiological survey on intellectual disability in the Northern Finland birth
cohort 1986. American Journal on Mental Retardation, 110(3), 171-180. doi:10.1352/0895-8017(2005)110<171:ESOIDI>2.0.CO;2
Henry, L. A. (2001). How does the severity of a learning disability affect working
memory performance? Memory, 9, 233-247. doi:10.1080/09658210042000085 Henry, L. (2008). Short-term memory coding in children with intellectual disabilities.
American Journal on Mental Retardation, 113, 187-200.
29
Henry, L. A. (2012). The development of working memory in children. London: Sage Publications.
Henry, L. A., & MacLean, M. (2002). Working memory performance in children with
and without intellectual disabilities. American Journal on Mental Retardation, 107(6), 421-432. doi: 10.1352/0895-8017(2002)107<0421:WMPICW>2.0.CO;2 Henry, L. A. & MacLean, M. (2003). Relationships between working memory, expressive
vocabulary and arithmetical reasoning in children with and without intellectual
disabilities. Educational and Child Psychology, 20(3), 51-64. Retrieved from
http://cogprints.org/
Henry, L. A. & Millar, S. (1993). Why does memory span improve with age: A review of
the evidence for 2 current hypotheses. European Journal of Cognitive Psychology, 5(3), 241-287. doi:10.1080/09541449308520119
Henry, L., & Winfield, J. (2010). Working memory and educational achievement in
children with intellectual disabilities. Journal of Intellectual Disability Research, 54, 354-365. doi:10.1111/j.1365-2788.2010.01264.x
Huizinga, M., Dolan, C. V., & Van der Molen, M. W. (2006). Age-related change in
executive function: Developmental trends and a latent variable analysis.
Neuropsychologia, 44, 2017-2036.doi:10.1016/j.neuropsychologia.2006.01.010 Ikeda, Y., Haishi, K., & Okuzumi, H. (2010, August). Stroop interference in persons
with developmental disabilities. Poster session presented at the meeting of the 118th Annual Convention of the American Psychological Association, San Diego, USA.
Ikeda, Y., Okozumi, H., Kokobun, M., & Haishi, K. (2011). Age-related trends of
interference control in school-age children and young adults in the stroop
color-word test. Psychological Reports, 108, 577-584.
30
Klenberg, L., Korkman, M., & Lahti-Nuuttila, P. (2001). Differential development of
attention and executive functions in 3- to 12-year old Finnish children.
Developmental Neuropsychology, 20, 407-428. doi:10.1207/S15326942DN2001_6 Klingberg, T., Forssberg, H., & Westerberg, H. (2002). Increased brain activity in
frontal and parietal cortex underlies the development of visuospatial working
memory capacity during childhood. Journal of Cognitive Neuroscience, 14, 1-10. doi:10.1162/089892902317205276
Kroesbergen, E. H., Van Luit, J. E. H., Van Lieshout, E. C. D. M., Van Loosbroek, E.,
& Van de Rijt, B. A. M. (2009). Individual differences in early numeracy: The role
of executive functions and subitizing. Journal of Psychoeducational Assessment, 27, 226-236. doi:10.1177/0734282908330586
Letho, J. E., Juujarvi, P., Kooistra, L., & Pulkkinen, L. (2003). Dimensions of executive
functioning: Evidence from children. British Journal of Developmental Psychology, 21, 59-80. doi:10.1348/026151003321164627
Leather C. V., & Henry L. A. (1994). Memory span and phonological awareness tasks
as predictors of early reading ability. Journal of Experimental Child Psychology, 58, 88-111. doi: 10.1006/jecp.1994.1027
Lezak M. D. (1995). Neuropsychological assessment (3rd ed.), NewYork, NY: Oxford University Press.
Luciana, M., Conklin, H. M., Hooper, C. J., & Yarger, R. (2005). The development of
nonverbal working memory and executive control processes in adolescents. Child Development, 76, 697-712. doi:10.1111/j.1467-8624.2005.00872.x
McAuley, T., & White, D. A. (2011). A latent variables examination of processing
31 Journal of Experimental Child Psychology, 108, 453-468. doi:10.1016/j.jecp.2010.08.009
Nutley, S.B., Söderqvist, S., Bryde, S., Humphreys, K., & Klingberg, T. (2010).
Measuring working memory capacity with greater precision in the lower capacity
ranges. Developmental Neuropsychology, 35, 81-95.
doi:10.1080/87565640903325741
Pickering S. J., & Gathercole S. E. (2001). Working memory test battery for children.
London, UK: Psychological Corporation.
Pickering, S. J., Gathercole, S. E., Hall, M., & Lloyd, S. (2001). Development of
memory for pattern and path: Further evidence for the fractionation of visuo-spatial
memory. The Quarterly Journal of Experimental Psychology, 54, 397-420. doi:10.1080/02724980042000174
Ponsioen, A., & Van der Molen, M. (2002). Cognitieve vaardigheden van licht verstandelijk gehandicapte kinderen en jongeren: Een onderzoek naar mogelijkheden [Cognitive abilities of children and adolescents with mild intellectual disabilities: Exploring the capabilities]. Utrecht, The Netherlands:
Landelijk Kenniscentrum LVG.
Prins, P.J.M., Brink, E. Ten, Dovis, S., Ponsioen, A., Geurts, H.M., Vries, M. de, & Van
der Oord, S. (2013). “Braingame Brian”: Toward an Executive Function Training
Program with Game Elements for Children with ADHD and Cognitive Control
Problems. Games for Health Journal, 2, 44-49.
doi:10.1089/g4h.2013.0004Raghubar, K. P., Barnes, M. A., & Hecht, S. A. (2010).
Working memory and mathematics: A review of developmental, individual
32
Raven, J.C., Court, J. H., & Raven, J. (1990). Standard Progressive Matrices. Oxford, UK: University Press Oxford.
Rosenquist, C., Conners, F. A., & Roskos-Ewoldsen, B. (2003). Phonological and
visuo-spatial working memory in individuals with intellectual disability. American Journal on Mental Retardation, 108, 403-413. doi:10.1352/0895-8017(2003)108<403:PAVWMI>2.0.CO;2
Russell, J., Jarrold, C., & Henry, L. (1996). Working memory in children with autism
and with moderate learning difficulties. Journal of Child Psychology and Psychiatry, 37, 673-686. doi: 10.1111/j.1469-7610.1996.tb01459.x
Schuchardt, K., Gebhardt, M., & Maehler, C. (2010). Working memory functions in
children with different degrees of intellectual disability. Journal of Intellectual Disability Research, 54, 346-353. doi:10.1111/j.1365-2788.2010.01265.x
Schuchardt, K., Maehler, C., & Hasselhorn, H. (2011). Functional deficits in
phonological working memory in children with intellectual disabilities. Research in Developmental Disabilities, 32, 1934-1940. doi:10.1016/j.ridd.2011.03.022 St Clair-Thompson, H. L., & Gathercole, S. E. (2006). Executive functions and
achievements in school: Shifting, updating, inhibition, and working memory. The Quarterly Journal of Experimental Psychology, 59, 745-759. doi:10.1080/17470210500162854
Swanson, H. L. (1999). What develops in working memory? A life span perspective.
Developmental Psychology, 35, 986-1000. doi: 10.1037/0012-1649.35.4.986 Toll, S. W. M., Van der Ven, S. H. G., Kroesbergen, E. H., & Van Luit, J. E. H. (2011).
33
Towse, J. N., & Mclachlan, A. (1999). An exploration of random generation among
children. British Journal of Developmental Psychology, 17, 363-380. doi: 10.1348/026151099165348
Van der Molen, M. J., Van Luit, J. E. H., Jongmans, M. J., & Van der Molen, M. W.
(2007). Verbal working memory in children with mild intellectual disabilities.
Journal of Intellectual Disability Research, 51, 162-169. doi:10.1111/j.1365-2788.2006.00863.x
Van der Molen, M. J., Van Luit, J. E. H., Jongmans, M. J., & Van der Molen, M. W.
(2009). Memory profiles in children with mild intellectual disabilities: Strengths
and weaknesses. Research in Developmental Disabilities, 30, 1237-1247. doi:10.1016/j.ridd.2009.04.005
Van der Sluis, S., De Jong, P. F., & Van der Leij, A. (2004). Inhibition and shifting in
children with learning deficits in arithmetic and reading. Journal of Experimental Child Psychology, 87, 239-266. doi:10.1016/j.jecp.2003.12.002
Van der Ven, S. H. G., Kroesbergen, E. H., Boom, J., & Leseman, P. P. M. (2011). The
development of executive functions and early mathematics: A dynamic
relationship. British Journal of Educational Psychology, 82, 100-119. doi :10.1111/j.2044-8279.2011.02035.x
Veltman, D. J., Rombouts, S. A., & Dolan, R. J. (2003). Maintenance versus
manipulation in verbal working memory revisited: An fMRI study. Neuroimage, 18, 247-256. doi:10.1016/S1053-8119(02)00049-6
Welsh, M. C., Pennington, B. F., Groisser, D. B. (1991). A normative-developmental
study of executive function. A window on prefrontal function in children.
34
Williams, B. R., Ponesse, J. S., Schachar, R. J., Logan, G. D., & Tannoch, R. (1999).
35
[image:36.595.66.529.153.363.2]Tables
Table 1: Mean scores and SD per score for each year of age
STM, WM and inhibition tasks
DR NwR VP BR LR BD SpS Str.
Age (n) M SD M SD M SD M SD M SD M SD M SD M SD
9 (17) 17.65 4.69 14.06 4.08 10.24 3.01 22.65 4.96 8.41 3.04 8.24 1.71 10.88 5.58 88,13 42,91
10 (53) 17.98 4.04 13.96 3.17 10.17 3.13 22.34 4.04 9.57 3.66 9.15 3.00 11.34 5.51 78,54 32,85
11 (23) 19.22 5.02 14.39 2.27 11.30 2.57 22.39 3.46 10.78 4.19 9.48 2.79 14.22 4.45 86,24 41,83
12 (17) 17.94 4.05 12.88 2.67 9.82 3.11 23.00 3.62 11.29 3.65 10.00 3.24 11.53 4.94 65,65 16,89
13 (8) 20.63 3.50 14.13 2.75 13.13 3.52 25.38 3.42 12.88 4.67 11.87 12.88 14.75 6.41 50,75 16,77
14 (30) 19.40 4.09 14.23 3.11 14.60 3.79 25.67 4.45 11.30 3.39 10.87 11.30 15.07 5.84 50,66 20,18
15 (32) 19.06 3.47 12.81 2.43 16.06 4.57 27.47 4.46 12.16 3.98 11.91 4.14 15.03 6.25 53,94 25,54
16 (17) 21.18 6.56 14.65 3.24 15.94 4.55 26.24 6.08 11.82 4.47 15.35 5.16 15.76 5.12 57,18 21,39
Note: DR = Digit Recall, NwR = Nonword Recall, VP = Visual Patterns, BR = Block Recall, LR =
36 Table 2: Details of the multiple regression analyses with the STM and WM scores as
dependent variables and age, group and age*group as the predictors
B t p
Digit Recall Age Group
Age*Group
.19 2.47 .01
-.03 -.37 .71
.00 -.00 1.0
Nonword Recall Age Group Age*Group
-.06 -.86 .39
.02 .25 .80
.09 1.28 .20
Block Recall Age Group Age*Group
.38 5.59 .00 .17 2.47 .01
.02 .25 .80
Visual Patterns Age Group Age*Group
.50 8.70 .00 .28 4.86 .00
-.05 -.89 .38
Backward Digit Age Group Age*Group
.39 5.99 .00 .19 2.85 .00
-.05 .78 .44
Listening Recall Age Group Age*Group
.28 3.80 .00
.11 1.60 .11
-.01 -.13 .90
Spatial Span Age Group Age*Group
.26 3.72 .00 .16 2.28 .02
-.06 -.81 .42
Stroop Age -.40 -5.50 .00
Group -.17 -2.37 .02
37 Table 3: Linear regression models with arithmetic and reading as dependent variables and age,
group, age*group and STM, WM and Inhibition scores as predictors (N= 191)
Dependent variables
Step Predictors R2change F change P F ch.
Beta p
Arithmetic test Step 1 DR NwR BR VP BD LR SpS Stroop
.29 10.56 .00
.09 -.11 .17 .15 .14 .04 .03 -.22 .24 .13 .03 .07 .02 .64 .62 .00 Step 2 Age Group Group*Age
.33 8.07 .00
.27 .03 -.07 .00 .61 .24
Reading test Step 1
DR Nonw R Block R Visual P BD List. R Spatial Sp. Stroop
.25 7.61 .00
.26 .03 .05 .14 .05 .10 -.06 -.19 .00 .68 .48 .07 .50 .21 .38 .01 Step 2 Age Group Group*Age
.34 8.53 .00
.41 .03 -.04 .00 .64 .52
Note: In bold the significant results; DR = Digit Recall, NwR = Nonword Recall, BR = Block Recall, VP = Visual Patterns, BD = Backward Digit Recall,