City, University of London Institutional Repository
Citation
: Mann, W., Roy, P. and Morgan, G. (2016). Adaptation of a Vocabulary Test from
British Sign Language to American Sign Language. Language Testing, 33(1), pp. 3-22. doi: 10.1177/0265532215575627This is the accepted version of the paper.
This version of the publication may differ from the final published
version.
Permanent repository link:
http://openaccess.city.ac.uk/8382/Link to published version
: http://dx.doi.org/10.1177/0265532215575627
Copyright and reuse:
City Research Online aims to make research
outputs of City, University of London available to a wider audience.
Copyright and Moral Rights remain with the author(s) and/or copyright
holders. URLs from City Research Online may be freely distributed and
linked to.
City Research Online: http://openaccess.city.ac.uk/ publications@city.ac.uk
1 Adaptation of a Vocabulary Test from
British Sign Language to American Sign Language
Wolfgang Mann1, 2, 3, Penny Roy2, & Gary Morgan2
1
University of Roehampton
2
City University London
3
University of Texas at Austin
Corresponding author:
Wolfgang Mann School of Education, University of Roehampton
Roehampton Lane SW18 5PJ
Tel.: +44 (0)20 9392 6281
2 Adaptation of a Vocabulary Test from
British Sign Language to American Sign Language
Wolfgang Mann, Penny Roy, & Gary Morgan
This study describes the adaptation process of a vocabulary knowledge test for British Sign Language (BSL) into American Sign Language (ASL) and presents results from the first round of pilot testing with twenty deaf native ASL signers. The web-based test assesses the strength of deaf children’s vocabulary knowledge by means of different mappings of phonological form and meaning of signs. The adaptation from BSL to ASL involved nine stages, which included forming a panel of deaf/hearing experts, developing a set of new items and revising/replacing items considered ineffective, and piloting the new version. Results provide new evidence in support of the use of this methodology for assessing sign language, making a useful contribution toward the availability of tests to assess deaf children’s signed language skills.
Introduction
Signed languages have been recognized as autonomous languages in many countries,
including the US and most of Europe, and are used world-wide by large numbers of deaf
individuals. Yet, sign language research can be considered a fairly young field, which did not
start until the 1960s, whereas studies of hearing children’s language development have a much
longer history and traditionally have focused on spoken languages, exploiting the auditory
modality. The study of signed languages makes an important contribution to the area of language
development by allowing researchers to raise and explore issues that would not and could not be
raised if human languages were confined only to the spoken modality (Meir, 2012). One such
issue is the question of how and in what ways the physical modality of language transmission
3
Signed languages differ considerably from most spoken languages both with regard to
modality (visual-gestural vs. aural-oral) and also due to their lack of a standardized written form
(Meir, 2012; Sutton-Spence & Woll, 1999). In addition, only a small number (5-10%) of all deaf
children have deaf parents (DCDP) (Mitchell & Karchmer, 2004) and acquire a natural signed
language (e.g., ASL) from birth. The majority of deaf children are born to hearing parents
(DCHP) and their early language experience is more variable, ranging from access to signed
language to oral language input only (see Allen, 2014, for a more detailed description of these
groups). It is necessary because of these differences to understand more about how early
experience influences deaf children’s linguistic development. This however requires the
development and availability of appropriate test instruments for sign languages to document a)
the effects of different ages of intial exposure to sign language and b) possible effects on
language fluency depending on whether the language is a first or second language (Mayberry &
Eichen, 1991; Morford & Mayberry, 2000). However, only a small number of such assessments
exist internationally, and even fewer of those have been standardized. This is due to various
reasons such as the relatively small size of the signing population and its heterogeneous nature,
limited accessibility to deaf native signers and the young age of sign language research,
particularly outside the US (see Haug & Mann, 2008; Mann & Haug, 2014, for a review). Based
on these constraints, one strategy researchers have used is to adapt existing tests from one signed
language to another. The most widely known example is the British Sign Language Receptive
Skills Test (Herman, Holmes, & Woll, 1999), a test to measure the comprehension of
morpho-syntax, which has been adapted, to date, into several other sign languages, including German
Sign Language (Haug, 2012) and American Sign Language (Enns & Herman, 2011). Another
4
Communicative Development Inventory (Fenson et al., 1993), a parental checklist for English to
monitor language development in children between the ages of 8-36 months, which has been
adapted for many different languages, including ASL (Anderson & Reilly, 2002) and BSL
(Woolfe, Herman, Roy, & Woll, 2010). The present paper adds to this research and delineates
the process of adapting a new measure of deaf children’s vocabulary knowledge in BSL, the
web-based BSL vocabulary tasks (BSL-VT; Mann & Marshall, 2012), to ASL as part of a larger
study, which investigated lexical acquisition in ASL and English by deaf children between 6-10
years (Authors, under review). Currently, there are no standardized assessments available for
either ASL or BSL that measure vocabulary knowledge in the same detailed way as the BSL-VT
and the ASL-VT.
The web-based BSL Vocabulary Test (BSL-VT)
The web-based BSL-VT (Mann & Marshall, 2012) measures vocabulary knowledge in
BSL in deaf children aged between 4-15 years. More specifically, it examines variation in
signers’ understanding of different mappings between phonological form and meaning in single
BSL signs. The BSL-VT consists of four tasks: form recall, meaning recall, form recognition,
and meaning recognition. Each task contains 120 items, which are the same across tasks. All of
these items are signs only; no fingerspelling1 is used, e.g., B-A-N-K. Stimuli include pictures
and video recordings of BSL signs and all tasks are web-based.
The BSL-VT is based on a model from second language acquisition (SLA) that assesses
vocabulary size and strength (Laufer & Goldstein, 2004; Laufer, Elder, Hill, & Congdon, 2004).
Compared to conventional tests, which have been criticized for testing vocabulary knowledge in
a superficial way by focusing exclusively on vocabulary size (Laufer & Goldstein, 2004, 400),
1Fingerspelling is used in signed languages to spell out names of people and/or places for which
5
e.g., Peabody Picture Vocabulary Test, Dunn & Dunn, 1997), the BSL-VT allows a more
in-depth measurement of test takers’ understanding of each individual item. Similar to the model by
Laufer and colleagues, the underlying construct of the BSL-VT is based on the assumption that
two or more learners may have different knowledge about the same word or sign. Table 1
illustrates this construct of strength of form-meaning mappings, ranging from 1, the weakest
mapping (meaning recognition) – 4, the strongest mapping (meaning recall).
Table 1: Construct of strength of form-meaning mappings in BSL
__________________________________________________________________________
Type of mapping Task description
Strong
4. Meaning Recall Produce three BSL responses to a sign prompt
3. Form Recall Produce the target BSL sign for a picture prompt
2. Form Recognition Match a picture prompt with one of four BSL signs
1. Meaning Recognition Match a prompt in BSL with one of four pictures
Weak
__________________________________________________________________________
During the form recall task, participants see an image and are asked to produce the
corresponding BSL sign. In the form recognition task, participants are presented with a stimulus
image and four signs and have to select the sign that best matches the image by using the mouse
to click a radio button below the video. Similarly, in the meaning recognition task, participants
see a stimulus sign and four images on their screen and have to select the image that best
illustrates the meaning of the sign by clicking the radio button below the image with the mouse.
Finally, for the meaning recall task, participants see the target BSL sign and have to supply a
different BSL sign with an associated meaning. For the two recall tasks, participants’ responses
6
are manually entered by test administrator in a scoring form, which appears together with the
stimulus on screen whereas responses for the two recognition tasks are automatically saved (for a
detailed description of the procedure for each task, see Mann & Marshall, 2012).
As can be seen, two of the measures (form recall, meaning recall) involve production and
two involve comprehension (form recognition, meaning recognition). A signer, who can recall
the meaning (level 4) or form (level 3) of a sign, is also likely to recognize that sign’s form (level
2) or meaning (level 1) when presented. Evidence in support of the construct includes research
on signed (Mann & Marshall, 2012, Mann, Roy, & Marshall, 2013) and spoken language (Laufer
et al., 2004; Laufer & Godlstein, 2004), which revealed significant differences in participants’
performance across tasks. With each of the four mappings representing a different level of
vocabulary strength, the test provides an estimate of test takers’ vocabulary knowledge.
The aim of the reported work was to develop and pilot an adapted version of the BSL-VT
for deaf children between the ages of 6-10 years in the USA as a baseline measure for a larger
study that investigated signing deaf children’s response to scripted mediation in ASL and to
investigate the reliability and validity of the adapted measure. At the time of this work, there was
no standardized ASL vocabulary test available that measures strength of vocabulary knowledge.
All of the presented work took place in the US.
Method
In our adaptation of the BSL-VT to ASL, we followed the steps outlined by Enns &
Herman (2011) and added a number of additional stages. This resulted in nine steps, presented in
7 Table 2: Adaptation process for the BSL-Vocabulary Test to ASL
______________________________________________________________________________ 1. Consultation with ASL panel, consisting of deaf/hearing US experts all of whom were
fluent or native signers*
2. Development of new test items/distractors*
3. Adjustment of items/images to account for cultural differences*
4. Validation of target items**
5. Recording of new target signs and distractors + introduction and instructions*
6. Changes to the web-based format**
7. Revision of items based on comments from panel*
8. Pre-pilot of ASL Vocabulary test prototype with two deaf adults*
9. Pilot I with complete set of items*
____________________________________________________________________________
* = outlined by Herman & Enns (2011) ** = newly added
Stage 1
During stage 1, we recruited a panel of experts at a university in Central Texas,
consisting of seven members, four of whom were deaf and three were hearing. All panel
members were either fluent or native signers, who used ASL as their primary means of
communication. An additional part of this stage was the review of studies on sign
structure/vocabulary acquisition in ASL and BSL to ensure suitability for adaptation. Findings
suggested similar structures of the lexicons in the source (BSL) and target (ASL) sign languages,
consisting of a native lexicon, which is divided into a core and a noncore lexicon, and a
8
The core lexicon of the native lexicon comprises lexicalized (i.e., fingerspelling that looks like a
sign, e.g., NEWS), or established, signs (e.g., CAT, HOUSE, CAR) whereas the noncore lexicon
comprises agreement verbs (e.g., GIVE-TO, SAY-NO-TO) and pointing signs (e.g., YOU, I).
Other similarities relate to early sign development: findings from research that collected early
normative data from signing deaf children using an adapted version of the MacArthur
Communicative Development Inventory (for ASL: Anderson & Reilly, 2002; for BSL: Woolfe et
al., 2010) indicate overall similar developmental patterns by deaf children acquiring signed
language in a natural environment (from their deaf parent(s)).
Stages 2 & 3
During stages 2 & 3, two of the deaf native panel members reviewed the list of items
from the BSL vocabulary test and discussed whether these items were appropriate for use in
ASL. Both signers had previously taught at the school for the Deaf where the pilot was carried
out and were well acquainted with the sign vocabulary used by children in the target group. This
made it possible to control for regional variation. Given the smaller age range of the US target
group for the present study (6-10 years), only a subset of 80 items was considered for adaptation,
based on the performance of UK children in this age range. Following the discussions with the
deaf experts, 66 of these 80 items were accepted for adaptation without further changes and
could be translated directly to ASL. Of the remaining 14 items, 10 items required a change to the
target item (and development of new items). These included the sign for PARIS, which was
replaced by NEW YORK, in part because the sign in ASL is fingerspelled but also to make the
item more culturally appropriate. Three items required a change to the label, due to differences
between British English and American English. These items were ‘tap’ (‘faucet’ in American
9
Upon completion of the item revisions, the final list was presented to the Deaf experts, who
agreed that it was a representative sample of vocabulary items for the targeted age group.
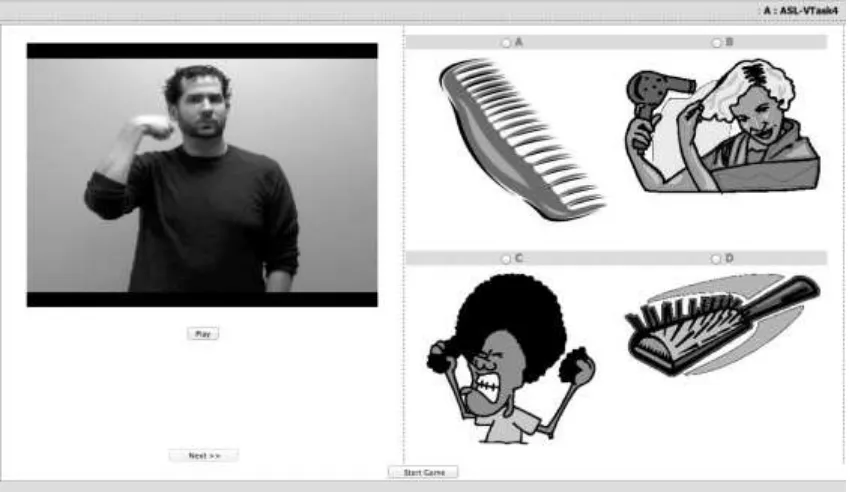
As in the BSL-VT, the multiple-choice format used for the two receptive tasks (i.e.,
meaning recognition; form recognition) consisted of four types of responses: the target, a
phonological distractor, a semantic distractor, and a visual distractor or an unrelated sign. These
responses were presented in random order within a 2 x 2 arrangement.
Phonological distractors were similar to the target item in that both shared one or more
phonological parameter (e.g., hand configuration, location, movement). In the example for
COOK (choice D), shown in Figure 1, the ASL sign CLEANER (choice A) is the phonological
distractor because it shares handshape and location with the target item but differs with regard to
movement (i.e., a flipping movement in the sign for COOK vs. a brushing movement in the sign
for CLEANER). Both signs share the final downwards movement, which indicates PERSON.
Similarly, semantic distractors were semantically related to the target item, as illustrated
10 Figure 1: Example of phonological and semantic distractors
One considerable challenge in developing a sign language vocabulary test refers to the
iconicity of signs (Jansma, Baker, & Knoors, 1997; Kyle, 1990; White & Tischler, 1999).
Iconicity is the presence of a relationship between a lexical item’s meaning and its phonological
form. Children, who encounter an unknown sign in a test may be able to correctly guess the
meaning by exploiting its iconic features (e.g., TELEPHONE in ASL which resembles the shape
of a telephone as the fist has thumb and little finger protruding, BIRD in BSL which makes
reference to a beak). To account for iconicity, we used two strategies: (a) we excluded items
from categories, which show high levels of iconicity in ASL (e.g., body parts, numbers) and (b)
included visual distractors, e.g., pictures that resembled the shape of the sign (Meaning
Recognition) or non-signs (gestures) that were similar to the shape of the object or action
presented in the picture (Form Recognition). For instance, the image of a person pulling out his
11
task, because the hand configuration and movement used for this sign resemble the picture
[image:12.612.72.499.161.409.2]response in Figure 2 (see choice ‘C’). The correct choice for this item was D.
Figure 2: Example of a visual distractor
Stage 4
In addition to Age of Acquisition data from a BSL norming study by Vinson and
colleagues (2008), we used a simplified version of the Mode of Acquisition (MoA) rating scale
by Wauters and colleagues (2003) for ASL as an additional validating measure of our target
items. MoA refers to the type of information children utilize in acquiring the meaning of a word or a sign (Wauters et al., 2008, p.175). It draws on the idea that knowledge of a word’s meaning
can be understood as the interrelated array of the many different associations one has with that
word, both linguistic associations but also expressions and perceptual associations. Recent
12
(Wauters et al., 2003, Wauters et al., 2008) and even signs (Tellings & Wauters, 2007) on a
five-point scale.
In the present study, we gave a list with glosses of our final target signs to all elementary
teachers at the participating school (N=12) and asked them to rate each ASL sign on a five-point
scale. All were (deaf) native or near-native signers and had, on average, more than ten years of
experience working with deaf children. A rating of one indicates a sign that is acquired mainly
through perception, e.g., FLOWER, HOUSE, whereas a rating of five indicates a sign that is
acquired mainly through linguistic information, e.g., UNIVERSE. A rating of three indicated that
the sign is acquired through a combination of perception and linguistic information, e.g.,
DISCUSSION. By using the MoA ratings, our aim was to validate the choice of target signs of
the ASL-VT as being appropriate for the targeted age range (6-10 years). Because our item pool
included a combination of concrete/imageable (e.g., BIKE) and abstract/less imageable signs
(e.g. WORK), we expected a spread of ratings across the scoring range. This is exactly what we
found: MoA ratings showed an average score of 2.4 (‘1’ = 3 (3.75%), ‘2’ = 44 (55%), ‘3’ = 24
(30%), ‘4’ = 9 (11.25%)). None of the signs received a rating of ‘5’ (‘learned through language’).
The lack of any such items and/or the smaller number of items rated as ‘4’ can be explained by
the constraints to find suitable pictures for these, more abstract, items.
Stage 4 also included the addition/revision of pictures to be used as target stimuli and/or
distractors. For the BSL-VT, Clipart (www.clipart), an online picture database, was used to
ensure consistency of style. For the ASL version, we worked with Dreamstime
(www.dreamstime) as an additional resource. In order to validate our target pictures for the ASL
version of the vocabulary tasks, we enlisted the help of 18 undergraduate students from the
13
all target items and asked to write down for each picture their 3 best guesses what it meant. Any
picture for which less than 50% of respondents guessed right was replaced. This happened in
four out of 80 cases.
Stage 5
During Stage 5, all target and distractor signs were videorecorded in high definition and
saved in flash player format so they could be uploaded to the web. We used the same two deaf
native signers as models, who had reviewed all target signs during Stage 2 and, thus, were highly
familiar with the test items and the procedure. The test introduction and instructions for each of
the four tasks were signed by another native signer, who was not part of the panel in a way that
was considered appropriate for children in the targeted age range.
Stage 6
Following the revisions of the instruction videos, we made a number of additional
changes to the (web-based) test format during Stage 6, which included moving the selection
buttons in the recognition tasks directly above each response to make it easier for the participant
to associate a response with an item. In the BSL-VT, all selection buttons are located below the
bottom response. We also changed the format of one of the tasks, meaning recall, by increasing
the number of responses to be generated by the test taker from one to three. This revision was
informed by recent work of Sheng and colleagues (2012) on spoken language. Our rationale for
adapting Sheng’s repeated meaning association task format was to collect more in-depth
information on deaf children’s representation and organization of semantic knowledge and to
document differences in their retrieval patterns of semantic associations (i.e., categorical and
14 Stage 7
During Stage 7, two members of the panel, both fluent in ASL and with a background in
linguistics, reviewed the test and distractor items for the two comprehension tasks (Tasks 2 + 4).
They were given a 3-point rating scale and asked to evaluate the quality of each item (including
pictures and signs), with ‘1’ suggesting major revisions or removal of the item, ‘2’
recommending minor revisions, e.g., replace one of the distractor signs, and ‘3’ indicating that
the item works well. Reviewers were asked to rate each item based on this scale and to make use
of the whole range. For any rating lower than ‘3’, they had to provide detailed comments. Based
on the reviewers’ comments changes were made for 19 items for the Form Recognition task
(Task 2), including 16 minor and 3 major revisions. For the Meaning Recognition task (Task 4),
changes were made for 22 items, including 21 minor and 1 major revisions. Minor revisions
generally required re-filming signs that were judged as less commonly known variants or
replacing distractor signs or images that were too close to the target. Major revisions included
replacing target/distractor signs or pictures that were not clear enough or too similar to the target.
Next, we administered the two receptive vocabulary tasks to a control group of 87
age-matched hearing children (M: 8;6 SD: 12.9 Range: 6;4 -11;2 years; 47 girls and 40 boys) with no
knowledge of ASL to measure whether our efforts to reduce unwarranted effects of iconicity
from the test were successful. The percentage of correct responses on the Form Recognition task
was 33.84 (SD: 7.22, Range: 15-50) and 28.48 (SD: 7.03, Range: 10-45) on the Meaning
Recognition task, both indicating that children performed above chance level (25%) although
only marginally. This result is similar to findings by Hermans et al. (2009), who administered a
receptive vocabulary task for Sign Language of the Netherlands (SLN) to a control group of 28
15
responses was 33.5% (Range: 21.3 - 42.6). For both tasks, the maximum amount of correct
responses is 80. As suggested by Hermans and colleagues, it is possible that hearing non-signers
are able to take advantage of the spoken components of the assessed sign language (e.g.,
mouthed words) in addition to or instead of the iconic features of a target sign to guess the
correct answer.
Stages 8 & 9
The next two stages included a pre-pilot and pilot testing of the completed set of test
items in order to finalize the prototype of the adapted ASL vocabulary test. The specific
procedures and results of the pilot testing and description of the psychometric properties of the
prototype are discussed in the next section.
In a pre-pilot, we asked two deaf adults to complete all vocabulary tasks and to provide
feedback on any items they considered problematic and/or suggestions of format-related
changes. This was done as an additional measure to ensure test validity. Both participants scored
close to 100% correct on all tasks (T1: 98%, 96%; T2: 91%, 95%; T3: 83%, 92%; T4: 95%,
94%). Based on the feedback, any final revisions were made and uploaded to the test website.
Participants
In the final stage (Stage 9), we piloted the test with a small group of deaf children (N=20,
8 boys and 12 girls) in the target age range (M=8;5, SD=1.3, range=6;3 -10;11 years). They
were recruited from a residential school for the Deaf in Central Texas. Ethical approval for the
study was obtained from the university prior to any testing. Only children with parental consent
were included. Biographical information on each participant was collected by means of a teacher
16
used, parental hearing status, and communication used at home. All children had at least one deaf
parent and acquired ASL from birth. Out of 14 students for whom this information was available,
71% per cent received free or reduced school lunches whereas 29% paid for their lunches. Three
of the remaining six students were residential students, who are not required to fill out an
application for reduced lunch and for the other three day students parents did not fill out
applications.
Measures administered in the pilot stage. In addition to the ASL-VT, participants also completed the ASL Receptive Skills Test (Enns & Herman, 2011), which assesses understanding of
syntactic and morphological aspects of ASL in deaf children between the ages of 3-12 years.
This test is in the process of being standardized. Given the posited close relationship between
vocabulary and wider language skills in spoken languages (Clark,1993), one might expect to find
deaf participants ASL-VT scores to be correlated with their performance on the ASL-RST.
Procedures
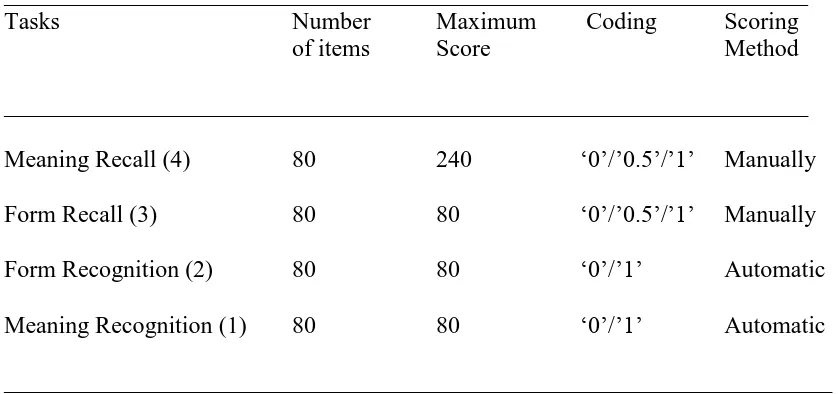
17 Table 3: Pilot version of the ASL-VT
___________________________________________________________________
Tasks Number Maximum Coding Scoring
of items Score Method
___________________________________________________________________
Meaning Recall (4) 80 240 ‘0’/’0.5’/’1’ Manually
Form Recall (3) 80 80 ‘0’/’0.5’/’1’ Manually
Form Recognition (2) 80 80 ‘0’/’1’ Automatic
Meaning Recognition (1) 80 80 ‘0’/’1’ Automatic
_____________________________________________________________________
The ASL-VT tasks were presented to each child individually in a quiet room at the
school, using a Macintosh computer with a 26-inch screen and internet access. We kept the same
overall administration format as used for the BSL version by administering the four tasks over
the course of two sessions, with two tasks per session. The order of administration was, as
follows: Form recall, form recognition (session one), meaning recall, meaning recognition
(session two). All participants completed the tasks in the same order, which was chosen to
minimize, where possible, learning effects. A deaf native signer, who worked at the school,
administered all ASL-VT testing and the non-verbal IQ in separate sessions. The ASL-RST was
administered separately by the hearing speech language pathologist, who used ASL on a daily
18
Results
Reliability
Reliability for internal consistency. Cronbach’s alpha measures were computed separately for
each form-meaning mapping measures. Because of the limited numbers available in each age
band, all ages were collapsed into one. The average alphas for the four mapping ranged from .54
to .94. Following guidelines set forth by Nunnally (1978), an alpha coefficient of at least .70 is
considered adequate for an instrument in early stages of development and a coefficient of at least
.80 to be adequate for a more developed instrument. Three of the four tasks, i.e., meaning recall
(.94), form recall (.86), and form recognition (.71), met these requirements whereas the
significance for the meaning recognition task was low (.55). As will be discussed later, this was
the least discriminating task for the immediate target population, with ceiling effects in the older
age groups (see below). Given these findings, a more detailed item analysis was carried out.
Item analysis. Item analysis showed that 12 items were passed by all participants on three of the four levels of vocabulary knowledge (meaning recognition, form recognition, and form recall)
but none of these items were passed by all participants on the meaning recall task. There was one
item in the form recognition task that was failed by all children. No one item was failed by all
participants across all four levels. While items that are not discriminating would normally be
taken out, this was not possible due to the structure of the test so they were retained. In addition,
this level of high performance is likely to be associated with the nature of the target sample of
school-aged children all of whom were deaf native signers with deaf parents (DCDP). One
19
and/or for the more heterogeneous group of deaf children with hearing parents (DCHP), who
represent the majority of the deaf population (90-95%, Mitchell & Karchmer, 2004).
Inter-rater reliability. Items from the two productive vocabulary tasks were coded by the first author and responses of 4 participants (20% of the sample) were coded independently by a
graduate student with background in sign language linguistics and fluent knowledge of ASL,
who was not involved in the study and blind to the results. Cohen's kappa was calculated to
determine the level of agreement between the raters’ judgments. Following the guidelines
provided by Landis and Koch (1977), the agreements between raters’ judgments for scoring the
form recall task (k=.91) and for scoring the meaning recall task (k=.85) were very good. Items
from the two receptive tasks were automatically scored by the computer upon selection of the
response.
Validity
Content Validity. Evidence in support of content validity was collected in two ways: by working closely with an expert panel, which included deaf native signers, on the development of the
target and distractor items (see stage 1 of task adaptation). This led to revisions of 14 items. In
addition, we used MoA ratings by teachers of the Deaf for our test items (see stage 4 of task
adaptation) to evaluate the type of information (or combination of types) used by children to
acquire these items. Findings showed a spread of ratings over most of the range with exception
of items (rated as ‘5’) that are acquired exclusively through language. As suggested, this may be
due to the format of the test, which requires any item to be presented as a picture.
20
then investigated differences between participants’ performances across tasks. Mean
[image:21.612.72.523.174.394.2]performance scores on the four ASL-VT tasks for the total sample (N=20) are shown in Table 4.
Table 4: Percentage scores for the vocabulary tasks
___________________________________________________________________________
Test scores Mean % SD Range
___________________________________________________________________________
Meaning recall (4) 58.83 8.63 34-70
Form recall (3) 85.13 8.02 66-98
Form recognition (2) 88.88 5.19 80-96
Meaning recognition (1) 91.94 4.17 84-99
___________________________________________________________________________
Bivariate correlations between each of the tasks and age were computed, using a Pearson
correlation coefficient, with the alpha reduced to .013 for multiple comparisons, k=4. These
correlations are presented in Table 5.
Table 5: Correlation between age and ASL-VT raw scores
___________________________________________________________________________
Variable Meaning (1) Form (2) Form (3) Meaning (4) Recognition Recognition Recall Recall
___________________________________________________________________________
Age 0.49* 0.68** 0.63** 0.43 ns
[.08-.79] [.37-.89] [.35-.84] [-.01-.77]
___________________________________________________________________________ Ns = not significant, *<.05 **p<.01, BCa bootstrap 95% CIs reported in brackets
[image:21.612.69.526.531.647.2]21
regulations. The correlations were run a second time, using bootstrapped confidence intervals to
account for the small sample size. No differences were found.
Next, we tested the construct validity of the items based on the order of difficulty,
predicted by the model of strength of form-meaning mapping (see Table 1). Findings from
previous research on the BSL version of the test had confirmed the validity of the model (Mann
& Marshall, 2012). However, because the target populations differed and test adaptations carried
out (see above), it is important to investigate the construct validity of the ASL version.
Accordingly, we conducted a repeated measures analysis of variance (ANOVA), using a
one-level design with task (form recall, form recognition, meaning recall, meaning recognition) as the
within -participant repeated measure. Effect sizes (ηρ²) were calculated and interpreted using
Cohen’s criteria of small, medium, and large effects: .01= small, .06=moderate, .14= large
(Cohen, 1988). Prior to examining the repeated measures ANOVA results, the assumption of
sphericity was tested and Greenhouse-Geisser correction was applied. Results showed a main
22 Figure 3. ASL-VT mean scores in % by task. Error bars denote 95% confidence intervals.
Post-hoc tests with Bonferroni corrections showed that participants scored higher on form
recall than meaning recall (p<.001); higher on meaning recognition than form recall (p<.01);
higher on form recognition than meaning recall (p<.001); higher on meaning recognition than
form recognition (p<.05); higher on meaning recognition than meaning recall (p<001); and
higher on form recognition than form recall (p=.09) but fell short of significance on the last
comparison in this small sample. Together, these results demonstrate that knowledge of
form-meaning mappings improves with age and that the different tasks tap the strength of these
mappings to differing extents, with meaning recognition being the easiest task, followed by form
23
repeated calculations with age as covariate did not show any differences.
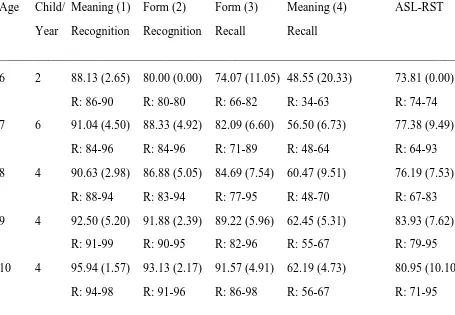
Concurrent Validity. To collect evidence for concurrent validity, we compared participants’
performance on the four vocabulary tasks with their ASL-RST scores. The mean raw scores
(SDs) by age group were, as follows: 6 yr.: 31, (0); 7yr.: 32.5 (3.99); 8yr.: 32.0 (3.16); 9yr.:
35.25 (3.20); 10yr.: 34.5 (4.2). In order to compare these results with ours we converted the raw
[image:24.612.73.528.330.645.2]sores to percentage correct scores (see table 6), with a mean group score of 78.81 (8.32).
Table 6: Pilot testing results
___________________________________________________________________________________________
Mean Performance in % (SD) and range
Age Child/ Meaning (1) Form (2) Form (3) Meaning (4) ASL-RST
Year Recognition Recognition Recall Recall
___________________________________________________________________________________
6 2 88.13 (2.65) 80.00 (0.00) 74.07 (11.05) 48.55 (20.33) 73.81 (0.00)
R: 86-90 R: 80-80 R: 66-82 R: 34-63 R: 74-74
7 6 91.04 (4.50) 88.33 (4.92) 82.09 (6.60) 56.50 (6.73) 77.38 (9.49) R: 84-96 R: 84-96 R: 71-89 R: 48-64 R: 64-93
8 4 90.63 (2.98) 86.88 (5.05) 84.69 (7.54) 60.47 (9.51) 76.19 (7.53)
R: 88-94 R: 83-94 R: 77-95 R: 48-70 R: 67-83 9 4 92.50 (5.20) 91.88 (2.39) 89.22 (5.96) 62.45 (5.31) 83.93 (7.62)
R: 91-99 R: 90-95 R: 82-96 R: 55-67 R: 79-95
10 4 95.94 (1.57) 93.13 (2.17) 91.57 (4.91) 62.19 (4.73) 80.95 (10.10)
R: 94-98 R: 91-96 R: 86-98 R: 56-67 R: 71-95 _____________________________________________________________________________________________
Bivariate correlations between each of the vocabulary measures and performance on the
24
score and meaning recognition, R(20) = .049, p = .836, form recognition, R(20) = .144, p = .544,
form recall, R(20) = .058, p = .808, or meaning recall, R(20) = .114, p = .632. A repeated set of
calculations with age partialed out did not show any differences. This finding was unexpected
and against prediction. However, inspection of the distribution of scores on the vocabulary tasks
and ASL-RST revealed some similarities between the ASL-VT and ASL-RST in their profiles
across age bands (see table 5). These include considerable overlap in score ranges across age
bands, and very small (or no) progression for children between the ages of 7-8 years and between
9-10 years. The limited progression is particularly visible in younger children’s performance on
the two recognition tasks and the ASL-RST and in older children’s performance on the meaning
recall task of the ASL-VT. This lack of systematic progression across age groups with older
groups achieving marginally lower mean scores than their younger peers at times is probably
crucial in understanding the lack of expected correlations between the ASL-VT and ASL-RST.
For all measures the most marked performance gains were found from the youngest age group of
6 year-olds to the next 7 year-old age band.
Discussion
This study described the adaptation process of a vocabulary knowledge test for British
Sign Language (BSL) into American Sign Language (ASL). Because one of the main aims of the
present study was to develop a vocabulary assessment measure for ASL that worked in a similar
way to the BSL-VT, we examined a number of psychometric properties of the ASL version of
the vocabulary tasks. Our analyses of reliability revealed that the internal consistency of three of
25
Possible explanation for the low correlation coefficient for the fourth task, meaning recognition,
include the highly proficient signing skills of the target group (DCDP), the low strength of
form-meaning mapping for this task according to our underlying model, and a possible learning effect
over the course of the task administration. Inter-rater reliability for the production tasks was
sufficiently high although the live assessment of the appropriateness of responses for the
meaning recall task remains challenging. We are working towards developing a corpus of
acceptable associations.
In addition, we took a number of steps to evaluate different types of validity of the
ASL-VT, including content validity, construct validity, and concurrent validity. The evidence we
collected in support of content validity included feedback by a panel of deaf and hearing experts
related to the target and distractor items as well as feedback by a group of undergraduate students
on the quality and clarity of the test images. In addition, we collected Mode of Acquisition
(MoA) ratings of our target items reflect the range/spread of item types from concrete to abstract
signs. Findings showed that the items are less abstract (no level 5 rated items) for the older group
of participants than would be the case in a task for hearing children in that age range. The lack of
any (high) ratings describing signs, which are learned exclusively through language (e.g.,
UNIVERSE) suggests that the ASL-VT in its current (abbreviated) form would need more
abstract/less imageable items in order to make the test equally challenging for children beyond
the tested age groups (10+ years). This raises a couple of important issues related to one of our
tasks, form recall, which uses a picture-naming format. While this format has been
commonly/successfully used in many standardized vocabulary tests for spoken language,
including the Expressive One Word Picture Vocabulary Test (EOWPVT, Brownell, 2000) or the
26
signed languages, one being the availability of images for highly abstract words or signs. The
way names are used to refer to pictures has been shown to vary across languages; also, less
normative data has been collected for pictorial stimuli, compared to verbal stimuli. As a result,
the comparison of studies that used pictorial stimuli becomes difficult because the stimuli used in
these studies were different (Sanfeliu & Fernandez, 1996).
An additional limitation of using picture-naming tasks in signed language tests may be
the common use of fingerspelling or initialized signs for more abstract items. Fingerspelling is
used to spell words for which no sign exists e.g. technical terms, names, or locations, to spell
words for signs that the signer does not know, or to clarify a sign unfamiliar to the conversation
partner. An initialized sign combines an existing sign with a manual alphabet handshape
corresponding to the first letter of an English word, e.g., GROUP, FAMILY, WORLD. The
extent to which fingerspelling is used in signed languages differs. For instance, ASL users are
known to make more use of fingerspelling while this is less the case for users of Turkish Sign
Language (Kubus & Hohenberger, 2011) or signed languages of Eastern Europe (Bickford,
2005). Initialized signs are often used as part of signed English (SE), a system of manual
communication to represent English. Little detail is known on differences in the use of
fingerspelling and initialized signs in ASL and BSL (e.g., Cormier, Schembry, & Tyrone, 2008).
While we acknowledge the paucity of age-appropriate, more abstract signs that are not
fingerspelled as a constraint to our range of item difficulty, this potential limitation is at least
partially compensated for by our other recall task, meaning recall, which requires children to
know the meaning of an item in order to generate associations. This highlights the versatility of
the ASL-VT, which does not just reveal levels of difficulty for any one child but goes some way
27
recall task produced a range of results and was positively associated with age, which makes it the
most comparable of the four tasks with other vocabulary tests that use this format.
To evaluate construct validity, we examined whether the four ASL vocabulary tasks tap
the strength of the form-meaning mapping to differing extents and whether the resulting
hierarchy of the degrees of strength is comparable to BSL. Our results show that this was the
case. Similar to the UK study, we found that deaf children in the US performed highest on the
meaning recognition task, followed by the form recognition task and experienced more
difficulties with the two recall tasks – form recall and meaning recall. However, there were some
differences between the two groups: the difference between children’s performances on the two
recall tasks was not significant in BSL (p=0.15) at the reduced alpha level we had adopted in our
analyses whereas it showed significance in ASL (p<.001). This is likely to be a result of our
modification of the meaning recall task in the ASL version - participants were asked to produce
three signed responses compared to one response in the BSL version - which made the task more
challenging. Another difference in task performance on the ASL/BSL version was observed
between form recall and form recognition. This difference was significant in BSL (p<.001) but
not in ASL (p=.09). One possible explanation for this is the smaller set of items that was used for
the ASL version (only a subset of 80 out of 120 items were adapted for ASL), which may have
lacked more difficult items for the form recall task. This is supported by our findings of near
ceiling effects on the easier tasks (meaning recognition, form recognition) of the ASL-VT,
evident in our current sample of native signers, which are not apparent on the more difficult tasks
(form recall, meaning recall). The main rationale for adapting a smaller item subset for ASL was
the smaller age range of the American sample, i.e., 6-10 years, compared to the BSL version, i.e.,
28
Overall, our findings from ASL support an earlier claim by Mann and Marshall (2012)
that signers’ knowledge of the mapping between form and meaning is not an all-or-nothing
phenomenon but depends on what they are required to do with the knowledge. More specifically,
it shows that recall requires a stronger mapping than recognition and signers, who successfully
recall the form of a sign or supply another sign, or several signs, with an associated meaning
would be also expected to recognize that sign’s form or meaning, as predicted by our underlying
model of strength of form-meaning mappings. The presented findings suggest that this model
seems to hold across signed languages.
Finally, as a measure of concurrent validity, we compared participants’ ASL-VT scores
to their performance on the ASL-RST, an assessment instrument recently adapted from BSL,
which targets morpho-syntactic skills in deaf children between the ages of 4-13 years. While
none of the four vocabulary measures correlated significantly with the ASL-RST, both tests
showed similarities in their profiles across age bands, which included considerable overlap in
score ranges across age bands, and very small (or no) progression for children between the ages
of 7-8 years and between 9-10 years. These findings are similar to studies that used the
ASL-RST (Enns & Allen, 2013; Enns & Hermann, 2011), which showed relatively little progression
within the age range that was targeted in this study (6-10 years). The lack of systematic
progression across age groups observed in some of the tasks of the VT and also in the
ASL-RST raises another important issue pertaining to signed language tests, which is the development
of items that are equally challenging for the sub-groups within the larger signing population(s)
involved. Because of the small percentage of deaf children with deaf parents (DCDP) within the
deaf population (5-10%, Mitchell & Karchmer, 2004), finding such a sample large enough to
29
whether/to what extent these norms represent the larger population of deaf children with hearing
parents (DCHP), whose signing skills are much more variable. Issues around the
‘representativeness’ of norming samples are not limited to signing populations. However, in
contrast to the hearing population, their mixed experiences and exposure to ASL/BSL as opposed
to other forms of communication present an additional confound in establishing normative data
for signing populations (see Mann, Roy, & Marshall, 2013, for a discussion). One way to
approach this issue is to develop norms for larger combined DCHP and DCDP populations and
report sub-groups means to support finer interpretations of individuals’ performance within those
groups.
A possible explanation for the lack of any significant correlations between the ASL-VT
and the ASL-RST scores could be the different nature of tasks: the ASL-VT assesses children’s
strength of semantic knowledge of single ASL signs whereas the ASL-RST measures their
understanding of ASL grammar in phrases and sentences, including negation, number and
distribution, and noun-verb distinction. Another reason may be the difference in sample of test
takers, especially the age range which is much wider for the ASL-RST (4-12 years) compared to
the ASL-VT (6-10 years).
Other directions for future studies include the comparison of deaf children’s vocabulary
knowledge across different signed languages. While the findings we report for deaf native
signers from the US indicate a hierarchy of strength of vocabulary knowledge that is similar to
findings for deaf native signers from the UK (Mann & Marshall, 2012) this needs to be studied in
more detail on larger, age-matched, samples. Finally, taken into account the bilingual status of
many deaf language users, an adaptation of our test for spoken English suggests itself as a
30
signing deaf children, whose English skills are in general assessed based on standardized tests
developed for a different target group, i.e., hearing children, and/or deaf children who are using
spoken language as their dominant language or have been trained exclusively oral.
Conclusion
We have set out to report in a very detailed way a procedure for adapting tests from one
signed language to another. The work we reported here on the adaptation of the BSL vocabulary
tasks to ASL is still in progress and awaits standardization on a larger sample. Nevertheless, the
presented findings make a number of valuable contributions to the field of language assessment
both practical and theoretical. From a practical point of view, the tasks provide practitioners with
a tool to assessing different levels of deaf children’s vocabulary knowledge. From a theoretical
perspective, our work contributes to the comparison of vocabulary development between deaf
learners using different sign languages. Findings from our work on BSL and ASL suggest that
the construct of vocabulary knowledge as different degrees of strength of the mapping between
form and meaning of signs holds for these two sign languages. This encourages the adaptation of
the tasks for other signed languages. At the time, it stresses the need for test ‘adaptation’ as
opposed to translation that takes into account cultural differences and goes beyond the simple
substitution of words such as New York for Paris.
Finally, our work addresses some key issues faced by spoken language test developers,
including construct definition and validation of language assessments, assessment of smaller,
non-mainstream populations, assessment of vocabulary knowledge, and the impact of technology
31
minority spoken languages, especially where there is limited or no linguistic research in part due
to the small number of native speakers. These parallels encourage more active collaborations
32
Acknowledgments
This research was supported by a Marie Curie International Outgoing Research
Fellowship within the 7th European Community Framework Programme awarded to the first
author. The authors would like to thank the team of deaf experts who helped adapting the
vocabulary tasks to ASL, Mark Gobble, Mike Wynn, & Leah Geer for modeling all target and
distractor signs, Lynn Hou and Leah Geer for reviewing the target and distractor items, and
David Simmons for signing the ASL instructions. We would also like to thank David
Quinto-Pozos, Richard Meier, and Stephanie Cawthon for their comments on the test format. We are
very much indebted to the three anonymous reviewers for their insightful comments on earlier
versions of this work. Finally, we would like to express our gratitude to all the children, parents,
33
References
Allen, T. E. (2014). The Deaf Community as a “Special Linguistic Demographic”: Diversity
Rather Than Disability as a Framework for Conducting Research with Individuals Who
Are Deaf. In E. Orfanidou, B. Woll, & G. Morgan (Eds.), Research Methods in Sign Language Studies: A Practical Guide (21-40). Wiley-Blackwell.
Anderson, D., & Reilly, J. (2002). The MacArthur communicative development inventory:
normative data for American Sign Language. Journal of Deaf Studies and Deaf Education, 7(2), 83-106.
Authors (submitted). Child Modifiability as Predictor of Language Impairment in Deaf Children
who use American Sign Language. American Journal of Speech Language Pathology.
Bickford, J. A. (2005). The signed languages of Eastern Europe. SIL International. Brownell, R. (2000). Expressive One-Word Picture Vocabulary Test. Novato, CA:
Academic Therapy Publications.
Cohen, J. (1988). Statistical power analysis for the behavioral sciences (2nd ed.) New York:
Academic Press.
Clark, E.V. (1993). The Lexicon in Acquisition. Cambridge: Cambridge University Press.
Cormier, K., Schembri, A., & Tyrone, M. E. (2008). One hand or two? Nativisation
of fingerspelling in ASL and BANZSL. Sign Language & Linguistics, 11(1), 3-44.
Dunn, L. M., & Dunn, D. M. (1997). Peabody Picture Vocabulary Test. Circle
Pines, MN: American Guidance Service. Inc. Publishing.
34
Development: Receptive Skills Test Into American Sign Language. Journal of deaf studies and deaf education, 16(3), 362-374.
Fenson, L., Dale, P. S., Reznick, J. S., Thal, D., Bates, E., Hartung, J.P., & Reilly, J.S. (1993).
MacArthur Communicative Development Inventories: User's Guide and Technical Manual. Singular Publishing Group. San Diego, CA.
Haug, T. (2012). Methodological and theoretical issues in the adaptation of sign language tests:
An example from the adaptation of a test to German Sign Language. Language Testing,
29(2), 181-201.
Haug, T., & Mann, W. (2008). Adapting tests of sign language assessment for other sign
languages—A review of linguistic, cultural, and psychometric problems. Journal of Deaf Studies and Deaf Education, 13(1), 138-147.
Herman, R., Holmes, S., & Woll, B. (1999). Assessing BSL Development - Receptive Skills Test.
Coleford, UK: The Forest Bookshop.
Hermans, D., Knoors, H., & Verhoeven, L. (2009). Assessment of sign language development:
The case of deaf children in the Netherlands. Journal of Deaf Studies and Deaf Education, enp030.
Jansma, S., Baker, A. E., & Knoors, H. (1997). Sign Language Assessment: A Dutch Project.
Deafness and Education, 21(3), 39-46.
Kaplan, E., Goodglass, H., & Weintraub, S. (1978). Boston naming test. Boston: Kapplan & Goodglass.
35
children using the universal nonverbal intelligence test. Journal of Psychoeducational Assessment, 22(4), 338-350.
Kubus, O., & Hohenberger, A. (2011). The phonetics and phonology of the TİD (Turkish Sign
Language) bimanual alphabet1. Formational Units in Sign Languages, 3, 43-63. Kyle, J. (Ed.)(1990). Deafness and Sign Language into the 1990’s. Deaf Studies Trust.
Laufer, B., Elder, C., Hill, K., & Congdon, P. (2004). Size and strength: do we need both to
measure vocabulary knowledge?. Language testing, 21(2), 202-226.
Laufer, B., & Goldstein, Z. (2004). Testing vocabulary knowledge: Size, strength, and computer
adaptiveness. Language Learning, 54(3), 399-436.
Landis, J. R., & Koch, G. G. (1977). The measurement of observer agreement for categorical
data. biometrics, 159-174.
Mann, W., & Haug, T. (2014). Mapping Out Guidelines for the Development and Use of Sign
Language Assessments: Some Critical Issues, Comments and Suggestions. In D.
Quinto-Pozos (Ed.), Multilingual Aspects of Signed Language Communication and Disorder (pp. 123-142). Multilingual Matters.
Mann, W., & Marshall, C. (2012). Investigating deaf children's vocabulary knowledge in British
Sign Language. Language Learning, 62(4), 1024-1051.
Mann, W., Roy, P., & Marshall, C. (2013). A Look at the Other 90 Per Cent: Investigating
British Sign Language Vocabulary Knowledge in Deaf Children from Different
Language Learning Backgrounds. Deafness & Education International, 15(2), 91-116. Mayberry, R. I., & Eichen, E. B. (1991). The long-lasting advantage of learning sign language in
36
Meir, I. (2012). The evolution of verb classes and verb agreement in sign languages.
Theoretical Linguistics,38(1-2), 145-152.
Mitchell, R. E., & Karchmer, M. A. (2004). Chasing the mythical ten percent: Parental hearing
status of deaf and hard of hearing students in the United States. Sign Language Studies,
4(2), 138-163.
Morford, J. P., & Mayberry, R. I. (2000). A reexamination of “early exposure” and its
implications for language acquisition by eye. Language acquisition by eye, 111-127. Nunnally, D.J., (1978). Psychometric theory (2nd ed.). New York: McGraw-Hill.
Sanfeliu, M. C., & Fernandez, A. (1996). A set of 254 Snodgrass-Vanderwart pictures
standardized for Spanish: Norms for name agreement, image agreement, familiarity, and
visual complexity. Behavior Research Methods, Instruments, & Computers, 28(4),
537-555.
Sheng, L., Peña, E. D., Bedore, L. M., & Fiestas, C. E. (2012). Semantic deficits in Spanish-
English bilingual children with language impairment. Journal of Speech, Language and Hearing Research, 55(1), 1-15.
Sutton-Spence, R. & Woll, B. (1999). The linguistics of British Sign Language: an
introduction. Cambridge University Press.
Tellings, A.E. & Wauters, L.N. (2007). Mode of acquisition ratings of word and sign meanings
by deaf adults in the Netherlands, Unpublished manuscript.
37
Sign Language (BSL) norms for age of acquisition, familiarity, and iconicity. Behavior Research Methods, 40(4), 1079-1087.
Wauters, L. N., Tellings, A. E., van Bon, W. H., & Mak, W. M. (2008). Mode of acquisition as a
factor in deaf children's reading comprehension. Journal of Deaf Studies and Deaf Education, 13(2), 175-192.
Wauters, L. N., Tellings, A. E., Van Bon, W. H., & Van Haaften, A. W. (2003). Mode of
acquisition of word meanings: The viability of a theoretical construct. Applied Psycholinguistics, 24(03), 385-406.
White, A., & Tischler, S. (1999). Receptive sign vocabulary tests: tests of single-word
vocabulary or iconicity? American Annals of the Deaf, 144(4), 334-338.
Woolfe, T., Herman, R., Roy, P., & Woll, B. (2010). Early vocabulary development in deaf
native signers: a British Sign Language adaptation of the communicative development