City, University of London Institutional Repository
Citation
:
Banti, Chiara (2013). Essays in FX market microstructure. (Unpublished Doctoral thesis, City University London)This is the unspecified version of the paper.
This version of the publication may differ from the final published
version.
Permanent repository link:
http://openaccess.city.ac.uk/2956/Link to published version
:
Copyright and reuse:
City Research Online aims to make research
outputs of City, University of London available to a wider audience.
Copyright and Moral Rights remain with the author(s) and/or copyright
holders. URLs from City Research Online may be freely distributed and
linked to.
City Research Online: http://openaccess.city.ac.uk/ [email protected]
ESSAYS IN FX MARKET MICROSTRUCTURE
Chiara Banti
A Thesis submitted for the degree of Doctor of Philosophy in Finance
Cass Business School
City University London
Contents
Introduction 1
1 Global Liquidity Risk in the Foreign Exchange Market 11
1.1 Introduction . . . 11
1.2 Literature review . . . 13
1.2.1 Liquidity and the FX market . . . 13
1.2.2 Measures of liquidity . . . 14
1.2.3 Liquidity risk premium . . . 15
1.3 Data . . . 16
1.3.1 Description of the data . . . 16
1.3.2 Descriptive statistics . . . 18
1.4 Methodology . . . 19
1.4.1 Construction of the liquidity measure . . . 19
1.4.2 Estimation of a common liquidity measure . . . 20
1.4.3 Liquidity-sorted portfolios . . . 21
1.4.4 Empirical asset pricing and the FX liquidity risk premium . . . 22
1.5 Empirical results . . . 23
1.5.1 The FX liquidity measure . . . 23
1.5.2 Is there a liquidity risk premium? . . . 24
1.5.3 Liquidity risk: a priced common risk factor . . . 25
1.6 Further analysis . . . 26
1.6.1 Liquidity risk premium: extension . . . 26
1.6.2 Alternative liquidity measures . . . 27
1.6.3 Emerging market currencies . . . 29
1.6.4 Crisis period . . . 29
1.7 Robustness checks . . . 31
1.7.1 Volume-weighted common liquidity . . . 31
1.7.2 Different rebalancing horizons . . . 32
1.8 Conclusions . . . 32
2 FX market illiquidity and funding liquidity constraints 49 2.1 Introduction . . . 49
2.2 Literature review . . . 52
2.2.1 Liquidity and the FX market . . . 52
2.2.2 Measures of market liquidity . . . 54
2.2.3 Estimation of funding liquidity . . . 55
2.3 Methodology . . . 56
2.3.1 Estimation of FX market liquidity . . . 56
2.3.2 Identifying the determinants of market liquidity . . . 58
2.4 Empirical analysis . . . 59
2.4.1 Preliminary analysis of the data . . . 59
2.4.2 Regression analysis . . . 61
2.5 Robustness tests . . . 66
2.5.1 Market depth and funding liquidity . . . 66
2.5.2 GMM estimation . . . 69
2.5.3 Unexpected changes in FX market illiquidity . . . 70
2.6 Conclusions . . . 71
3 Illiquidity in the stock and FX markets 89 3.1 Introduction . . . 89
3.2 Institutional features of NYSE/AMEX and the FX market . . . 92
3.3 Cross-market illiquidity linkages: from theory to empirical investigation 93 3.4 Data . . . 95
3.4.1 Measuring illiquidity: transaction costs . . . 95
3.4.2 Market volatility and returns . . . 96
3.4.3 Data description . . . 96
3.4.4 Preliminary analysis . . . 97
3.5 The dynamics of illiquidity in the stock and FX markets . . . 98
3.5.1 Contemporaneous correlation of VAR innovations . . . 99
3.5.2 Cross-market causality . . . 99
3.5.3 Do illiquidity shocks in one market affect illiquidity in the other market? . . . 99
3.6 The role of funding liquidity . . . 101
3.6.1 Identifying funding liquidity . . . 101
3.6.2 Contemporaneous correlation of VAR innovations . . . 102
3.6.4 Do shocks to funding liquidity affect illiquidity in the stock and FX markets? . . . 103
3.6.5 Focus on the impact of funding liquidity shocks on market illiquidity104
3.7 Do funding liquidity conditions in developed countries affect FX
emerg-ing markets? . . . 105
3.8 Conclusions . . . 106
List of Tables
1.1 Descriptive statistics of log returns . . . 34
1.2 Descriptive statistics of order flow data . . . 35
1.3 Regression of returns on order flow . . . 36
1.4 Regression of currencies’ liquidity on common liquidity . . . 37
1.5 Descriptive statistics of the portfolios . . . 38
1.6 Results of the cross-sectional pricing analysis . . . 39
1.7 Alternative liquidity measure: Kyle’s lambda . . . 40
1.8 Alternative liquidity measure: accounting for serial correlation in returns 41 1.9 Portfolio for emerging markets and less traded developed countries . . . 42
1.10 Crisis period: portfolio analysis . . . 43
1.11 Analysis with volume-weighted currencies . . . 44
1.12 Analysis with 1-month and 3-month rebalancing . . . 45
2.1 Descriptive statistics of changes in FX market illiquidity and changes in financial commercial paper interest rate . . . 76
2.2 Correlation matrix . . . 77
2.3 Determinants of FX market illiquidity . . . 78
2.4 FX market illiquidity and market returns . . . 79
2.5 Market illiquidity and crisis episodes . . . 80
2.6 Descriptive statistics of changes in market depth . . . 81
2.7 Market depth and funding liquidity . . . 82
2.8 Analysis of the determinants of shocks to FX market illiquidity . . . 83
3.1 Descriptive statistics of illiquidity, volatility and market return in the stock and FX markets . . . 108
3.2 Contemporaneous correlation matrix . . . 109
3.3 Unit root tests . . . 110
3.4 Contemporaneous correlation of VAR innovations . . . 111
3.6 Contemporaneous correlation of VAR innovations including funding liq-uidity . . . 113
List of Figures
1.1 FX market liquidity level and its innovations . . . 46
1.2 Cumulative excess returns of portfolios . . . 47
1.3 Crisis period analysis: Innovation in common liquidity and cumulative excess returns of portfolios . . . 48
2.1 Changes in FX market illiquidity . . . 84
2.2 Changes in financial commercial paper interest rate . . . 85
2.3 Changes in TED spread . . . 86
2.4 Global FX volatility . . . 87
2.5 Changes in monthly FX market depth . . . 88
3.1 Illiquidity level of the stock and FX markets . . . 115
3.2 GIRFs of illiquidity . . . 116
3.3 GIRFs of illiquidity and volatility . . . 117
3.4 GIRFs of illiquidity and market returns . . . 118
3.5 GIRFs of illiquidity during the financial crisis of 2007-2009 . . . 119
3.6 GIRFs of illiquidity, volatility and market returns during the financial crisis of 2007-2009 . . . 120
3.7 GIRFs of illiquidity and funding liquidity . . . 122
3.8 GIRFs of illiquidity and funding liquidity during the financial crisis of 2007-2009 . . . 125
3.9 GIRFs of illiquidity and funding liquidity during the financial crisis of 2007-2009 with restrictions on the impact of funding liquidity constraints on the FX market . . . 128
3.10 FX common illiquidity level in emerging markets . . . 129
Acknowledgment
I am extremely grateful to my supervisors Kate Phylaktis and Lucio Sarno for their continuous guidance and support. Their patience and kindness have been an invaluable
source of strength throughout the last four years.
I should also thank Giovanni Cespa, Sonia Falconieri, Ian Marsh and Richard Payne
for precious discussions and encouragement.
I am very grateful to my parents Gabriella and Mauro, my brothers Paolo and Fabio
Declaration
I grant powers of discretion to the University Librarian to allow the thesis to be copied in whole or in part without further reference to me. This permission covers only single
copies made for study purposes, subject to normal conditions of acknowledgement.
I declare that the first paper included in the main body of the thesis, ‘Global
Liq-uidity Risk in the Foreign Exchange Market’, is co-authored with my PhD supervisors
Prof. Kate Phylaktis and Prof. Lucio Sarno and published in the Journal of
Interna-tional Money and Finance. I also declare that the second paper, ‘FX Market Illiquidity
and Funding Liquidity Constraints’, is co-authored with my PhD supervisor Prof. Kate
Abstract
The thesis presents three papers in the field of international finance and provides a study of the foreign exchange (FX) market from a microstructure perspective. From the empirical identification of a common component in liquidity across currencies, re-ferred to as FX market liquidity, the thesis investigates its asset pricing implications, determinants and cross-market dynamics.
The first paper is an empirical study of global liquidity risk in the FX market. Estimating liquidity with the Pastor-Stambaugh measure originally developed for the stock market, the paper documents strong liquidity commonality across currencies. Given this observation, it estimates a measure of global FX liquidity risk and shows that the risk is priced in the cross-section of currency returns. It finally evaluates the associated risk premium at around 4.7 percent per annum.
The second paper provides an empirical analysis of the determinants of the time vari-ation in FX market liquidity documented in the first paper. Employing two measures of liquidity, transaction costs and the Pastor-Stambaugh measure from the first paper, the study finds a significant role of traditional determinants, such as global volatility, market returns and seasonality, and of funding liquidity constraints to explain both aspects of market liquidity.
Abbreviations
List of the abbreviations used for currencies:
AUD Australian dollar BRL Brazilian real CAD Canadian dollar CHF Swiss franc CLP Chilean peso CZK Czech koruna DKK Danish krone DM Deutsche mark
EUR euro
GBP UK pound sterling HUF Hungarian forint JPY Japanese yen KRW Korean won MXN Mexican peso NOK Norwegian kroner NZD New Zealand dollar PLN Polish zloty
SEK Swedish krona SGD Singaporean dollar TRY Turkish lira
USD US dollar
Introduction
Background to the study
The study of foreign exchange (FX) market microstructure has received an increasing
attention by researchers in the last decade.
Traditionally, exchange rate determination has been related to fundamentals.
Throughout the Bretton Woods era, models of exchange rate determination were
re-lated to the conditions of demand and supply in goods markets. Following the end of
the Bretton Woods system of fixed exchange rates in the 1970s, models of exchange
rate determination were extended to the conditions of demand and supply of currencies
to purchase and sell assets. In particular, the dominant flexible-price model related
ex-change rates to the instantaneous adjustment of domestic prices to ex-changes in domestic money supply. As major countries adopted freely floating exchange rate regimes, their
currencies exhibited strong volatility. From this empirical observation, an alternative
monetary model was developed departing from the assumption of automatic
adjust-ments in prices underlying the flexible-price model. Relaxing the assumption of perfect
substitutability between domestic and foreign assets, the portfolio balance model
iden-tified equilibrium exchange rates by the conditions on the bond and money markets.
Finally, open-economy macro models emerged in the mid-1990s. Relying on dynamic
general equilibrium models, these more comprehensive frameworks include frictions in
both goods and assets markets to give a more realistic account of the determination of
exchange rates.
While theoretically appealing, these models do not provide significant results once
their empirical predictions are applied to the data. From the seminal paper of Meese
and Rogoff (1983), a large body of literature has empirically investigated the theoretical
implications of the traditional models and established their lack of determination power.
Following the poor empirical performance of traditional macroeconomic models, a
new strand of literature emerged to explain the movements in exchange rates by
depart-ing from some important assumptions underlydepart-ing macro models. The new approach
to exchange rates is based on the intuition that the structure of the market in which
the new models, referred to as microstructure models, recognize the importance of considering the presence of private information, heterogeneity of market participants
and institutional characteristics of the market itself as relevant factors for the
deter-mination of exchange rates. The role of information is especially important for the
price formation mechanism. While traditional models generally assumed information
to be publicly available to a group of homogeneous agents, the microstructure approach
differentiates among market participants with respect to the information available to
them, which may not be available simultaneously to all participants. In addition, even
when information is public, these models recognize that different market participants
may interpret it differently. In this respect, the analysis of the interaction of agents with different characteristics is essential to the price formation mechanism in the
mi-crostructure framework.
In support of this approach, the FX market is characterized by the presence of a
variety of market participants with distinct trading strategies and objectives. In
par-ticular, the FX market is composed of two main levels. At the retail level, customers place currency orders with their banks and financial intermediaries in general. Once
the intermediaries receive and absorb the orders from their customers, they turn to the
interdealer market to trade any positions accumulated together with their proprietary
trading. Traditionally, the largest share of interdealer trading was between market
mak-ers, but more recently trading between financial institutions took over (BIS (2010)). In
addition, an important trend towards the centralization of the interdealer FX
mar-ket is making electronic exchanges relatively more important. Despite these on-going
changes, the interdealer FX market is still decentralized and trading may take place
simultaneously at different prices. Given that foreign exchange rates are determined in the FX interdealer market, it is essential to consider how information is conveyed into
prices at that level. The retail market of the FX market is essential in this respect as
it represents a source of private information for dealers. In fact, each dealer gathers
private information from the orders she receives from her own customer base (Goodhart
(1988), Cheung and Chinn (2001) and Gehrig and Menkhoff (2004)). Once she trades
on the interdealer market, she will then pass the information to other dealers, or to the
market via centralized electronic exchanges, through her own trading (Lyons (1997)).
Finally, interdealer trading determines the price.
The departure from traditional macroeconomic models is marked by the
introduc-tion in microstructure models of two new determinants, order flow and bid-ask spreads.
The inclusion of the two variables in models for exchange rate determination changes
drastically the focus of the analysis from macroeconomic fundamentals to market
par-ticipants and market structure. In this sense, order flow can be defined as signed
associate a sign to each trade and then cumulates all signed trades of a specific currency pair in a given period of time to identify the net pressure of demand. Essentially, a
transaction is included in the cumulative trading volume signed as a buy, positive, or
sell, negative, depending on the side that initiated the trade. The significant role of
order flow to determine exchange rates is first reported in Evans and Lyons’ (2002a)
seminal paper, who finds coefficients of determinations associated with order flow to be
significantly larger than in empirical analysis of traditional macro models.
On the market, the counterparty of each trade is often a market maker who stands
ready to absorb traders’ orders. The presence of market makers in the FX market is
important for its functioning and introduces the second component of the
microstruc-ture approach. Standing ready to act as counterparty for trades, market makers are
suppliers of liquidity. This role is costly and risky and thus requires compensation. In
fact, market makers charge a higher price to buyers, the ask, and a lower price to sellers,
the bid. The bid-ask spread is the difference between the two and represents the cost
of immediacy (Demsetz (1968)) and the remuneration of market makers. The bid-ask spread arises in part to cover the costs incurred by market makers for maintaining her
presence on the market (Grossman and Miller (1995)). But these costs are not the only
components of the spread. Allowing traders to fulfil their trades quickly, they provide
a solution to the frequent time mismatching between the arrival of buyers and sellers
on the market. But while providing liquidity to traders, market makers are subject to
undesired changes to their inventory level. The mismatch in arrival of buyers and sellers
implies that they may have to hold undesired inventory until an order of the opposite
sign arrives. Given the risk of adverse exchange rate movements, holding inventory is
risky as it may result in a disadvantageous unwinding of the accumulated position (Stoll (1978), Amihud and Mendelson (1980) and Ho and Stoll (1981)). To bear this risk, the
market makers require a compensation which is an additional component of the bid-ask
spread. Finally, the heterogeneity of market participants entails the presence of some
informed and uniformed traders. When market markets engage in trades, they risk
suffering losses by trading against a better informed party. To overcome this potential
cost, market makers charge a price that covers the expected loss of trading with an
informed trader and that is the third and last component of the spread (Copeland and
Galai (1983), Kyle (1985) and Glosten and Milgrom (1985)).
Analysing the role of market makers and the bid-ask spread associated with it, it
is clear that the provision of liquidity to the market comes at a cost. This cost is
a friction preventing markets to be efficient and prices to be informative. A liquid
market is a market where large trades are executed quickly and at low cost. Given
the definition provided, market liquidity is a broad concept and comprises different
detail, market depth is the ability of the market to absorb trades with low impact on prices, whereas tightness reflects the cost for quickly turning a position around. Finally,
resiliency refers to a market which quickly readjusts after an uninformative shock. The
complexity underlying the definition of liquidity and the variety of aspects it entails are
expectedly reflected into the number of tools available for its empirical measurement.
As liquidity providers, dealers need capital to take positions. In this respect, the
concept of market liquidity has been closely related to that of funding liquidity. Funding
liquidity is the ease with which traders can finance their operations. In this respect,
when funding available for traders is low, their trading strategies will be affected and the
market will suffer from a loss in liquidity (Brunnermeier and Pedersen (2009), Gromb
and Vayanos (2010) and Acharya and Viswanathan (2011)). This may be reflected in
an increase in transaction costs, that is wider bid-ask spreads, or in larger price impact
of transactions, so that orders are absorbed with a substantial price change which does
not readjust quickly.
Objectives and contribution of the thesis
The FX market is characterized by a significantly high level of trading volume, which
is estimated at $4 trillion daily in April 2010 (BIS (2010)). However, liquidity is a
complex concept and the presence of large volume does not necessarily depict a market
where trades are absorbed quickly and at low cost. Hence, whether the FX market is liquid depends on the definition and tools adopted for estimation. In addition, several
currencies are traded on the FX market and the degree of market liquidity varies among
them. Generally, trades in emerging market currencies are expected to have a stronger
impact on the prices and incur larger transaction costs than in most traded currencies.
Moreover, the liquidity of individual currencies has been documented to be time varying
(Evans and Lyons (2002b) and Melvin and Taylor (2009)). As a result, there are
important differences in liquidity in the FX market across currencies and across time.
This thesis studies liquidity in the FX market. After empirically documenting the
presence of a time-varying common component in liquidity across currencies, I provide
a thorough investigation of the determinants and implications of this phenomenon at
the market level and across markets.
At the market level, I investigate the presence of a common component in liquidity
across currencies. In order to consider the various aspects of liquidity, the common
factor is documented with respect to two liquidity measures referring to distinct
char-acteristics of liquidity, such as the price impact of transactions and transaction costs.
In particular, the price impact of transaction is estimated employing two proxies
origi-nally developed for the stock market and based on the Pastor and Stambaugh (2003)’s
estimates the temporary price change associated with order flow, where the subsequent reversion of an initial price reaction is interpreted as a price readjustment to an
unin-formative change due to illiquidity. In this respect, the empirical estimation of Kyle
(1985)’s lambda is an evaluation of the initial reaction of the price to order flow. Besides
price impact of transactions, I employ the bid-ask spreads as an alternative estimate of
liquidity related to transaction costs. Several studies have investigated the presence of a
common component in liquidity in different financial markets. However, the FX market
has received much less attention. The presence of a common pattern in the liquidity of
a group of developed country currencies during the recent crisis period is documented
in Melvin and Taylor (2009) and Mancini, Ranaldo, and Wrampelmeyer (2012). In this respect, this thesis investigates global FX liquidity for a long time period including both
crisis and non-crisis periods and both developed and emerging market currencies. Its
main contribution relies in providing a comprehensive study of this phenomenon filling
the gap of the literature in international finance and market microstructure.
From the analysis of the common component in liquidity, it is clear that it exhibits a strong variation through time. This time variation has important implications from
an asset pricing perspective. In fact, this strong variation of the level of liquidity
exposes FX traders to a liquidity risk. If investors require a compensation for holding
currencies which are sensitive to the risk of unexpected changes in the level of liquidity,
which affect their trading costs, then there will be a liquidity risk premium in the
cross-section of currency returns. Indeed, investors will require a higher premium to
hold currencies which are more sensitive to liquidity risk. In this respect, through an
empirical asset pricing exercise, the thesis documents higher returns associated with
currencies which are more exposed to global liquidity risk and estimates a global FX liquidity risk premium. Menkhoff, Sarno, Schmeling, and Schrimpf (2012) document
the presence of a risk premium associated with global FX volatility, the thesis provides
evidence of another risk premium which is related to global liquidity risk.
The presence of a premium associated with global liquidity risk highlights the im-portance of understanding the movements in FX market liquidity and identifying its
sources. Traditional theoretical models have linked the presence of market liquidity to
inventory control consideration of dealers and asymmetric information (Amihud and
Mendelson (1980) and Copeland and Galai (1983) among the others). More recently,
a new stream of literature has developed theoretical models linking market liquidity
with dealers’ capital constraints (Brunnermeier and Pedersen (2009) and Acharya and
Viswanathan (2011) among the others). Whilst designed primarily for the stock market,
these models provide an interesting theoretical background for the choice of the possible
determinants of FX market liquidity in an empirical investigation. These models are
mar-ket. Indeed, I provide evidence of the importance of determinants which are related to inventory control, such as recent market returns, volatility and seasonality, and others
which arise from the specific provision of liquidity by financially-constrained traders,
namely interest rates on overnight financial commercial papers. From an empirical
perspective, several papers have identified an important role of volatility in
determin-ing individual currencies’ bid-ask spreads (Bollerslev and Melvin (1994), Bessembinder
(1994) and Ding (1999)). Focusing on the currencies of a group of developed countries,
Mancini et al. (2012) document a significant role of volatility and interbank credit
con-ditions during the recent financial crisis. However, this thesis provides a thorough study
of the determinants of FX market liquidity from a global perspective and with respect to the empirical implications of the discussed theoretical models. Besides the
contribu-tion to the literature in internacontribu-tional finance, this thesis also provides empirical support
for the theoretical literature on the relation between market and funding liquidity in
this global market.
The FX market is related to other financial markets in many respects. A large literature has analysed cross-market relationships with respect to market returns and
volatility mainly between the stock and FX markets (Phylaktis and Ravazzolo (2005),
Pavlova and Rigobon (2008) and Bartram and Bodnar (2012) among the others). From
a cross-market perspective, the 2007-2009 financial crisis has highlighted the presence
of strong cross-market linkages through which a drop in liquidity in one asset or market
may trigger systematic liquidity drops. From the observation of these recent events, a
number of theoretical models have been proposed to identify the sources of cross-market
liquidity linkages. According to these models, cross-market liquidity linkages arise
from financial intermediaries’ leverage rebalancing strategies (Adrian and Shin (2010)), informational learning process (Cespa and Foucault (2012)) and financial constraints
(Brunnermeier and Pedersen (2009), Gromb and Vayanos (2010) and Acharya and
Viswanathan (2011)). In this respect and in order to complete the analysis of FX market
liquidity, the thesis empirically investigates the presence of liquidity linkages across
the FX and stock markets. It documents significant cross-market liquidity dynamics
between the two markets. The linkages are especially tight during periods of financial
distress, as shown by the focus on the recent financial crisis. Indeed, according to
theory, capital constraints affect market liquidity when dealers are close to hit their
funding constraints (Brunnermeier and Pedersen (2009), Gromb and Vayanos (2010) and Acharya and Viswanathan (2011)). Hence, the thesis provides empirical evidence
for these models on liquidity contagion.
The contributions of the thesis are several and can be identified with respect to
two major areas. The main contribution of this thesis is in the field of international
rate economics by empirically identifying a market liquidity component across curren-cies through a variety of proxies. It also extends the analysis to investigate the factors
triggering changes in this component. Furthermore, the thesis contributes to the
liter-ature on exchange rate determinations by identifying and estimating a global liquidity
risk premium across a broad section of currency returns.
In addition to international finance, the thesis provides a significant contribution
to the field of market microstructure. Indeed, it extends the empirical analysis of the
microstructure of financial markets studying market liquidity in an often overlooked but
globally important market, the FX market. Employing a unique dataset that comprises
order flow of financial institutions for a wide number of currencies and a long sample
period, this thesis is able to overcome the issue of lack of data, which is often the reason
for the relatively few empirical studies of the FX market. Finally, the thesis extends
the analysis of liquidity in the FX market by investigating its cross-market dynamics.
Indeed, it explores the linkages in transaction costs across two systemically important financial markets, the US stock and FX markets. Despite the relevance of the two
markets considered, this is the first study to analyse liquidity dynamics across them.
Besides the main contribution towards academic literature, the analysis of liquidity
is of interest to investors and traders in the FX market. In fact, both the presence of a liquidity risk premium and the identification of the determinants of transaction costs
and price impact of transactions are relevant to traders and investors which are
inter-ested in minimizing the cost of their trades. Finally, from the regulators’ perspective,
it is especially important to improve the understanding of the dynamics of liquidity in
the FX market given the particular role of this market for monetary authorities and for
the economy of a country in general.
Structure of the thesis
This thesis presents an empirical investigation of FX market liquidity, its pricing
im-plications, determinants and cross-market dynamics. The main body of the thesis is
developed in the next three chapters, each one presenting a paper. These chapters are
followed by concluding remarks that discuss the conclusions of the thesis.
The first chapter is an empirical investigation of global liquidity risk in the FX
mar-ket. The analysis begins with an estimation of liquidity for a broad group of currencies.
In this respect, the study employs a measure of liquidity based on the temporary price
impact of transactions, which is the analogue of the Pastor and Stambaugh (2003)’s
measure for the stock market. The currencies included in the sample are US dollar
exchange rates of the major 10 developed and 10 emerging market countries. The
transaction data is a unique data set and comprises order flow of institutional investors
liq-uidity measures, the paper shows that there is a strong common component across currencies. Having established liquidity commonality in the FX market and identified
strong time variation, the paper proposes a measure of global liquidity risk, as the
unexpected change in market liquidity. Finally, it provides evidence that liquidity risk
is priced in the cross-section of currency returns. The methodology is based on the
portfolio construction technique, which allows singling out systemic factors affecting
currency returns from idiosyncratic determinants. In particular, the currencies are
di-vided into portfolios according to their degree of sensitivity to the global liquidity risk
measure proposed. Constructing a series of returns for each portfolio, the paper shows
that holding the most sensitive portfolios give a higher return on average. A strategy of buy the most sensitive currencies and short the least sensitive ones returns significantly
high Sharpe ratios. Finally, the paper employs a standard Fama-MacBeth procedure
to estimate the liquidity risk premium in the FX market. The procedure is a two-step
estimation method starting with the estimation of the sensitivities of portfolios’ returns
to global liquidity risk. These sensitivity measures are then regressed on the
portfo-lios’ returns at each point in time to estimate their average market price. The paper
estimates the liquidity risk premium to be around 4.7 percent per annum.
In the second chapter, the second paper provides a thorough empirical analysis of
the determinants of the time variation in FX market liquidity documented in the first
paper. The study relies on two measures of liquidity, the bid-ask spread and the Pastor
and Stambaugh (2003)’s measure presented in the first paper. Analysing the same
panel of currencies of the first paper, the main study is conducted with the bid-ask
spread data for a sample period of 13 years, from January 1998 until December 2011.
However, for the second measure the sample period is shorter, from January 1998 until July 2008, due to data availability limitations of the transaction data. In support of the
traditional theoretical models of bid-ask spread determination, this study documents
a significant impact of recent market returns, global volatility and seasonality on FX
market liquidity. In addition, it provides empirical support to the theoretical models
linking market and funding liquidity. In this respect, changes in funding constraints
have a significant impact on both aspects of FX market liquidity and the impact relates
to market declines when liquidity providers face capital tightness, and to crisis times,
when there are severe liquidity dry-ups. Furthermore, funding liquidity together with
the other explanatory variables explains unexpected changes in FX market illiquidity, which is the measure of liquidity risk employed in the first paper.
The third chapter presents the third paper, which is an empirical investigation of
illiquidity linkages across the FX and US stock markets. Focusing on transaction costs
in the two markets for 18 years, from January 1994 until December 2011, the paper
the paper provides evidence of illiquidity contagion across the two markets. The data set analysed in this paper comprises bid-ask spreads for the five most traded currency
pairs of the FX market and the corresponding measures for the stocks traded on the
NYSE/AMEX markets. After identifying a common component in liquidity in both the
FX and stock markets, the paper investigates the cross-market liquidity dynamics
in-cluding these variables in a vector autoregression (VAR) model. The VAR estimation is
then analysed with respect to the standard contemporaneous correlation matrix of the
VAR innovations, Granger causality tests and impulse response functions. These
anal-yses are supportive of the presence of illiquidity linkages across the two markets. These
links are especially strong during the 2007-2009 financial crisis, providing evidence of illiquidity contagion across the markets. Given dealers’ role as liquidity providers both
in the stock and FX markets, their trading behaviour may have significant implications
for the observed dynamics. Turning to the potential sources of the cross-market
link-ages documented, the paper includes several funding liquidity measures as endogenous
variables in the basic VAR and finds transaction costs to be strongly related to the
liquidity supplied to the financial system during times of distress. Finally, extending
the analysis to common illiquidity in emerging FX markets, the paper addresses the
controversial issue of the impact of liquidity provision by developed countries’ monetary
authorities on emerging markets currencies. In this respect, I show that shocks to de-veloped countries’ funding liquidity affect the illiquidity level of FX emerging markets
when financial markets are under distress, consistently with the results of the main
Chapter 1
Global Liquidity Risk in the Foreign
Exchange Market
1.1
Introduction
The foreign exchange (FX) market is considered to be highly liquid. In terms of
turnover, the average daily market activity in April 2010 was $3.98 trillion (BIS (2010)).
However, there are large differences across currencies: 66 percent of the FX market
av-erage daily turnover in April 2010 involves the six most traded pairs of currencies. In
addition to the different liquidity levels in the cross section of currencies, liquidity also
changes over time both intra-day and across days (e.g. Bessembinder (1994); Bollerslev
and Melvin (1994); Lee (1994); Hsieh and Kleidon (1996)). In this paper, we shed light on several aspects of liquidity in the FX market and on the premium required by
investors for holding less liquid currencies.
Using a unique data set comprising daily order flow for 20 exchange rates
span-ning 14 years, we build a measure of liquidity inspired by the Pastor and Stambaugh
(2003) measure, which was originally developed for the US stock market. Analysing the
properties of the individual currency liquidity measures, we find that they are highly
correlated, suggesting the presence of a common component across them. The presence
of a common component is consistent with the notion that liquidity is largely driven by shocks that affect the FX market as a whole rather than individual currencies. We then
construct a measure of innovations in global FX liquidity (unexpected liquidity) and
show that it explains a sizeable share of liquidity fluctuations in individual currencies.
In the stock market literature, several papers find significant co-movement of
liq-uidity cross-sectionally (e.g. Datar, Naik, and Radcliffe (1998); Chordia, Roll, and
Subrahmanyam (2000a); Chordia, Roll, and Subrahmanyam (2001); Hasbrouck and
Seppi (2001); Huberman and Halka (2001); Lesmond (2005)). In contrast, the FX
market during the recent crisis period is documented in Melvin and Taylor (2009) and Mancini et al. (2012). However, to our knowledge, this is the first paper to study global
FX liquidity covering a long sample period which includes both crisis and non-crisis
pe-riods and drawing on the behaviour of both developed and emerging market currencies,
where liquidity considerations are likely to be more prominent.
Next, taking the perspective of a US investor, we ask whether unexpected changes
(innovations) in FX market liquidity affect exchange rate movements. In other words,
we examine whether there is a systematic liquidity risk premium in the FX market.1
Estimating systematic liquidity risk as the covariance of exchange rate returns and
in-novations in global liquidity risk, we identify a liquidity risk premium by employing
standard empirical asset pricing tests and the portfolio construction techniques first
applied to FX data by Lustig and Verdelhan (2007). These methods allow us to
elimi-nate currency-specific sources of returns by taking into account the common component
of the excess returns related to systematic liquidity risk. The empirical asset pricing results suggest the presence of a statistically and economically significant risk premium
associated with global FX liquidity risk, estimated to be about 4.7 percent per annum.
The market price of liquidity risk stays significant even after conditioning on other
common risk factors in FX asset pricing analysis, and is robust to a number of tests
including alternative weighting of currencies to calculate the global liquidity measure,
different rebalancing horizons, and an alternative estimation method. Finally, we find
that the liquidity risk premium associated with emerging markets currencies is
signif-icantly higher than that of major currencies, and that it increased substantially after
the 2008 collapse of Lehman Brothers.
The paper is organized as follows. Section 1.2 provides an overview of the
rele-vant literature. In Section 1.3 we describe the data set and provide some descriptive
statistics. The methodology for the construction of the liquidity risk measure and the
empirical asset pricing exercise are described in Section 1.4. The core empirical results are reported in Section 1.5, where we document the presence of a common component
in liquidity across currencies, and estimate the liquidity risk premium. Section 1.6
contains some further analysis, including an extension of the liquidity risk definition,
an analysis of liquidity risk employing two alternative liquidity measures, an
investi-gation of currencies of emerging markets and less traded developed countries, and an
additional study focusing on liquidity risk in the recent financial crisis following the
Lehman Brothers collapse in September 2008. We report additional robustness checks
1Adopting different proxies for liquidity, some studies find a relationship between changes in liquidity
in Section 1.7. Finally, Section 1.8 concludes.
1.2
Literature review
1.2.1
Liquidity and the FX market
In the FX market, dealers provide liquidity to the market and quote prices after
re-ceiving orders from customers and other dealers. With the increase in data availability,
a literature analysing the price impact of order flow has emerged in the last decade,
documenting that order flow can successfully explain a sizable share of the movements
in exchange rates (Evans and Lyons (2002a)).2
Due to the heterogeneity of market participants, the FX market is characterized by
informational asymmetries, so that dealers gather disperse information from the orders
placed by their customers (e.g. Lyons (1997)). Indeed, FX market practitioners’ surveys
highlight how order flow is seen as a preferred channel for dealers to obtain private and
dispersed information from customers (Goodhart (1988); Cheung and Chinn (2001);
Gehrig and Menkhoff (2004)). In this sense, the information channel works from the
dealer’s own customer order flow and from the aggregate market customer order flow, which can be inferred from the interdealer and brokered trading. As a consequence, the
presence of asymmetric information in the market influences liquidity (Copeland and
Galai (1983); Kyle (1985); Glosten and Milgrom (1985); Admati and Pfleiderer (1988)).
Dealers quote prices by balancing the expected total revenues from liquidity trading
against the expected total losses from informed trading. Copeland and Galai (1983)
suggest that liquidity decreases with greater price volatility in the asset being traded,
with a higher asset price level, and with lower volume. In this respect, Bollerslev and
Melvin (1994) find a significant positive relationship between the bid-ask spread and
exchange rate volatility in the interbank market trading of Deutsche mark-US dollar (DM/USD).
Analysing the intra-day trading of DM/USD in two interbank FX markets (London
and New York), Hsieh and Kleidon (1996) find that the volatility patterns in spreads
and trading volume are not consistent with standard asymmetric information models.
In fact, the observed shifts in transaction costs and trading volume (which can be viewed
2Order flow reflects buying pressure for a currency and it is typically calculated as the sum of signed
as proxies for liquidity) are not related to information flows. They suggest that the high volatility of these measures could be explained by inventory considerations. In his
em-pirical analysis, Bessembinder (1994) finds that bid-ask spreads of major currency pairs
widen with forecasts of inventory price risk and with a measure of liquidity costs. In
addition, there is a seasonal pattern in changes in spreads: spreads widen before
week-ends and nontrading intervals. These observed patterns are related to inventory control
conditions. A dealer with a larger currency inventory than desired will set a lower price
to attract buyers, known as ‘quote shading’. According to the theoretical model by
Amihud and Mendelson (1980), the market maker’s constraints on her inventory
posi-tions influence the level of liquidity of the market. Furthermore, liquidity will depend upon the factors that influence the risk of holding inventory (Stoll (1978); Ho and Stoll
(1981)). According to Grossman and Miller (1995), the provision of liquidity depends
on the cost incurred by the market maker to maintain her presence in the market. In
turn, this cost is inversely related to the number of market makers which are operating
in the market. As a result, the larger the number of market makers, the lower is the
cost for immediacy and the more liquid is the market, resulting in a lower price impact
of trades. Brunnermeier and Pedersen (2009) extend the Grossman-Miller model to
include the interaction of funding liquidity with the provision of liquidity by
specula-tors. Under certain conditions, this interaction leads the market to a liquidity spiral: speculators’ liquidity constraints reduce market liquidity, which will further tighten the
constraints. In an empirical analysis of a dealer’s trading activity in the DM/USD
mar-ket, Lyons (1995) finds positive evidence of the effects of both the inventory control and
the informational asymmetry channels. Specifically, running a regression of the changes
in the exchange rate on incoming orders, the dealer’s inventory at the beginning of the
period and other variables, Lyons reports positive and significant coefficients associated
with the two variables of interest, transaction orders and inventory at the beginning of
the period. Similarly, Bjønnes and Rime (2005) document a strong information effect
on the trading activity of four dealers from a large Scandinavian bank. They find these results both taking into account the size of the orders and the direction of trades.
1.2.2
Measures of liquidity
The bid-ask spread is the most widely used measure of liquidity in the literature. In this
respect, Stoll (1989) determines the relative importance of each of the three components
of the spread (order processing costs, inventory control cost and adverse selection costs)
from the covariance of transaction returns. In the FX market, much research has been
carried out on the bid-ask spread; e.g. see Bessembinder (1994), Bollerslev and Melvin
(1994), Lee (1994), and Hsieh and Kleidon (1996). However, Grossman and Miller
method gives the cost of providing immediacy of the market maker in the case of a contemporaneous presence of buy and sell transactions. In reality, this is almost never
the case.
Apart from measures related to transaction costs, other liquidity measures were developed to proxy the price impact of transactions. Pastor and Stambaugh (2003)
propose a liquidity measure based on the temporary price change, in terms of expected
return reversal, due to signed transaction volume. This measure is based on the
intu-ition that lower liquidity is accompanied by a higher volume-related return reversal.3
Furthermore, Amihud (2002)’s illiquidity ratio measures the elasticity of liquidity. This
is calculated as the daily measure of absolute asset returns to dollar volume, averaged
over some period.
These liquidity measures have been developed and tested mainly for the stock market
(e.g. see Næs, Skjeltorp, and Ødegaard (2011)). In fact, their application to the FX
market can be quite problematic due to its specific characteristics and the difficulty of
gathering order flow and volume data. As a result, liquidity in the FX market has been
investigated in only a few papers. However, two studies are worth noting. Evans and Lyons (2002b) study time-varying liquidity in the FX market using the slope coefficient
in a contemporaneous regression of FX returns on order flow as a proxy for liquidity, in
the spirit of Kyle (1985) model. More recently, Mancini et al. (2012) apply a modified
version of Pastor and Stambaugh’s measure to the FX market by building a daily
measure of liquidity for about one year of order flow data during the recent financial
crisis. In our paper, we also apply the Pastor and Stambaugh’s measure of liquidity
but we can rely on 14 years of order flow data and 20 exchange rates.
1.2.3
Liquidity risk premium
The literature on liquidity risk premia is virtually non-existing in the FX market, with
most studies focusing on stock markets and some on bond markets. Starting from the
seminal paper by Amihud and Mendelson (1986), several papers model and
empiri-cally test the relationship between liquidity and expected stock returns (Brennan and
Subrahmanyam (1996); Brennan, Chordia, and Subrahmanyam (1998); Datar et al.
(1998)), showing that a higher return is demanded by traders when liquidity is lower
and transaction costs are higher.4 The same result holds true for other assets: Amihud and Mendelson (1991), for example, find a significant spread in the yields of Treasury
notes and bills due to a liquidity risk premium.
3Another measure of this kind is the market depth measure of Kyle (1985)’s model, which in its
empirical counterpart relies on the contemporaneous relationship between FX returns and order flow (see Evans and Lyons (2002b)). The specific rationale is discussed later in the paper.
4Most of these papers study the US stock market, but the same result is documented by Bekaert,
Some studies also focus on the time variation of liquidity and on its co-movements cross-sectionally. Chordia et al. (2000a) analyse the correlation in movements in
liquid-ity both at industry and market level. After controlling for determinants of liquidliquid-ity
such as volatility, prices and volume, they document significant commonality in
liquid-ity across stocks. Similar conclusions are reached also by other authors. Huberman
and Halka (2001) find that there is a systematic and time-varying component in stock
market liquidity. A less clear-cut conclusion is reached by Hasbrouck and Seppi (2001),
who find evidence of weak co-movement in stock market liquidity measures constructed
from intra-day data. Employing a longer data set of intra-day stock market data,
Chor-dia et al. (2001) confirm the presence of a common component in stock market liquidity, and then present an investigation of the possible determinants of the observed variation
in market liquidity and trading activity over time.5
Finally, some studies examine the implications of the documented time-variation
in common liquidity for asset returns, controlling for the presence of a priced liquidity
risk in the stock market. In their analysis, Pastor and Stambaugh (2003) find that the
sensitivities of stock returns to common liquidity innovations are priced. Acharya and
Pedersen (2005) broaden the analysis and generalize the Pastor-Stambaugh liquidity
measure. In doing so, they develop a liquidity-adjusted Capital Asset Pricing Model (CAPM) and find empirical support for the presence of a priced liquidity risk. In an
empirical application of Acharya and Pedersen (2005)’s liquidity-adjusted CAPM, Lee
(2011) identifies a systematic liquidity risk premium in stock returns. In particular, he
finds a premium related both to the commonality in liquidity, and the covariance of
individual stocks’ liquidity and the stock market return. Similarly, defining systematic
liquidity risk as the common component of different liquidity measures, Chen (2005),
Korajczyk and Sadka (2008) and Hasbrouck (2009) provide evidence that systematic
liquidity risk is priced in stock markets.
This is the key subset of the literature on which we build to design an empirical
strategy to construct a global liquidity risk measure for the FX market and to test
whether liquidity risk is priced in currency markets.
1.3
Data
1.3.1
Description of the data
The main data set analysed in this paper comprises daily data for 20 exchange rates and
their order flow for a time period of 14 years, from April 14, 1994 to July 17, 2008. Its
distinctive feature is the availability of order flow for a wide cross section of currencies
5The determinants considered are inventory control variables (such as daily returns and volatility)
available for a long time period, including a number of emerging markets. Of the 20 currencies in the data set, 10 are of developed economies (Australian dollar, Canadian
dollar, Danish krone, euro, Great Britain pound, Japanese yen, New Zealand dollar,
Norwegian kroner, Swedish krona, and Swiss franc) and 10 are of emerging markets
(Brazilian real, Chilean peso, Czech koruna, Hungarian forint, Korean won, Mexican
peso, Polish zloty, Singaporean dollar, South African rand, and Turkish lira).6
Log returns are calculated from the FX spot exchange rates of the US dollar versus
these currencies and are obtained from Datastream. They are the WM/Reuters Closing
Spot Rates, provided by Reuters at around 16 GMT. Log-exchange rate returns are
calculated as:
rt= ln(St)−ln(St−1) (1.1)
where St is the FX spot rate of the US dollar versus the currency.
In order to calculate FX excess returns, one month forward exchange rates are
obtained from Datastream and provided by WM/Reuters. Excess returns are calculated
as follows:
ert = ln(St+1)−ln(Ft) (1.2)
where Ft is the one-month forward exchange rate.7
Turning to order flow, the FX transaction data is obtained from State Street
Cor-poration (SSC). As one of the world’s largest custodian institutions, SSC counts about 10,000 institutional investor clients with about 12 trillion US dollars under custody.
SSC records all the transactions in these portfolios, including FX operations. The data
provided by SSC is the daily order flow aggregated per currency traded. Order flow
data is defined by SSC as the overall buying pressure on the currency and is expressed
in millions of transactions (number of buys minus number of sells in a currency).
The measures of investor behaviour developed at SSC reflect the aggregate flows
(and holdings) of a fairly homogenous group of the world’s most sophisticated
institu-tional investors and represent approximately 15 percent of tradable securities across the
globe. The data are used by SSC for the construction of the Foreign Exchange Flow
Indicator (FXFI), an indicator of net buying pressure for currencies. The FXFI data
available to us is the net flow for 20 currencies, derived from currency-level transactions
and aggregated to ensure client confidentiality. The data is therefore not derived from broker/intermediary flow. However, it is important to note that the FXFI is not
ex-actly the raw net of buy and sell number of transactions (net flow), but is the net flow
6The classification in developed and emerging countries above does not correspond to the IMF
classification, but follows instead common practice in the FX market.
7This definition of excess returns assumes the validity of covered interest parity, implying that
filtered through a ‘normalization’ designed to increase comparability across currencies and through time as well as to reflect the SSC commitment to client confidentiality.
The raw flows are the same as those used in Froot and Ramadorai (2005), who also
normalize the SSC data in their empirical work by dividing the flow by its standard
deviation.8
The sample period is generally from April 14, 1994 to July 17, 2008. For a group of
currencies the sample for the liquidity analysis is shorter due to limited data availability
from the providers. Specifically, the sample period for CZK starts on December 12,
1994; CLP on October 4, 1995; HUF on September 30, 1994; and PLN on August
22, 1995. In addition, BRL is considered from January 15, 1999, when the real was
introduced as the national currency and Brazil adopted a floating exchange rate system,
and EUR starts on December 31, 1998 when the EMU was established. Furthermore,
for the portfolio analysis and the following asset pricing exercise the sample period is from January 1, 1997 to July 17, 2008, when the one-month forward exchange rate
became available from Datastream.9
1.3.2
Descriptive statistics
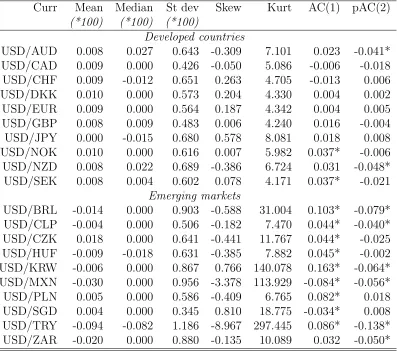
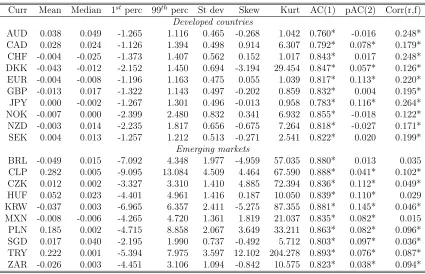
Table 1.1 presents some descriptive statistics of the log FX returns, grouped in
devel-oped and emerging countries. In general, emerging markets’ currencies present a higher
standard deviation than developed countries’ currencies. Furthermore, log returns of developed currencies present low first- and second-order autocorrelation. In contrast,
most of the emerging markets’ currencies exhibit positive significant first-order
auto-correlation and negative significant second-order autoauto-correlation.
Table 1.2 shows some descriptive statistics for the order flow data. It is useful to
recall that, because of the normalization carried out by SSC on these data, it is not
possible to offer a clear-cut interpretation of the average values of the flows. The order
flow time series for emerging markets generally present a higher standard deviation
than for developed countries, and also much stronger evidence of non-normality, as
evidenced by the 1st and 99th percentiles. Furthermore, the order flow data exhibit
strong autocorrelation for all currencies in the sample. In the last column we report the
correlation between order flow and the log return of the US dollar versus the currency.
The correlation is significant for most of the currencies, and is higher for the currencies
8While a strength of the SSC data is that it covers a large fraction of the FX market, we do not
have information on different segments of the investors included in the data set. This prevents us from distinguishing between different types of institutional investors and explore questions related to heterogeneous impact on prices or differences in the degree of informed trading across different investors. For an analysis of this kind, see e.g. Menkhoff, Osler, and Schmeling (2010).
9However, the sample period is shorter due to limited data availability from Datastream for the
of advanced economies in the sample. All the correlations are positive, as expected: a positive order flow indicates buying pressure for the currency, which should cause
the currency to appreciate. All these preliminary statistics are comparable to the ones
reported by Froot and Ramadorai (2005), who use a similar data set from the same
source over a shorter sample.10
1.4
Methodology
1.4.1
Construction of the liquidity measure
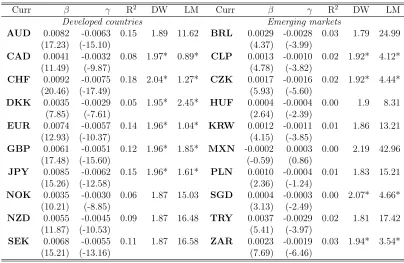
Starting from Evans and Lyons (2002a), several papers document that order flow is
a statistically powerful determinant of FX returns. Running the simple Evans-Lyons
regression of log returns on contemporaneous order flow:
ri,t =αi+βi∆xi,t+εi,t, (1.3)
we expect to find a positive coefficient associated with the contemporaneous order flow
∆x. A positive order flow causes the currency to appreciate, which leads to an increase
in the exchange rate quoted as US dollar versus the foreign currency. Also, Evans and
Lyons (2002b) use the above regression to investigate time-varying liquidity in the FX
market, allowing the slope coefficient to vary over time.
Following Pastor and Stambaugh (2003), we measure liquidity as the expected
re-turn reversal accompanying order flow. Pastor and Stambaugh’s measure is based on
the theoretical insights of Campbell, Grossman, and Wang (1993). Extending the
liter-ature relating time-varying stock returns to non-informational trading (e.g. De Long,
Shleifer, Summers, and Waldmann (1990)), Campbell, Grossman and Wang develop a
model relating the serial correlation in stock returns to trading volume. A change in the stock price can be caused by a shift in the risk-aversion of non-informed (or
liq-uidity) traders or by bad news about future cash flows. While the former case will be
accompanied by an increase in trading volume, the latter will be characterized by low
volume, as risk-averse market makers will require an increase in returns to
accommo-date liquidity traders’ orders. The serial correlation in stock returns should be directly
related to trading volume. The Pastor-Stambaugh measure of liquidity captures the
return reversal due to the behaviour of risk-averse market makers. While Pastor and
10However, note that order flow in Froot and Ramadorai (2005) is measured in hundreds of millions
Stambaugh use signed trading volume as a proxy for order flow, we employ actual order flow.
To estimate the return reversal associated with order flow, we extend regression
(1.3) above to include lagged order flow:
ri,t =αi+βi∆xi,t+γi∆xi,t−1+εi,t. (1.4)
We estimate this regression using daily data for every month in the sample, and then
take the estimated coefficient for γ to be our proxy for liquidity. Thus, the monthly
proxy for liquidity of a specific exchange rate is:
Li,m =bγi,m, (1.5)
where the subscriptm refers to the monthly frequency of the series. If the effect of the
lagged order flow on the returns is indeed due to illiquidity, γi should be negative and
reverse a portion of the impact of the contemporaneous flow, since βi is expected to
be positive. In other words, contemporaneous order flow induces a contemporaneous
appreciation of the currency in net demand (βi >0), whereas lagged order flow partly
reverses that appreciation (γi <0).
Other methodologies have been used in the literature to empirically estimate
liq-uidity using regression analysis applied to order flow data. In particular, in Evans
and Lyons (2002b) the contemporaneous impact, changed of sign, corresponds to the
measure of market depth from Kyle (1985)’s model. Pastor and Stambaugh (2003)
estimate liquidity from a regression of returns on lagged order flow, including lagged
returns to account for serial correlation. We specify our regression not including the lagged returns but including contemporaneous order flow instead. It is clear that each
of these regressions reflects some degree of arbitrariness. However, later in the paper,
we will apply these other methodologies for robustness.
1.4.2
Estimation of a common liquidity measure
Next, we construct a measure of common liquidity (DLm) by averaging across
cur-rencies the individual monthly liquidity measures (e.g. Chordia, Subrahmanyam, and
Anshuman (2000b); Pastor and Stambaugh (2003)), excluding the two most extreme observations:
DLi,m= (Li,m−Li,m−1) (1.6)
DLm=
1
N
N X
i=1
In order to account for potential autocorrelation of some of the individual liquidity series and isolate liquidity innovations, the unexpected component of common liquidity
(DLC
m) is obtained as the residual of an AR(1) model of the common liquidity measure.11 In other words, we estimate:
DLm =ρ0+ρ1DLm−1+εm (1.8)
and set DLC
m = bεm. Following Chordia et al. (2000b), we then regress the individual liquidity measures (DLi,m) on global FX liquidity risk (DLCm) to further investigate the
commonality in the liquidity innovations across currencies:
DLi,m =δ0i+δ1iDLCm+i,m. (1.9)
A statistically significant value for δ1 would imply that global FX liquidity risk is
related to fluctuations in liquidity of individual currencies.
1.4.3
Liquidity-sorted portfolios
A key empirical question is whether global liquidity risk is priced in FX returns. In order
to investigate this issue, we construct four portfolios for each year based on the ranking
of the historical sensitivities of currency returns to global liquidity risk.12 Linking the
excess return of each of the four portfolios year after year, the excess returns of the
portfolios are then compared, and we expect the portfolios more sensitive to liquidity
risk to have a higher excess return than the less sensitive portfolios.
The analysis starts from January 1997 to account for the start date of the forward
rate data from Datastream and it is conducted at every year-end. For each currency, the
liquidity measure is estimated by the coefficient associated with the lagged order flow
from regression (1.4), run with the past observations available at each year-end starting from January 1999, to allow for at least two years of past data in the estimations. At
each year-end, the monthly series of common liquidity for the past available period is
also calculated according to equations (1.6) to (1.8).
Then, the sensitivity of each currency’s return to global liquidity risk is estimated
with a regression of monthly returns on the global liquidity risk measure estimated at
each year end:
ri,m =ζ0i+ζ1iDLCm+εi,m. (1.10)
11An AR(1) model is enough to eliminate serial correlation in the residuals. Also note that we use
the term ‘common’, ‘systematic’ and ‘aggregate’ liquidity interchangeably in this paper.
12In other words, we estimate the sensitivity to global liquidity risk for each exchange rate using
At this point, the currencies are sorted according to the estimated parameter ζ1, which captures the sensitivity to global liquidity risk. Based on this ranking, four
portfolios are constructed with five equally-weighted currencies at each year-end: the
first portfolio containing the least sensitive currencies to liquidity risk and the fourth
comprising the most sensitive ones. The excess return of each portfolio for the
follow-ing year is then calculated from the excess returns of each of the five equally-weighted
currencies. For each portfolio an excess return series is obtained by linking the excess
return calculated in each year. Having constructed the portfolios based on their
sensi-tivity to our liquidity measure (liquidity-sorted portfolios), we expect the most sensitive
portfolio to be associated with a higher return in compensation for the higher liquidity risk related to it.
1.4.4
Empirical asset pricing and the FX liquidity risk
pre-mium
Following the comparison of the liquidity-sorted portfolios’ excess returns, we
investi-gate whether systematic liquidity risk is priced in the cross-section of excess returns
of the portfolios. We are specifically interested in quantifying the FX liquidity risk
premium.
In order to establish whether systematic liquidity risk is priced, we conduct a
stan-dard Fama and MacBeth (1973) analysis. Taking the perspective of a US investor, we
test whether our global liquidity risk factor prices the excess returns of the
liquidity-sorted portfolios. We test the significance of liquidity risk also conditioning on other
factors, i.e. we check whether the systematic liquidity risk factor remains priced when accounting for other sources of systematic risk, such as those proposed by Lustig,
Rous-sanov, and Verdelhan (2011).
Applying the standard Fama-MacBeth procedure, we begin by estimating the
sensi-tivities of the portfolios’ excess returns to global liquidity and some common risk factors
through a time-series regression of the form:
erj,m =αj+βjLIQf LIQ m +β
other j f
other
m +j,m for j = 1, ...,4 (1.11)
where fLIQ
m is the proposed liquidity risk factor DLCm, and fmother is an additional risk factor. This could be either the carry risk factor, developed as the difference in the
excess returns of the high-interest currencies portfolio and the low-interest currencies
portfolio, or the dollar risk factor, constructed as the cross-sectional average of the
portfolios excess returns.
At this point, we proceed to determine the cross-sectional impact of the sensitivities