City, University of London Institutional Repository
Citation
:
Sikora, I., Patriarca, R., Di Gravio, G. and Constantino, F. (2016). MARS – A Fresh Look at Risk Assessment Modelling and Effective Safety Data Communication. In: International Scientific Conference on Science and Transport Development (ZIRP 2016): Perspectives on Croatian 3PL Industry in Acquiring International Cargo Flows. (pp. 193-209). Zagreb, Croatia: Fakultet prometnih znanosti (University of Zagreb). ISBN 978-953-243-081-3This is the accepted version of the paper.
This version of the publication may differ from the final published
version.
Permanent repository link:
http://openaccess.city.ac.uk/16848/Link to published version
:
Copyright and reuse:
City Research Online aims to make research
outputs of City, University of London available to a wider audience.
Copyright and Moral Rights remain with the author(s) and/or copyright
holders. URLs from City Research Online may be freely distributed and
linked to.
1
IVAN SIKORA
a, PhD.,
RICCARDO PATRIARCA
b,
GIULIO DI GRAVIO
b, FRANCESCO COSTANTINO
bDepartment Mechanical Engineering and Aeronautics
The School of Mathematics, Computer Science and Engineering City University London, SCME,
Northampton Square, London, EC1V 0HB, United Kingdom
b [riccardo.patriarca; giulio.digravio; francesco.costantino]@uniroma1.it
Department of Mechanical and Aerospace Engineering Faculty of Engineering - Sapienza University of Rome Via Eudossiana, 18 – 00184 Rome, Italy
MARS – A Fresh Look at Risk Assessment Modelling and
Effective Safety Data Communication
ABSTRACT
Aviation industry’s safety management is strictly regulated since the introduction of Safety
Management System (SMS) concept and it is propagation through the industry and literature. Safety
and Risk are in the focus of the constant research ranging from strictly technical and technological
to organisational influence. Still effective and practical assessing and communicating the risk is a
challenge thus diminishing optimal enhancing of organisations’ safety level. The paper will analyse
the literature for the SMS in aviation for their ability to account for the complex dynamics from which
safety in these kinds of systems tends to emerge – or not. Evolution of safety assessment methods and
methodologies (including) the systemic models (RAG, FRAM, STAMP) will be presented. After this,
it will introduce MARS as a model by describing the general features and their connection with
biometrics for varied practical and theoretical reasons. Conceptual description and presentation of
the model will be followed by presenting mathematical approach in the model. General presentation
of mathematical approach will be applied to a case study involving aviation organisation and related
data (related to Human, Technical and Environment factors). Finally one of these factors will be
defined and analysed more in detail demonstrating the effectiveness and application of the MARS on
the operational data.
KEY WORDS
: Air Traffic Control, Training, Safety Management Integration, Risk Modelling,
Safety Management System, Human Factors, Safety Data
1. INTRODUCTION
2
rates in 2016 and 2020, as demonstrated in [2] for the EUROCONTROL Statistical Reference Area (ESRA) analysis.
It has been more than 120 years since the start of accident causation analysis, aiming at prevent them or minimizing their effect. The classic view of safety aims at decomposing systems into basic functions and evaluates in detail each component failure probabilities. Along with this point of view, decomposition of systems in their components allows a detailed and stable description, enabling an accurate analysis of the causes of events. By the way, as socio-technical systems, such as HRO, are continuously developing, work environments have gradually become more difficult to understand, with reference to their complexity.
As a result, since the classical safety analysis assumes that systems are tractable in the sense that they are well-understood and well-behaved, classical models and methods become [3] progressively unable to describe and properly focus on safety. The probability of occurrence of a safety event is due to several factors, depending on technical and procedural aspects, operating system conditions, human factors and service level constraints that the system has to guarantee. It is then possible to link these conditions to a risk level, which indicates a safety event probability of occurrence. This view perfectly fits with the aviation needs, where large numbers of human operators interact with procedures and technical systems, in a variety of locations, with the common target of flying safely and efficiently [4]. Considering the high service levels required and the recent evolution in traffic volume, aviation becomes one of the most critical HROs, where the need for enhanced safety assessment techniques is very important.
This paper focuses on safety in aviation, developing a model, i.e. the MARS, which takes into account the safety features of an organization in the aviation context (ANSP, airline, ground handling, etc.). The MARS addresses the organization criticalities in order to give high-level information to the decision-makers and thus enhance the organization’ safety level. The contribution of the paper are as follows. In the first section, this paper shows a literature review on the evolution of safety assessment techniques over the past decades. Then it presents the conceptual framework of MARS and it basic mathematical approach. In the third section, the paper shows an application of MARS to evaluate the safety performance of an airline. In the conclusions, the paper discuss on the possibility to evolve the proposed model, paving the way for further research.
2. LITERATURE REVIEW
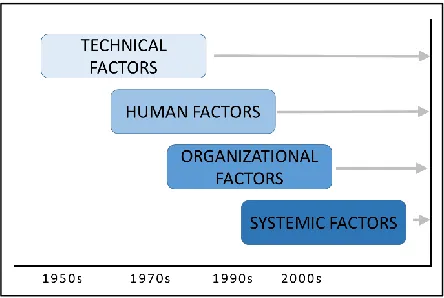
[image:3.595.187.409.540.689.2]Accident analysis and risk assessment methods have usually been developed in response to problems following major technological developments or to cope with “new” type of accidents. As shown in Figure 1, it is noteworthy that human factor methods came onto the scene after the accident at Three Miles Island in 1979 and that organizational methods were developed following the Chernobyl and Challenger accident in 1986 [5]. Systemic model arises, according to current system safety needs, where inter-related connections and tight coupling between functions lead to consider a system-wide perspective.
Figure 1. The evolution on safety assessment.
Risk has been under scrutiny as early as the 17th century. Roelen [6] makes the point that it was mainly the
3
Theory” in early 1930s [7]. In this model, Heinrich has connected different elements in the chain of events that lead to an injury or accident. Among these latter, there were societal circumstances, human error, operator’s background as well as the accident trigger event. The focus of all early models on accident circumstances originated from military and industrial organisations where they were developed and applied initially to reduce the number of injuries and financial losses generated by mishaps and unsafe acts. Towards the mid-20th
century, initial causation theories were enriched by new elements and some models for conflict predicting have been added to mainly reactive methods in use.
Netjasov and Janić stated that one of the first models that International Civil Aviation Organisation (ICAO) attempted to tackle safety and capacity over the North Atlantic was “Machol-Reich” in late 1960s [8]. Still the number of accident investigation models superseded the number of accident prediction (by risk assessment and management) until 1970s. Improvements in systems safety due to the shift in understanding the influences on systems operations and safety from technological to human and organisational factors have gradually diminished. Hence, as Netjasov and Janić stated, new elements had to be introduced to develop models that are more advanced. For example, management and management related influences were introduced by Weaver [9] initially followed by Bird and Loftus [10]. The initial three elements from the “Domino Theory” have been linked when Adams [11] introduced organisational error as an element. Finally the 90s “Generic Error Modelling System” developed by James Reason [12] has been enabled through Johnson [13] and his barriers to error discussion. James Reason’s widely accepted accident causation “Swiss Cheese” model (RSCM) is represented by rotating cheese slices: when the threat makes it all the way from its origin through aligned “cheese” holes, it materialises and accident happens. Provided any of the slices blocks the path, the threat cannot develop further to a mishap. Despite the fact that this theory has helped to develop others, e.g. TRIPOD [14] and DELTA [15] it does not offer practical guidelines to modelling safety, rather it propose a qualitative evaluation. In addition, starting from RSCM, ESARRs [16] propose a set of indicators that could be combined by the Aerospace Performance Factor (APF), in a quantitative Safety Index [18-19].
The end of the 20th and early 21st centuries have brought new challenges in understanding accident causation
in aviation. Contemporary systems have commanded the need to adjust our “common” modelling to their advanced and new logics. Papers and books from the late 90s indicate several attempts to design over encompassing and comprehensive SMS models. Rasmussen’s [20] early overview of safety in complex socio technological systems established the basis of related research areas focused on factors contributing to an accident within those systems. “Normal Accident” theory introduced by Perrow [21] explains system accident by complexity and interrelation between systems. This is reinforced by Reason’s study [12] of organisational factors and the structure that contributes to accidents. Following this approach the HRO name has been introduced to describe management of complex systems as in Rijpma [22]. Focused attention to organizational factors and conditions contributing to system safety resulted in Hollnagel et al. introducing the notion of resilience [3]. This has allowed for formal analysis of systems’ organizational structure, conditions and their response to developing safety issues. Alongside these developments. Aviation has addressed issues and adopted recommendations through SMS [23]. Leveson confirmed that models originating from the end of the 20th century did not reflect the complexity of accidents entirely [24].
4
According to Griffin, new models should enable the study of the systems’ behaviour as a whole in both normal and out of normal state to be able to study their performance indicators. They should be based not only on linear dependency of the elements, but take into account other types of dependencies such as feedback between model elements. Different model levels connected either directly or indirectly should be able to influence and exchange feedback between each other.
Problem analysis through systemic approach advocated by Rasmussen made Leveson conclude that understanding the intention, purpose and the decision for system design is crucial for successful accident prevention. Focusing on operator’s actions, system failures or technological flaws could lead to serious omissions in capturing some of most influential future accidents’ prevention factors. Risk modelling should address more than the accident mechanism only for more comprehensive investigation practice. On this path, the probability of failures at “sharp end” and organization structure at higher levels are interconnected. A stabile state, input and output variables together with their functional relationship are crucial for assessing the level of management’s influence on risk. Finally, impartial risk assessment following modifications to system (either due to new technology or regulations) provide for more general application of new models.
Netjasov and Janić state that the complexity of models that can cater for characteristics mentioned above require a modular approach that would simplify the process. Simplification is the reason for having models that can be used by general users. Replication of the calculation and results validation are next in line of the desired characteristics of the models. The representation of complex systems by models inadvertently results in their complexity and lengthy calculation process. Identified by Roelen that positions the usability of the model over the complexity of the same. According to Griffin the very exact and unforgiving nature of aviation as an industry drives requirements for replication of results and knowledge transfer from model designers to their users. They vary from “sharp end” operators across management and regulators to academia. As Stoop [28] states, different users require different information to be able to identify systemic challenges. Operators need information for safe operations. Management and regulators need indications and means for safety system design. Finally, academia seek to understand system’s nature and the effect of suggested modifications or the need for different ones. Finally as Netjasov and Janić state, the effective and transparent use of module results would be possible only if their output is presented by units that can be validated objectively [8].
In the industrial context, several methods have been developed, or are currently under an improvement process (e.g.) the Functional Resonance Analysis Method (FRAM) [29] and the System Theoretic Accident Modeling and Processes (STAMP) [24], the Resilience Analysis Grid (RAG) [30], which agree that a system-wide evaluation is strictly necessary to consider resilience performance of an organization. Resilience acquires, indeed, a fundamental role in the ATM system, where large numbers of interacting human operators and technical systems, acting at different levels in a variety of locations, must control air traffic safely and efficiently in the context of uncertainty and disturbances [4]. These models, however, offer a reliable conceptual framework and qualitative evaluations. On the contrary, the model proposed in this paper, i.e. the MARS, shares the systemic perspective of STAMP, FRAM and RAG. In addition, however, the MARS shows the possibility of developing a quantitative holistic index capable of defining the safety features of the system. This index could help the decision-maker in assigning resources and find the criticalities in the process in order to enhance the safety level of the organization.
3. THE MODEL: “MARS”
3.1 The General Features of the Model
In the process of risk management, today risk assessment at the level of isolated events is relatively simple and common. The problem is how to assess and monitor risk at the level of individual safety cases or the entire system such as an airline or Air Navigation Service Provider (ANSP). The creation of a safety case reduces the visibility of the numerous events resulting in smaller effect, compared to the relevant individual cases where the realisation of the threat can have catastrophic consequences for the system.
3.1.1. Conceptual Description of the Interaction between Model’s Elements
5
the potential risks in the system. This is even more difficult if the incidents had not yet developed into a serious accident or an unexpected event, and therefore there has been no formal investigation about the same. The reason for this is that the complex interactions among individual system’s elements cannot be described in precise mathematical terms. Therefore the construction of an appropriate model containing elements of the level of risk and their interpretation in line with the nature of observed aviation system’s stakeholder is suggested. Such a model would be able to assess the level of risk in the system observed at a given point of time or the level of its development. Along the lines of previous discussion, the ease of use and accurate reflection of current state would be benefits to the model as well.
3.1.2. The Lumbar Spine and Model Construction
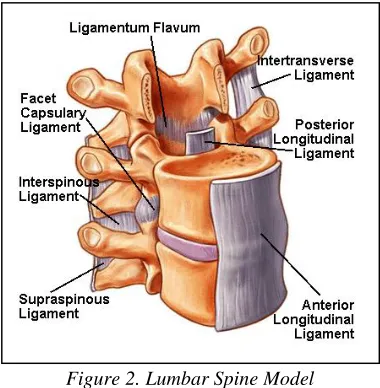
[image:6.595.203.393.349.543.2]Biomechanics characterises the study of the characteristics of movements of man and their impact on the human body. The lack of appropriate models to assess and control the risk at safety cases level, together with works from biomechanics by authors such as Sušić [31], indicated that the possibility of finding solution for modelling the risk in biomechanics. The analysis of forces and moments in motion of the human body faces comparable problems to those in complex systems such as aviation. For example, the elements of lumbar spine (as in Figure 2) with its loin vertebrae and discs, dorsal and ventral muscles and intra-abdominal pressure are in some functional interrelation that provides lumbar spine functioning and physiological capabilities. Hansen confirms this idea [32]:“ Both systems are characterised by the interaction of their subsystems and features that do not allow the examination of the level of risk and effective proactive action to risk using the method of trial and error (or invasive methods in medicine)”. Therefore given the above discussion the analogy with the system of lumbar spine will be used for the transport system (i.e. transport stakeholders).
Figure 2. Lumbar Spine Model
3.2 Identification of Human, Technology and Environment Macro-Factors
Namely, everyday tasks which the human body is exposed sometimes, just like an accident or crash of an aircraft, bring the system into a state in which the upper limits are exceeded when it moves from a stable state to an unstable one. This case reflects on a human body as an injury or illness, and is not acceptable. Similarly, in the transport system an accident, even incident, is not an acceptable result.
6
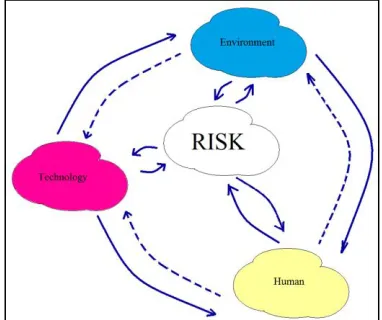
[image:7.595.202.393.138.298.2]human macro-factors (as in Figure 3.). Therefore, the modelling approach links the level of risk and outcome of emergency taking into account the characteristics of comprehensive aviation system and its stakeholders. Assessing the level of risk of individual stakeholder or safety case is done with regard to the above three elements that describe undesired events. The model name is "The Model of Aviation Risk Study" or abbreviated “MARS” [33].
Figure 3. Conceptual Description of the Interaction between Human/Technology/Environment
3.3 Define the Conceptual Mathematical Approach in MARS
The level of risk in the system will present an analytical model that consists of three macro-factors (as seen in see Figure 3). They are technology, human and environment (i.e. legal environment and regulations) in which the stakeholder (i.e. air carrier, ANSP, or airport) exists and operates. The dynamic characteristics of the transport system and its vertical structure (i.e. macro-factors of the model) are a source of diverse influences. Therefore the risk level of a stakeholder represented by this mode is influenced by the characteristics of its three constituent macro-factors. At the same time the same stakeholder acts on these three macro-factors modifying them more or less. Note that the interaction between each macro-factor individually generates the change in their characteristics. The consequence of changes in characteristics of macro-factors is the change in their impact on the risk of the stakeholder, but also change in the way in which they react to the impact that company has on them.
If one considers, for example, the risk of Controlled Flight into Terrain, the availability of certain technology (e.g. Enhanced Ground Proximity Warning System) leads to prescribing its mandatory installation by organisations such as ICAO, US FAA or EASA in Europe. All of these results in changes that introduce new technologies in the legal environment of the country in which an airline operates. By incorporating this technology in aircraft it is necessary to adapt procedures and training of the crew in order for technology to be used most efficiently. The result of all these activities is the total reduction in the level of risk in the system.
Keeping the analogy with the system of the lumbar spine, the safe state of the air transport system (or each of its stakeholders) corresponds to the resistance to injury. According to Sušić ([31]., p.1), this is "the result of the continuous process of the internal control, always striving to influence the distribution of internal forces by a process that aims to optimise the allocation of roles and load through physiological logic in order to reduce the risk of injury to the spine." [26, p.1]
7
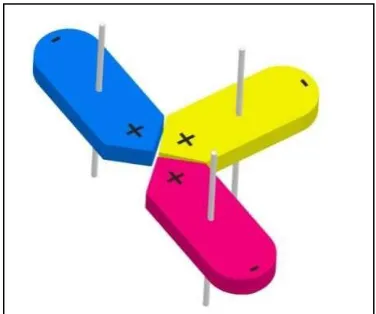
Figure 4. MARS Model Physical Representation
The value of risk within the system observed is expressed as Equation 1:
𝑅 = 1
𝑊𝐸∙η𝐸+𝑊𝐻∙η𝐻+𝑊𝑇∙η𝑇, 𝑅 ∈ 𝑹 (1)
Where:
𝑅 the total risk of the system,
𝑊𝐸 the weight of Environment macro-factor,
𝑊𝐻 the weight of Human macro-factor,
𝑊𝑇 the weight of Technology macro-factor.
η𝐸 the total efficiency of influence for Environment macro-factor,
η𝐻 the total efficiency of influence for Human macro-factor,
η𝑇 the total efficiency of influence for Technology macro-factor.
The mass of each block (representing macro-factor) in (1.) is:
𝑊𝑖 = 1 − (
𝐶𝑂𝑖
𝐶𝑇𝑇𝐿) , 𝑊𝑖 ∈ [0, . . ,1], 𝑖 = 𝐸, 𝐻, 𝑇 (2)
𝑊𝑖 ∈ 𝑹, 𝐶𝑂𝑖 ∈ 𝑁, 𝐶𝑇𝑇𝐿∈ 𝑁
With:
𝐶𝑇𝑇𝐿 the total number of events with reduced level of safety,
𝐶𝑂𝑖 the number of events where destabilisation was observed due to one specific macro-factor (indicated
by index).
Total efficiency of influence for each macro-factor (i.e. block of the model) is given by Equation 3:
η𝑀𝐹 = max {0,
(η𝑀𝐹𝑃1∙ 𝑘𝑀𝐹𝑃1+⋯+η𝑀𝐹𝑃𝑛∙ 𝑘𝑀𝐹𝑃𝑛)−(η𝑀𝐹𝑁1∙ 𝑘𝑀𝐹𝑁1+⋯+η𝑀𝐹𝑁𝑚∙ 𝑘𝑀𝐹𝑁𝑚)
(∑𝑛𝑖=1𝑘𝑀𝐹𝑃𝑖+∑𝑚𝑗=1𝑘𝑀𝐹𝑁𝑗) } (3)
Where:
8
𝑘𝑀𝐹𝑃𝑖 and 𝑘𝑀𝐹𝑁𝑗 are order of influence for positive and negative impact factors related to one macro-factor.
The values selected are related to a particular stakeholder or safety-case under study,
η𝑀𝐹𝑃𝑖and η𝑀𝐹𝑁𝑗 efficiency of influence for positive and negative impact factors related to one macro-factor.
The values in range from 0.1 to 0.9 as discussed in the text (see §4).
The maximum value for equation 3 is 0.9 while the minimum is 0. Although there might be cases where the solution of the equation 3 might be less than 0 we will assume that for all those cases the solution is 0. This is the case when the total efficiency of influence for negative impact factors is larger than for positive hence we conclude that the concerned macro-factor does not contribute to risk resilience and this is in line with the assumptions for MARS.
With all three equations presented we conclude that the risk value is a number from 0.37 to 10. More precisely speaking there is no upper limit for the risk value. When each and every block weight is close to or at 0, the value for risk is moving towards the infinity regardless of total efficiency of influence. At the other end the value of 0.37 indicates the optimal values of macro-factors’ weight and efficiency of influence. In that case each mass is 1 and corresponding efficiency of influence is 0.9.
4. MARS APPLICATION IN A CASE STUDY
Following conceptual discussion of the model, and the presentation of the mathematical representation of the risk value generated by the same model, a safety case study of missed approach risk is presented. In order to accomplish that MARS has been integrated into the real data from the flight operations of an airline. The risk of Missed Approach operations reported is to be evaluated by MARS in a specific organization. The input data for the model are the total number of observations, the number of observations related to each macro-factor of the model, the order of influence, and the efficiency of influence for each individual macro-factor. A missed approach is a normal form of flight operations. Flight crews are prepared and trained for it, if needed. However, as it does not happen too often, the crew usually report them and indicated the problems that they had at some of these events.
Lumbar spine as well as the observed system, experience the transition from steady state in unstable as a result of insufficient capacity to resist the destabilizing influences with all possible means. This will also make the use of analogies between their mechanical capacities possible. Mechanical capacity of an assembly, including the system of the lumbar spine, and in each macro-factor of MARS model corresponds to the difference of the total capacity of the system and that part of the capacity that is spent on losses. Hence difference between the total number of observations (i.e. missed approach flights performed) and the number of flights where the destabilization of one of macro-factors has been reported represents the ability of the system, or its capacity, to resist destabilization due to the effect of that macro-factor (as in Equation 4.)
𝐶𝑀𝐹 = 𝐶𝑇𝑇𝐿− 𝐶𝑂 (4)
where:
𝐶𝑀𝐹 ∈ [0, 𝐶𝑇𝑇𝐿]
and where:
𝐶𝑀𝐹 the number of events that did not result from destabilization due to one specific macro-factor studied.
𝐶𝑇𝑇𝐿 the total number of events with reduced level of safety,
𝐶𝑂 the number of events where destabilization was observed due to one specific macro-factor, i.e. the
inertia of the block has not been enough.
9
The total number of flights and the number of flights related to the destabilisation of each macro-factor are taken from Flight Data Monitoring system across January 2006 and February 2011. In this period, there were 2786 observed cases. This period also cases within it are divided into two adjacent periods. Sample 1 covers the period from January 2006 to March 2009, and Sample 2 period from April 2009 to February 2011. The number of missed approaches in these periods are 1741 and 1045 respectively.
Following one of the most common classification of safety related events (i.e. IATA STEADES) one has to break down safety cases in their elements that map to the one of macro-factors in MARS. Thus let us consider technical macro-factor to discuss in more details the elements of the Equation 1. Technological macro-factor is represented by a purple block on Figure 4. It may include events related to the technical means and the technological procedure applied in the process of transportation. The weight of the blocks is different and varies depending on the size of the financial investment in particular element. Each block has its own mass. Note that for the sake of this presentation the masses of blocks are not taken together as a system of mass. Following its physical meaning, weight block affects its inertia, and thus his behaviour when in operating environment exerts torque through the shaft on which it is located. The weight of 0 represents the moment when the block is the lightest and does not provide any resistance to change. The weight of 1 represents the greatest resistance to change in that block (e.g. human or technical or environment macro-factor of the system). Following Equation 4 and the physical interpretation of the mechanical capacity, one can divide the entire equation by the total number of observations 𝐶𝑇𝑇𝐿. This leads to the Equation 5 that describes the inertia and
the mass of a macro-factor (i.e. block) that is under consideration.
𝑊𝑀𝐹 = 1 − (
𝐶𝑂
𝐶𝑇𝑇𝐿) (5)
where:
𝑊𝑀𝐹 ∈ 𝑅, 𝑊𝑀𝐹∈ [0, . . ,1]
Analogue to the discussion of block’s mass one can conclude that the inertia of the block is 0 when all observed events were due to the destabilisation of the particular block. Consequently if none of the observed events can be associated with the block under consideration, then the inertia is 1. This way the weight of the block has been measured. The weight results in block’s inertia that is, on the other hand, important to determine the total resistance of a system to destabilisation. Above discussion prove that the usage of analogy from biomechanics has allowed operational evaluation of the level of risk. The assessment of the blocks’ masses has been independent of the knowledge of the amount of investment in a particular block with respect to a nominal maximum investment that would lead to the maximum mass of the block and the greater resistance to destabilisation consequently.
Numerically for the proposed case study the total number of missed approach events has been classified as per macro-factor and the time they happened. Taking in the account the total number of missed approach flights (𝐶𝑇𝑇𝐿) as well as those that have been observed to depend on a particular macro-factor (𝐶𝑂) the inertia (𝑊) of
[image:10.595.134.461.617.696.2]each macro-factor has been calculated using Equation 5 (see Table 1.)
Table 1. Mass values for each macro-factor in both case study samples
Sample 1 Sample 2
(𝑪𝑻𝑻𝑳= 𝟏𝟕𝟒𝟏) (𝑪𝑻𝑻𝑳= 𝟏𝟎𝟒𝟓)
T E H T E H
𝑪𝑶 603 448 267 341 279 182
𝑪𝑶/𝑪𝑻𝑻𝑳 0.35 0.26 0.15 0.33 0.27 0.17
𝑾 0.65 0.74 0.85 0.67 0.73 0.83
10
the macro-factors are the final element of the model used to characterise the level of risk of the system under consideration (i.e. an airline in case studied). Adopting the assumption of Reason that the safety space as constant change [34] MARS cannot assume a condition in which there is no positive nor negative activities (i.e. blocks must touch each one at their ends). Mathematically the absolute value of 𝑘 determines the shape of the end of each block in MARS model (round or sharp). As seen on Figure 3, the shape depends on whether at any particular moment in time there are activities, (i.e. control decisions) that organization performs as a response to the realistic risk.
Binary information on whether there is an influence or not is not good enough to quantify the value of risk. Qualitative representations of impact on the risk from each macro-factor have to be converted to quantitative values in an appropriate manner for the model to reflect the characteristics of the system. Converting qualitative into quantitative values has been addressed in the works related to the Multi-objective Decision Making that discuss problems in which experience and knowledge of the organization or system should be considered when making decisions.
One of the most challenging phase [35] in the process of multi-criteria analysis would be the identification problems and it has been accomplished by understanding the impact on the risk while developing model MARS. The overall impact is thus decomposed in sub-problems (i.e. macro-factors).
Positive and negative impacts are taken into account for the purpose of objective assessment of the overall impact on risk. This is not the only approach to selecting the set of factors that could significant impact. By changing the conditions to be taken into account one modifies the focus of model.
[image:11.595.183.409.445.503.2]Assigning a higher 𝑘 value to a positive impact or to a negative impact results in higher effect on the risk value in the final assessment. Hence assigning relevant 𝑘 values is of real importance. Therefore this task should be accomplished very carefully. Initial setup can be based on relevant standards (e.g. ICAO STEADES or similar). Additional 𝑘 adjustments can result in a more accurate assessment of the level risk corresponding to the conditions within the company or companies compared using MARS. Table 2 demonstrates the order of importance (i.e. rank) for various positive and negative impact for each of macro-factors in the case studied. Note that Table 2 is based on a research activity with a group of subject matter experts, following the approach developed by Sikora in [33].
Table 2.Order of importance for specific macro-factors
Rank Influence
1 TP5 TN3 EP3 EN4 HP5 HN5
2 TP2 TN1 EP6 EN3 HP1 HN7
3 TP3 TN2 EP5 EN6 HP3 HN4
4 TP1 TN4 EP7 EN2 HP4 HN1
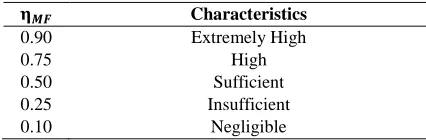
Having Equation 3 as the means to establish the total efficiency (η𝑀𝐹)of a macro-factor what remains to be calculated is efficiency of each and every positive or negative impact factors within that macro-factor. Nominally, they can assume values as per Table 3.
Table 3. The efficiency of macro-factor (η𝑀𝐹) ranges [32. p.86]
𝛈𝑴𝑭 Characteristics
0.90 Extremely High
0.75 High
0.50 Sufficient
0.25 Insufficient
0.10 Negligible
The value of η𝑀𝐹can go up to 0.9 because once can never be sure that the organization has fully exploited the
potential impact of a factor. Likewise the lowest value is 0.1 because even in the case that the degree of efficiency is negligible one has to take into account this little potential impact.
Note that this is only one of the possible choices for η𝑀𝐹 intervals. These can be based on decisions within
companies, adopted standards or using the experience of comparable organisations.
[image:11.595.190.403.590.660.2]11
Table 4. The efficiency of macro-factor impact factors in case study periods
TTL i Sample 1 Sample 2
TP2 23 15 21.4% 8 11.0%
TP3 2 1 1.4% 1 1.4%
TP1 38 19 27.1% 19 26.0%
TP4 80 35 50.0% 45 61.6%
ttl 𝑻𝑷𝒊 143 80 73
TTL i Sample 1 Sample 2
EP3 44 16 19.0% 28 28.3%
EP6 64 26 31.0% 38 38.4%
EP5 75 42 50.0% 33 33.3%
ttl 𝑬𝑷𝒊 183 84 99
TTL i Sample 1 Sample 2
HP2 49 25 29.4% 24 25.0%
HP3 22 11 12.9% 11 11.5%
HP1 99 40 47.1% 59 61.5%
HP4 11 9 10.6% 2 2.1%
ttl 𝑯𝑷𝒊 181 85 96
For example case study’s η𝑀𝐹 of impact factors for technological macro-factor for two observation periods is
[image:12.595.195.402.449.544.2]given in Table 5.
Table 5. The efficiency of technology macro-factor’s impact factors calculation
Sample 1 Sample 2
Impact
Factor k η η ∙ 𝑘 η η ∙ 𝑘
TP2 9 0.21 1.93 0.11 0.99
TP3 5 0.01 0.07 0.01 0.07
TP1 3 0.27 0.81 0.26 0.78
TP4 1 0.50 0.50 0.62 0.62
η𝑇= 0.18 η𝑇= 0.14
Similarly once established for each macro-factor η𝑀𝐹 allows us to find risk value in the system using Equation
1. (see Table 6 below)
Table 6. The Value of Risk for Two Periods in Case Study
Sample 1 Sample 2
T E H T E H
603 448 267 341 279 182
𝑪𝑶/𝑪𝑻𝑻𝑳 0.35 0.26 0.15 0.33 0.27 0.17
𝑾𝒊 0.65 0.74 0.85 0.67 0.73 0.83
𝛈𝒊 0.18 0.28 0.27 0.14 0.32 0.26
R 1.804407 1.839594
[image:12.595.164.431.599.692.2]12
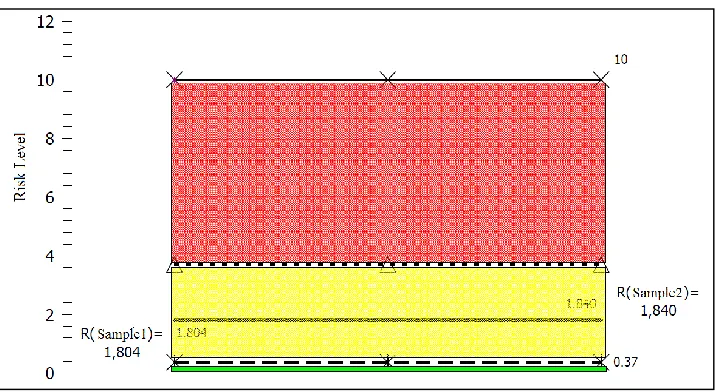
Figure 5. Overall risk level in the two samples
The acceptable of risk ends with 3.7 in this case study, as prescribed by the airline policy. Similarly it has been established that activities to reduce risk should be taken if its value is in the range of 3.7 to 10. Reference risk level limits depend on the individual stakeholder and indicate its attitude towards risk. Thus, the generative companies’ levels of acceptable risk will probably be lower than those in pathological or bureaucratic.
5. CONCLUSION
This paper focuses on safety in aviation, presenting in its first part a review of applicable literature in terms of aviation safety management, accident investigation and modelling of the risk. Modelling of the risk literature review encompassed work outside the aviation as well to cater for risk assessment and management in general. Having presented the state of the art general features of the actual available models, the paper shows the potentiality of MARS as a potential candidate to fill some of the gaps identified.
MARS takes into account the safety features of an organization in the aviation context (airport/ ground handling, an airline, or air navigation services provider, etc.). Due to the complexity of accident causation in contemporary systemic thinking an analogy to biometrics has been utilized to harvest the holistic view on accident causation even before the mishap addressing the system in its entirety. Hence, MARS is offered as a tool to utilize systems’ performance indicators for behavior in and out of the steady and normal state. Interconnected nature of model elements with feedback as a dependency between master-factors has been discussed and accounted for in conceptual as well as mathematical interpretation of the model.
Modular nature of MARS with possibility of adding or taking away positive or negative influences on risk related to each macro-factor has been introduced in order to simplify the process of reaching a measurable risk value holding a meaning for a variety of potential users of the model. This high-level information for decision makers is intended to enhance the organization’s safety level by giving them the feel on their actual influence on risk. The possibility of developing a quantitative holistic index capable of defining the safety features of the system could help the decision-maker in assigning resources and finding the criticalities in the process in order to enhance the safety level of the organization. At the same time the flexibility of defining input variables and reconfiguring the setup of the model allows for MARS to be used widely regardless of the stakeholder where it is applied.
13
REFERENCES
[1] Boeing, 2015. Current Market Outlook 2014-2033, USA 2015.
[2] EUROCONTROL, 2015. EUROCONTROL Seven-Year Forecast, February 2015 – Flight Movements and Service Units 2015-2021.
[3] Hollnagel, E., et al.: Resilience engineering: Concepts and precepts. Ashgate Publishing, Ltd., 2006. [4] Stroeve, S.H., Everdij M.H.C., Blom H.A.P., 2011. Studying hazards for resilience modelling in
ATM, First SESAR Innovation Days, Toulouse, France, 29 November-1 December 2011. [5] EUROCONTROL, 2009. A White Paper on Resilience Engineering for ATM, pp. 1-12.
[6] Roelen, A.: Causal risk models of air transport, Comparison of user needs and model capabilities. PhD Thesis, Technische Universiteit Delft, The Netherlands, 10.November 2008., p. 21.-22.
[7] Griffin, T.G.C.: The Flight of Information: New Approaches for Investigating Aviation Accident Causation. PhD Thesis, School of Engineering and Design, Brunel University, May 2010.
[8] Netjasov, F., Janić, M.: A Review of the Research on Risk and Safety Modelling in Civil Aviation. Third International Conference on Research in Air Transportation, Fairfax, VA, Canada, 1. June 2008, p. 169.-176.
[9] Weaver, D.: Symptoms of Operational Error. Professional Safety, Vol. 104, No. 2, October1971, p.39-42.[10] Bird, F.E., Loftus, R.G.: Loss Control Management. Institute Press, Loganville, Georgia, USA, 1976.
[11] Adams, E.: Accident Causation and the Management Systems. Professional Safety, October 1976, p.26-29.
[12] Reason, J., 1990. The contribution of latent human failures to the breakdown of complex systems. Philos. Trans. R. Soc. London 1990, pp. 475–484.
[13] Johnson, W.G.: MORT: The management oversight and risk tree. Journal of Safety Research, Vol. 7, No. 1, 1975, p.4-15.
[14] Groeneweg, J., Roggeveen, V.: Tripod: Controlling the human error components in accidents. Safety and Reliability, Proceedings of the ESREL 2003 Conference, 1998, p.809-816.
[15] Shappell, S.A., Wiegmann, D.A.: Applying Reason: The human factors analysis and classification system (HFACS). Human Factors and Aerospace Safety, Vol. 1, No. 1,2001, p.59-86.
[16] EUROCONTROL, 2009 B. Reporting and Assessment of Safety Occurrences in ATM ESARR-2. [17] Di Gravio, G., Patriarca, R., Mancini, M., Costantino, F., 2014. ATM safety management: reactive and
proactive indicators, Proceedings of the Fourth SESAR Innovation Days (SIDs 2014), 25th – 27th November, Madrid, Spain.
[18] Di Gravio, G., Mancini, M., Patriarca, R., Costantino, F., 2015 A. Overall safety performance of the Air Traffic Management system: indicators and analysis, Journal of Air Transport Management, vol. 44-45, pp. 65-69, 2015.
[19] Di Gravio, G., Mancini, M., Patriarca, R., Costantino, F., 2015 B. Overall safety performance: forecasting and monitoring, Safety Science, vol. 72, pp. 351-362, 2015.
[20] Rasmussen, J.: Risk management in a dynamic society: a modelling problem. Safety Science, Vol. 27, No. 2-3, 1997, p.183-213.
[21] Perrow, C.: Normal Accidents: Living with High-risk Technologies. Princeton University Press, 1999. [22] Rijpma, J. A.: Complexity, Tight Coupling and Reliability: Connecting Normal Accidents Theory and
High Reliability Theory. Journal of Contingencies and Crisis Management, Vol. 5, No. 1, March 1997, p.15-45.
[23] Safety Management, Annex 19 to the Convention on International Civil Aviation, ICAO, Montreal, July 2013.
[24] Leveson, N.: Engineering a Safer World. MIT, Aeronautics and Astronautics, Cambridge, MA, SAD, 2011.
[25] Leveson, N, et al.: Risk Analysis of NASA Independent Technical Authority, MIT, Cambridge, MA, SAD, 2005.
[26] Stanton, N.A., et al.: Modelling Command and Control. Aldershot, UK, 2008.
14
[28] Stoop, J., Dekker, S.: Limitations of ‘Swiss Cheese’ Models and the Need for a Systems Approach, ISASI 2009, Proceedings, p. 52.-59.
[29] Hollnagel, E., 2012. FRAM: The Functional Resonance Analysis Method; Farnham, England: Ashgate, 2012.
[30] Hollnagel, E., 2010. An introduction to the Resilience Analysis Grid (RAG), Sustainable Transformation: Building a Resilient organization, Toronto, Canada, 2010.
[31] Sušić, A.: Statičko i dinamičko utvrđivanje mehaničkog kapaciteta slabinske kralješnice, magistarski rad, Sveučilište u Zagrebu, Fakultet strojarstva i brodogradnje, Zagreb, 2002.
[31] Hansen, L. et al.: Anatomy and Biomechanics of the Back Muscles in the Lumbar Spine With Reference to Biomechanical Modeling, 2006.
[32] Sušić, A. et al.: Rapid Ergonomic Assessment Methodology For Engineering Design, Proceedings of 4th International Ergonomics Conference, Ergonomics 2010., Stubičke Toplice, 2010.
[33] Sikora, I.: Defining a Proactive Risk Monitoring System in Airlines. Doctoral Thesis, Faculty of Transport And Traffic Sciences, Zagreb, Croatia, July, 2013.
[34] Reason, J.: Managing The Risk of Organizational Accidents, Ashgate Publishing Company, Burlington, USA, 1998.