City, University of London Institutional Repository
Citation:
Dhand, A. & Pullen, K. R. (2015). Analysis of continuously variable transmission for flywheel energy storage systems in vehicular application. Proceedings of the Institution of Mechanical Engineers, Part C: Journal of Mechanical Engineering Science, 229(2), pp. 273-290. doi: 10.1177/0954406214533096This is the accepted version of the paper.
This version of the publication may differ from the final published
version.
Permanent repository link:
http://openaccess.city.ac.uk/6411/Link to published version:
http://dx.doi.org/10.1177/0954406214533096Copyright and reuse: City Research Online aims to make research
outputs of City, University of London available to a wider audience.
Copyright and Moral Rights remain with the author(s) and/or copyright
holders. URLs from City Research Online may be freely distributed and
linked to.
Analysis of continuously variable transmission for flywheel energy storage systems in vehicular application
Aditya Dhand, Keith Pullen
School of Engineering and Mathematical Sciences
City University London
London EC1V 0HB, UK
Email: [email protected]
Abstract
Energy storage devices are an essential part of hybrid and electric vehicles. The most commonly used ones are batteries, ultra capacitors and high speed flywheels. Among these, the flywheel is the only device that keeps the energy stored in the same form as the moving vehicle i.e. mechanical energy. In order to connect the flywheel with the vehicle drive line, a suitable means is needed which would allow the flywheel to vary its speed continuously, in other words a continuously variable transmission (CVT) is needed. To improve the efficiency and speed ratio range of the variators, a power spilt CVT (PSCVT) can be employed. This paper discusses the kinematics of PSCVT used to connect the flywheel to the driveline. A methodology describing the characteristic equations of speed ratio, power flow and efficiency of the PSCVT for various types including power recirculating and multi regime in both directions of power flow, has been presented. An example of a PSCVT for a flywheel energy storage system (FESS) is computed using the derived equations and the results compared.
Keywords: Flywheel, Planetary gear set, Continuously variable transmission, Kinematics, Efficiency
1. Introduction
Flywheels have been used to store energy since many years. High speed flywheels have the characteristics of high specific power, high specific energy, long cycle life, high energy efficiency, quick recharge, low cost and environmental friendliness. They do not suffer from temperature dependence and their state of charge is most easily determined. Their attractive properties make them an excellent secondary storage device to be used in hybrid vehicles (HV) and electric vehicles (EV). The flywheel needs to be connected to the driveline in a manner that allows the flywheel to change its speed independently of the velocity of the vehicle. The flywheel hybrid vehicle can have both parallel and series layout, though usually the parallel layoutis used. The various configurations, their advantages and disadvantages have been presented by Dhand and Pullen1. As the flywheel
and is expected to be lower in cost. One main difference between the mechanical CVT used in conventional vehicle as compared to the ones required for FESS is that they have to be bi-directional and highly efficient in both directions. Besides the efficiency, the ratio range which is defined as the maximum to minimum speed ratio is a very significant parameter of the CVT.
There are different types of variators and the most common ones used in automotive application are the rolling traction drives and the belt drives. In the belt type power is transmitted over a belt, chain or band clamped between two pulleys. The speed ratio is varied by varying the axial clamping forces for the two halves of the pulleys thereby changing the rolling radii on the pulleys. The clamping forces are usually controlled via hydraulics. In the rolling traction drives, the power is transmitted between two rolling elements separated by lubricant film. In the toroidal drive the inclination of the roller disc in the toroidal cavity is changed to vary the ratio. The required system torque is set by applying a force to the roller hydraulically which allows the roller to follow the ratio automatically, thus the drive is torque controlled. Fuchs et al.2 and Srivastava and Haque3 have given a detailed review of the toroidal variator and the belt type respectively. However the disadvantage for these variators is that their ratio range which is defined as the maximum to minimum ratio is very limited. Currently most designs have a ratio span from around 0.4 to 2.4 giving a ratio range of 6, which generally is not sufficient for FESS. Their efficiencies are usually lower than fixed ratio gearing. Kluger and Long4 suggested that the highest achievable overall efficiencies for manual transmission and automatic transmission (AT) are 96.7% and 86.7% respectively, while the CVT is expected to be 88.4% and 91% for the belt and the toroidal type. Though the efficiency of currently available variators is expected to have increased, these numbers give an indication of the difference.
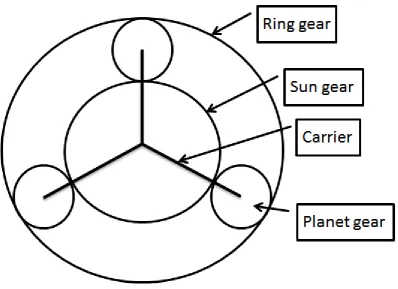
Figure 1 Planetary Gear Set7
The PSCVT can be designed to achieve the desired speed ratio range and high efficiency by increasing its complexity. A number of authors have discussed the concept of PSCVT (White5, 8, Yu and Beachley9, Hsieh and Yan10, 11, Mangialardi and Mantriota12, 13, Mantriota14, 15, 16, 17, 18, Fussner and
Singh19). Either these have been discussed as lossless systems or as one directional systems. Only a few authors (Beachley et al.20, Martinez-Gonzales21, Bottiglione and Mantriota22) have partly discussed the PSCVT for a FESS. Martinez-Gonzales21 applied White’s5 treatment of PGS ratio to the design method for a general single regime input coupled PSCVT presented by Fussner and Singh19 to design a single regime PSCVT for FESS.
The following paper discusses the PSCVT concept for a FESS and the various modes of operation possible including power recirculation and multi-regime mode. It extends the technique used by Martinez-Gonzales21 to design single as well as multi-regime PSCVTs to meet the desired speed ratio coverage for FESS. It presents an application of the treatise of Pennestri and Freudenstein6 to derive equations specifying ratio of variator to input power and efficiency for the PSCVT in both directions of the power flow including the efficiency of the variator, fixed gears and PGS for power recirculating and multi-regime systems. The resulting simple methodology can be applied to design a transmission for FESS to provide any required speed ratio coverage and predict its efficiency in both directions of power flow.
methodology to design the single regime, multi-regime without power recirculation and two-regime with negative power recirculation PSCVT systems respectively to meet the speed ratio requirements given in section 5. Section 9 and its sub sections derive equations specifying the power flow and efficiency in both directions, of the three systems designed previously. Further section 10, compares the results of the speed ratio, ratio of variator to input power and efficiency of the three systems. Finally section 11 lists the conclusions of the paper.
2. Planetary Gear Set
As mentioned before, the power flows and kinematics of the PGS have been explained in great detail by White5. For a PGS, the basic ratio
R
can be defined as the ratio of speeds of any two shafts when the third one is held stationary. With different members being taken as the input, output and the stationary element, six ratios can be defined, though they can be easily derived from one another. In this analysis, like that of White’s5 the PGS members will not be specifically defined and generalised equations will be created. The fig 2 shows the general PGS with three branches labelled as 1, 2 and 3. In fig. 2 and all the figures describing the PSCVT which follow in the paper, the arrows signify power. The sign convention is that power flowing into the system is taken as positive and the power flowing out of the system is taken as negative. Equations 1-2 define the basic ratio. Equation 2 of the basic ratioR
is kept the same throughout the paper. The lossless PGS in equilibrium is defined by equations 3-5. In all following equations throughout the paperP
,n
andT
signify power, speed and torque respectively.Figure 2 Schematic of PGS (Arrows signify power. Power into the system is taken positive and out of the system as negative)
0 1 3
2
n
n
n
R
(1)) (
) (
2 1
2 3
n n
n n R
(2)
0
3 2 1
T
T
0
3 3 2 2 1
1
n
T
n
T
n
T
(4)) 1 (
2 1
3
R T R T T
(5)
3. Configurations of PSCVT
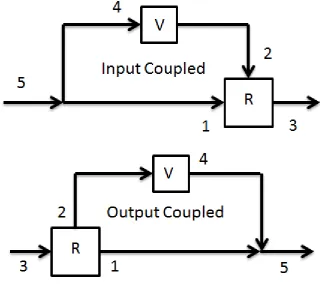
[image:6.595.74.400.369.654.2]As mentioned previously, the two elements needed to create a PSCVT are variator and PGS. The PGS can be connected to the variator in two ways. The input coupled (IC) system, where the torque is split at the common input shaft, speed remaining the same and the power is recombined via the PGS at the output. The second is the output coupled (OC) where the speed is divided at the input shaft connected to the PGS and the power is recombined at the common output shaft. The fig 3 shows the schematic of the two systems. The variator ratio is labelled as
V
in the fig. 3. In the IC system power is input at branch 5 and output at branch 3 and in the OC system input at branch 3 and output at branch 5 as shown in fig. 3.Figure 3 Input Coupled and Output Coupled PSCVT systems
5 3
n n
r (6)
2 4 4 2
T T n n
V (7)
1 4 5
n
n
n
(8)) 1
( R
V R
r (9)
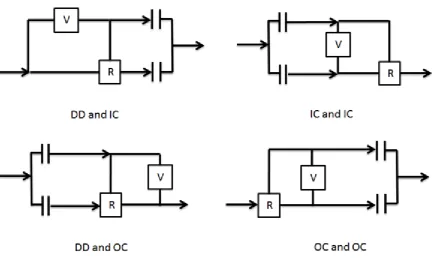
[image:7.595.77.515.358.646.2]The power flowing in the variator is of special concern as that is usually the least efficient part of the two branches. According to the power flow, three cases are defined for the IC PSCVT (and OC PSCVT), which are shown in fig 4. The first case is the no power recirculation case, the second is the case of positive recirculation which is distinguished by the fact that the power going through the variator is in the same direction as the output power and the third case of negative recirculation, in which the power going through the variator is in the opposite direction to that of the output power.
Figure 4 Different Power Regimes of PSCVT
For the case of a lossless IC PSCVT, the following equation 10 defines the ratio of variator power (
P
v)to input power (
P
i). Now using equation 5, 7, 9 and 10, equation 11 defines the value of ratio of1 4 4 1 1 4 4 4 4 1 4 4 5 4 T T T n T n T n T P P P P P P P i v (10) r R P P i v
1 (11)
Further equations 12-13 define the ratio range of the PSCVT (
r
t) and that of the variator (V
t).min max
r r
rt (12)
min max
V V
Vt (13)
Now it can be easily derived, as has been shown by White5, that for
r
t
V
t, power recirculation hasto exist. The important difference is that to have
r
t
V
t, for the case of negative recirculationr
min [image:8.595.74.270.73.151.2]will occur at
V
maxand vice versa, whereas for positive recirculation this condition isr
minatV
minand vice versa. In other words, for positive recirculation or no recirculation, a numerical increase in value of V will result in a numerical increase value ofr
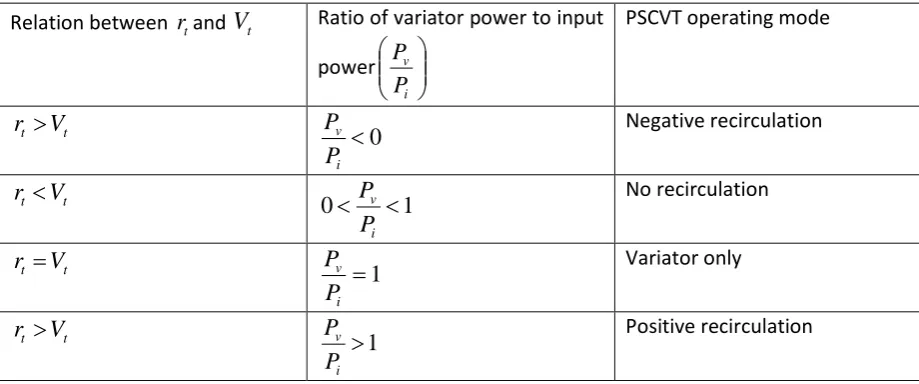
and the opposite is true for negative recirculation. Table 1 shows the conditions for the three types for IC PSCVT.Table 1 Conditions for different power modes of PSCVT to occur
Relation between
r
tandV
t Ratio of variator power to inputpower i v P P
PSCVT operating mode
t t
V
r
0 i v PP Negative recirculation
t
t
V
r
1
0
i v
P
P No recirculation
t t
V
r
1 i v PP Variator only
t t
V
r
1 i v PP Positive recirculation
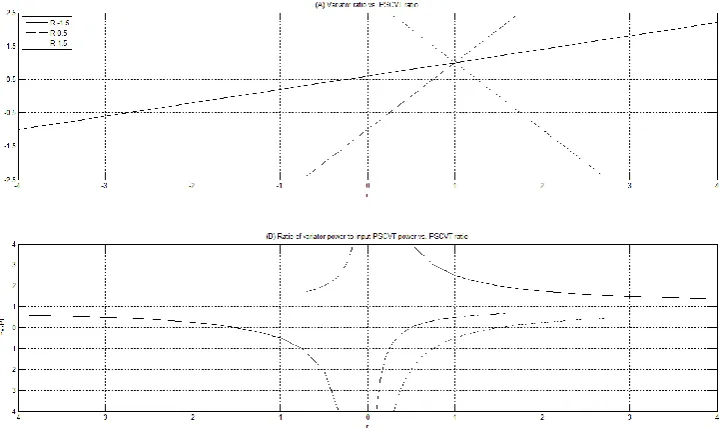
[image:8.595.67.527.451.643.2]Figure 5 Graph (A) shows the variation of variator ratio vs. PSCVT ratio. Graph (B) shows the variation of ratio of variator power to input power vs. PSCVT ratio
The OC PSCVT looks an inverse of the IC PSCVT; however they have different characteristics. Beachley et al.20 showed that for a designing a geared neutral and reversing OC PSCVT, the variator should have the ability to achieve zero and reverse ratio respectively. This is not possible by either the toroidal or belt variator as the sign of the speed ratio is fixed by mechanism23.
4. Multi regime PSCVT
The disadvantage of increasing the ratio range by using a power recirculating design is that in most cases more power will be flowing through the variator which will reduce the efficiency and the variator would have to designed bigger and heavier. The other way of increasing the ratio range in a PSCVT without power recirculation is the multi regime synchronous PSCVT which is discussed by White8 and later by Mantriota14, 15, 16.
Figure 6 Different types of Multi Regime PSCVT Systems
5. Requirements for FESS
In case of a FESS, the power will be flowing in both directions of the PSCVT during operation, so the IC PSCVT in the forward direction will behave as the OC PSCVT in the reverse power flow direction. In terms of ratio coverage it is not a problem since the IC PSCVT and the OC PSCVT will have the same coverage in both directions. Additionally if losses are not considered the ratio of variator power to input power will be same in both directions. However if losses are considered then the ratio of variator power to input power will be different and has to be separately analysed. The PSCVT for FESS does not require a speed reversal as the flywheel will only be used during forward motion. Therefore a clutch would be necessary for disconnecting the PSCVT during reverse vehicle motion. The IC PSCVT design can be used to create geared neutral, as it was shown before, however the power recirculation will be very high. Since a clutch would be present, it would make sense to use it to achieve neutral condition by allowing it to slip.
An example is now taken to describe the analysis for a FESS. The flywheel in a FESS usually rotates at high speeds; in this case its operation is from 15,000 rpm to 30,000 rpm. The other shaft which is connected to the vehicle driveline operates from 0 rpm to 10,390 rpm. With the help of a slipping clutch the shaft can operate from 1000 rpm to 10,390 rpm. This gives us the following conditions for the limits of PSCVT (equations 14-16).
69
.
0
15000
10390
:
max
033
.
0
30000
1000
:
min
r
(15)909 . 20 :
min max
r r
rt (16)
The limits of the variator are taken to be the following (equations 17-19).
4
.
2
:
max
V
(17)4
.
0
:
min
V
(18)6 :
min max
V V
Vt (19)
6. Design of single regime PSCVT
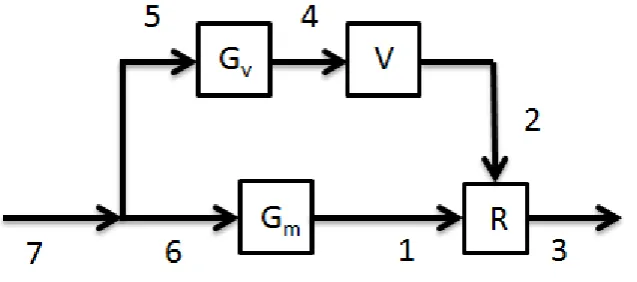
[image:11.595.76.395.415.556.2]For designing the PSCVT to achieve specific limits of operation, additional gearing is necessary, as explained by Fussner and Singh19. The fig 7 below shows the schematic of the PSCVT in consideration. The additional gears are represented by gear ratios
G
m andG
v.Figure 7 Schematic of single regime PSCVT with additional gearing to achieve required operation limits
In this case the following equations 20-24 define the kinematics of the PSCVT system in the forward power flow direction.
7 3
n
n
r
(20)4 2
n n
V (21)
5 4
n n
6 1
n n
Gm (23)
7 6 5
n
n
n
(24)Now using equation 9 and modifying it for the above system, the following equation 25 defines the relationships between various ratios.
)
1
(
R
VG
RG
r
m
v
(25)The other thing to look at is the ratio of variator power to input power to the PSCVT. The following equation 26 gives the ratio for a lossless system.
) 1
( R
RG V
G V G P
P
m v
v
i v
(26)
As it is observed in the requirements for the transmission specified in section 5,
r
t
V
t, therefore power recirculation would be necessary in any single stage design.6.1.Case of positive power recirculating design of PSCVT
First the case for positive power recirculation is considered, which implies
r
minoccurs atV
minandvice versa. Taking a fixed value of
R
, the values ofG
mandG
vcan be calculated by simultaneously solving the following two equations 27-28.)
1
(
max
max
RG
V
G
R
r
m
v
(27))
1
(
min
min
RG
V
G
R
r
m
v
(28)Now the numerical value of
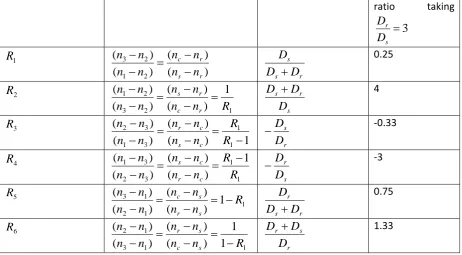
R
will depend on how branches of the PGS are defined physically, as shown in table 2. Taking a reasonable value of 3 for ratio of ring gear diameter to sun gear diameter, the last column of table 2 shows the different numerical values ofR
.The diameters of the ring and sun gears are labelled asD
randD
s in table 2. As can be observed from table 2, the definitionR
1 can be used to derive all the other definitions. In other words each definition can be used to derive the others.Table 2 Definitions of basic ratio of the PGS depending on branch connections
ratio taking 3 s r D D 1
R
) ( ) ( ) ( ) ( 2 1 2 3 r s r c n n n n n n n n r s s D D D 0.25 2R
1 2 3 2 1 1 ) ( ) ( ) ( ) ( R n n n n n n n n r c r s s r s D DD 4
3 R 1 ) ( ) ( ) ( ) ( 1 1 3 1 3 2 R R n n n n n n n n c s c r r s D D -0.33 4
R
1 1 3 2 3 1 1 ) ( ) ( ) ( ) ( R R n n n n n n n n c r cs
s r D D -3 5 R 1 1 2 1 3 1 ) ( ) ( ) ( ) ( R n n n n n n n n s r s
c
r s r D D D 0.75 6 R 1 1 3 1 2 1 1 ) ( ) ( ) ( ) ( R n n n n n n n n s c s r r s r D D
D 1.33
[image:13.595.68.531.73.328.2]Using the numerical values of
R
from the last column of table 2, and specific limits of the PSCVT defined in equations (14-19), the corresponding values ofG
mandG
vare calculated by using equations 27-28 and shown in table 3.Table 3 Values of Gm and Gv to achieve required PSCVT ratio limits in case of positive power recirculation
Case 1 2 3 4 5 6
R 0.25 4 -0.33 -3 0.75 1.33
m
G
1: -2.54 1: -40.6 1:3.35 1:30.4 1: -7.62 1: -13.5v
G
1:2.28 1: -9.13 1:4.04 1:12.18 1.31:1 1: -1.004As can be seen from the table 3,
G
mandG
vcan be defined for any value ofR
, although some of the values might be impractical like cases 2, 4, 5 and 6.6.2.Case of negative power recirculating design of PSCVT
Similarly for the case of negative power recirculation equations 27-28 will become the following.
)
1
(
max
min
RG
V
G
R
r
m
v
(29))
1
(
min
max
RG
V
G
R
In other words the condition will be that
r
minoccurs atV
maxand vice versa. Again using the above [image:14.595.67.530.184.253.2]equations 29-30, values of R from table 2 and limits of the PSCVT defined in equations (14-19) and solving for
G
mandG
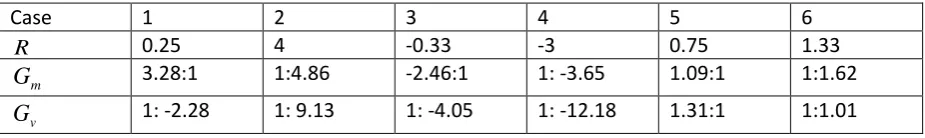
v, table 4 shows the corresponding values for negative power recirculation.Table 4 Values of Gm and Gv to achieve required PSCVT ratio limits in case of negative power recirculation
Case 1 2 3 4 5 6
R 0.25 4 -0.33 -3 0.75 1.33
m
G
3.28:1 1:4.86 -2.46:1 1: -3.65 1.09:1 1:1.62v
G
1: -2.28 1: 9.13 1: -4.05 1: -12.18 1.31:1 1:1.01Similar to the positive power recirculation case, there are some combinations such as cases 2 and 4 which would be impractical.
6.3.Comparison of Power flow in case of positive and negative power recirculation designs
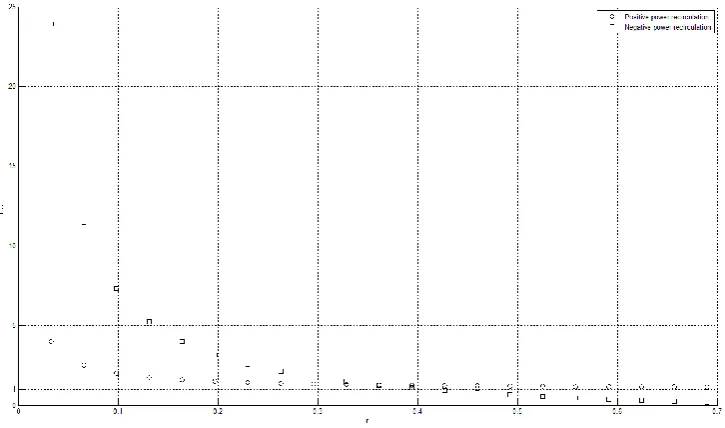
Using equation 26, the ratio of variator to input power can be calculated for the case of positive and negative power recirculation as a function of PSCVT ratio. The following fig 8 shows the ratio of variator power to input power for both positive as well as negative power recirculation in terms of
magnitude. It can be seen from the fig 8 that at lower ratios the i v
P P
value can be very high for both
cases and especially for the case of negative recirculation. Although it can also be seen that for
higher values of
r
, the ratio i vP P
for negative recirculation can be below unity which would mean
that less power would be going through the variator. Since the variator has to be sized to carry the power, the negative recirculation case would not be suitable. In the further analysis the case of negative power recirculation will not be considered. Note that the values shown in fig. 8 for positive power recirculation and negative power recirculation will be the same for any combination of R,
m
Figure 8 Ratio of variator power to input power vs. PSCVT ratio for positive and negative power recirculation
7. Design of multi regime PSCVT without power recirculation
The other option of increasing the ratio range without power recirculation is using a multi regime PSCVT.
7.1.Two-regime PSCVT without power recirculation
Fig 9 shows a two-regime PSCVT. There are two clutches used for synchronous shift between the two regimes and are labelled as A and B in fig. 9. Also
G
1,G
2 andG
3are gear ratios of additionalgears necessary to achieve the required ratio range. The following equations define the ratio range for the two-regime PSCVT. Equations 31-33 are common for the PSCVT, while equations 34-35 give the PSCVT ratio for stage 1 and stage 2.
8 3
n n
r (31)
5 4
n n
V (32)
7 6 8
n
n
n
(33)1 2
)
1
(
R
G
RVG
r
(34)V
R
G
G
G
RG
r
2 3(
1
)
3 1
In the first stage, clutch A will be closed and clutch B will be open. The variator ratio
V
will go frommin
V
toV
max and at the end of the first stage the speedn
4will be equal toV
max
n
7. For thesynchronization to happen to shift from stage 1 to stage 2, the following condition (equation 36) should be there.
max 3
V
G
(36)Figure 9 Two-Regime PSCVT without power recirculation
Now it can be easily shown that for two-regime system
r
twill be equal toV
t. Using equations 34-35, the following equations 37-38 define the end conditions for the system.1 min 2
min
(
1
R
)
G
RV
G
r
(37)min 3 2 3 1 max
) 1 (
V R G G G RG
r (38)
t
t V
V V V
G r
r
r
min max min
3 min max
(39)
From equation 39, it can thus be concluded that a two-regime PSCVT (without power recirculation) cannot be used to increase the ratio range of the PSCVT beyond the ratio range of the variator. According to the authors, the simple derivation of this condition has not been presented previously. Mantriota16 mentioned that the ratio range for a 4-regime PSCVT is equal to 2
t
V . For the present case where the required ratio range is around 21, the system most suitable would be a three-regime PSCVT which will be discussed further.
7.2.Three-regime PSCVT without power recirculation
[image:18.595.75.521.419.628.2]Fig 10 shows the general 3-regime PSCVT. Again clutches A, B and C are labelled in fig. 10, which are needed for synchronous shifts. Again
G
1,G
2 ,G
3,G
4andG
5 are gear ratios of additional gears necessary to achieve the required speed ratio range.Figure 10 Three-Regime PSCVT System without power recirculation
9 3
n n
r (40)
5 4
n n
V (41)
9 6 1
n n
G (42)
9 7 2
n n
G (43)
9 8 3
n n
G (44)
5 2 4
n n
G (45)
4 1 5
n n
G (46)
For stage 1, the clutch A will be closed and clutches B and C will be open. The following equation 47 gives the ratio for PSCVT in stage 1.
)
1
(
4 1 5
1
G
G
G
R
RVG
r
(47)In this stage the variator ratio
V
will go fromV
mintoV
max and at the end of the first stage the speed4
n
will be equal toV
max
n
9
G
1. Now if the following condition (equation 49) is satisfied,synchronisation will take place.
1 max 3
V
G
G
(48)For stage 2, the clutch C will be closed and clutches A and B will be open. Equation 49 gives the PSCVT ratio for stage 2.
V
R
G
G
G
RG
r
4 3(
1
)
5 3
(49)1 1 min max min
3
2 G VG
V V V
G
G t (50)
)
1
(
4 2 5
2
G
G
G
R
RVG
r
(51)As in the case of power recirculation, the values of
G
1,G
4andG
5can be computed for a given valueof
R
to achieve the end conditions of PSCVT ratio. In this case two parameters to compute are given by the following equations 52-53.5 1 15
G
G
G
(52)4 1
14
G
G
G
(53)Now using equations 47, 51, 52 and 53, the equations for PSCVT ratio end conditions are given by equations 54-55 as follows.
)
1
(
14 15 min
min
RV
G
G
R
r
(54))
1
(
14 15 max
max
RV
V
G
G
V
R
r
t
t
(55)Again using the numerical values of
R
from the last column of table 2, and specific limits of the PSCVT defined in equations (14-19), the corresponding values ofG
14 andG
15are calculated by using [image:20.595.67.536.535.602.2]equations 54-55 and are shown in table 5.
Table 5 Values of G14 and G15 to achieve required PSCVT ratio limits in case of three-regime system
Case 1 2 3 4 5 6
R 0.25 4 -0.33 -3 0.75 1.33
14
G
0.0221 -0.0055 0.0125 0.0042 0.0664 -0.049815
G
0.164 0.0103 -0.123 -0.0137 0.0547 0.0308Using the values of
G
14 andG
15from the table 5, equations 52-53 and assuming suitable value for1
G
, the values ofG
4andG
5can be computed. Although it might seem thatG
1is redundant, itsimportance can be gauged from the above table 5. If
G
1is taken to be unity, thenG
4andG
5will havehighly impractical values.
is a compromise between the single regime system and three-regime system is the two-regime system with negative power recirculation as was briefly mentioned in section 4.
8. Design of two-regime PSCVT with negative power recirculation
[image:21.595.75.486.350.620.2]The third option would be a two stage system with negative power recirculation. As mentioned in section 4 such a system would have one direct stage; the other being an OC or IC stage and this other stage would involve negative power recirculation. Moreover the direct drive stage can either be the first stage or the second stage. Fig. 11 shows this kind of system with the first stage as DD and second stage as IC. There are two clutches used for synchronous shift between the two regimes and are labelled as A and B in fig. 11. Also
G
v,G
m and Gare gear ratios of additional gears necessary to achieve the required ratio range. An example of this design is shown by White24.Figure 11: Two-regime PSCVT system with power recirculation
The following equations 56-62 define the system.
5 4
n n
6 1
n n
Gm (57)
4 8
n n
V (58)
7 10
n n
r (59)
3 11 *
n n
G (60)
5 6
7
n
n
n
(61)2 8
9
n
n
n
(62)For stage 1, clutch A is closed and B is open and equation 63 gives the PSCVT ratio.
v
VG
r
(63)For stage 2, clutch A is open and B is closed, with the ratio given by equation 64.
)) 1 ( ( * R VG RG G
r m v (64)
For synchronous shift to happen between stage 1 and stage 2, the following condition should be satisfied. m v v RG R G V G V G ) 1 ( max max * (65)
Now using the limits of the variator ratio and the PSCVT ratio,
G
vandG
mcan be calculated as follows.min min
V r
Gv (66)
) ( ) ( ) 1
( max min
t t t m r V R r r V R G (67)
An interesting point is that in this case unlike others the value of
G
vis fixed with the limits and doesnot change with respect to R. Again using the numerical values of
R
from the last column of table 2, and specific limits of the PSCVT defined in equations (14-19), the corresponding values ofG
m and*
Table 6 Values of Gm and G* to achieve required ratio limits for two-regime PSCVT with negative power recirculation
Case 1 2 3 4 5 6
R 0.25 4 -0.33 -3 0.75 1.33
m
G
1: -1.26 1:5.04 1.057:1 1:2.83 1: -11.34 1:15.12*
G -3.97:1 1:1.006 -2.23:1 1: -1.341 -11.9:1 8.94:1
9. Efficiency of PSCVT
9.1.Efficiency of the PGS
Up till now the PSCVT system has been considered to be lossless and equations involving power flow were derived taking into account this assumption. In reality all the mating elements of the PSCVT system will have efficiencies. The next set of equations will take the efficiency into account. Pennestri and Freudenstein6 derived a methodology to define the mechanical efficiency of the two degree of freedom PGS. The methodology has been used here to create the efficiency of the PGS. Only the meshing losses have been considered in the analysis. Pennestri and Valentini25 demonstrated the numerical equivalence of the various approaches available in literature to calculate the mechanical efficiency of the PGS.
According to Pennestri and Freudenstein6, a two degree of freedom PGS can be represented as shown in the following fig 12. In the fig. 12
m
,n
andp
are the three branches of a generic PGS.Figure 12 Power Flow in PGS
[image:23.595.76.297.501.583.2]p p n m
p K n K n n n
n 1 2 ' '' (68)
n m p pgs
P
P
P
(69)n m p p p p p
p P P T n n P P
P ' '' ( ' '' )
1
2 (70)1
K
andK
2are constants which depend on the gear ratios in the PGS. Now combining equations68-70, the efficiency of the PGS can be defined in terms of
1and
2as shown in equation 71.p n p m pgs
n
n
K
n
n
K
2 2 1 11
1
1
(71)Now utilizing the principle explained above the efficiency of the PGS can be calculated depending on the direction of power. The efficiency of the individual path in the PGS is defined as
m(np)wherem
[image:24.595.74.374.424.546.2]is the fixed link and the power is flowing from
n
top
. Two cases (case 1 and case 2) of different power flows are shown below in fig 13 which represent the power flows in the PGS of an IC PSCVT and OC PSCVT as shown in fig. 3.Figure 13 Cases of Power Flow in PGS of IC PSCVT and OC PSCVT from fig. 3
Using the principle from above, the efficiencies of the case1 and case 2 are defined by equations 72-73 respectively. 3 2 ) 3 2 ( 1 3 1 ) 3 1 ( 2 1
_
(
1
)
1
n
n
R
n
n
R
pgs
(72) ) 2 3 ( 1 3 2 ) 1 3 ( 2 3 1 2_
(1 )
R n n R n n9.2.Efficiency of the IC PSCVT without power recirculation
Now applying equation 72 to the case shown in fig 7 (IC PSCVT, no power recirculation) and using equations 20-24, the efficiency of the PSCVT is defined as follows in equation 74. The symbols
v,Gm
and
Gvrepresent the efficiencies of the variator, fixed gearsG
mandG
vrespectively. It is assumed that these efficiencies are the same in both forward and reverse power flow, though in reality the efficiency especially that of the variator would be different in both directions and can be easily incorporated in the equations.v Gv
v
Gm m
PSCVT
R
G
R
VG
r
) 3 2 ( 1 ) 3 1 ( 2)
1
(
(74)As stated before, the ratio of variator power to input power will also depend on the efficiency. Introducing efficiencies in the PGS system, equation 5 will become the following.
) 3 2 ( 1 2 ) 3 1 ( 2 1 3 ) 1 (
R T R T T (75)Now using equation 75 and 26, the variator power to input power ratio for the case IC PSCVT and no power recirculation is shown by equation 76.
) 3 1 ( 2 ) 3 2 ( 1 7 5 7 4 ) 1 (
Gm m Gv v v Gv v v Gv Gv i v R RG V G V G P P P P P P (76)9.3.Efficiency of the OC PSCVT without power recirculation
Figure 14 Schematic of OC PSCVT without power recirculation
Equations 77-81 define the OC PSCVT. It is easily seen that the values of
r
,V ,G
vandG
mare just theinverse of IC PSCVT (equations 20-23). The equation of
R
is kept the same throughout the paper (equation 2).3 7
n
n
r
(77)2 4
n n
V (78)
4 5
n n
Gv (79)
1 6
n n
Gm (80)
7 6 5
n
n
n
(81)Now using equation 73 and 77-81, the efficiency for the OC PSCVT can be defined as follows.
) 2 3 ( 1 )
1 3 (
2 (1 )
RVG r R
G r
v Gv v
m Gm
PSCVT (82)
Equation 5 can be re written for this case as follows.
) 1 (
2 )
2 3 ( 1 3
R T T
(83)3 3 2 2 3 2 n T n T P P P P i
v
(84) v i v VG r R P P ) 2 3 ( 1 ) 1 (
(85)It can be appreciated that equations (76 and 85) describing the ratio of variator power to input power are different for the case of IC PSCVT and OC PSCVT once the efficiencies are considered.
9.4.Efficiency of the Single regime PSCVT with positive power recirculation
9.4.1. Efficiency of the single regime IC PSCVT with positive power recirculation
[image:27.595.75.397.413.552.2]The Equations derived previously are for the case with no power recirculation. However for the case of positive recirculation with efficiencies different set of equations need to be derived. Considering the case for positive power recirculation for IC PSCVT shown in fig 15 and including the efficiencies, the following (equations 86-87) can be derived, using the terminology stated in equations 20-24.
Figure 15 Schematic of IC PSCVT with positive power recirculation
)
1
(
) 1 2 ( 3 7 5 7 4R
RG
V
G
V
G
P
P
P
P
P
P
Gm m Gv v v Gv v v Gv Gv i v
(86) v Gv v Gm mPSCVT
VG
R
9.4.2. Efficiency of the single regime OC PSCVT with positive power recirculation
[image:28.595.74.390.174.321.2]Similarly for the case of OC PSCVT with positive power recirculation as shown in fig 16, the following equations 88-89 can be derived. The terminology used is defined in equations 77-81.
Figure 16 Schematic of OC PSCVT with positive power recirculation
v i
v
VG r R
P P
) 2 3 ( 1
) 1
(
(88)
v Gv v
Gm m PSCVT
VG
R
G
R
r
(
1
)
) 2 1 ( 3 )
2 3 ( 1
(89)Again it can be seen from equations 76 and 86 that with the inclusion of efficiencies, the ratio of variator power to input power is different for the case of no power recirculation and positive power recirculation. It can therefore be said that when efficiencies are concerned, different cases have to be analysed separately.
9.5.Efficiency of the Three-regime PSCVT without power recirculation
9.5.1. Efficiency of the three-regime IC PSCVT without power recirculation
during the individual stages. Table 7 shows the corresponding equations for three-regime IC PSCVT. The terminology used is defined in equations 40-46.
Table 7 Equations for three-regime IC PSCVT system
i v P P PSCVT
Stage 1 5 4 ) 3 2 ( 1 ) 3 1 ( 2 5 4 1)
1
(
1
VG
R
G
R
G G v G
1 4 ) 3 2 ( 1 1 4 1 5 ) 3 1 ( 2 15
(
1
)
G G G G V
G
G
R
VG
RG
r
Stage 2 4 5 ) 3 1 ( 2 ) 3 2 ( 1 4 5 3)
1
(
1
G
R
V
RG
G G v G
V
G
G
R
G
RG
r
v G G GG
1(2 3) 4 33 4 3 5 ) 3 1 ( 2 3
5
(
1
)
Stage 3 5 4 ) 3 2 ( 1 ) 3 1 ( 2 5 4 2)
1
(
1
VG
R
G
R
G G v G
2 4 ) 3 2 ( 1 2 4 2 5 ) 3 1 ( 2 25
(
1
)
G G G G V
G
G
R
VG
RG
r
9.5.2. Efficiency of the three-regime OC PSCVT without power recirculation
For the reverse power flow direction equations 90-96 define the parameters. As previously for the case of reverse power flow the values of
r
,V ,G
1,G2,G
3,G4andG
5are inverted.3 9
n n
r (90)
4 5
n n
V (91)
6 9 1
n n
G (92)
7 9 2
n n
G (93)
8 9 3
n n
G (94)
2 5 4
n n
1 4 5
n n
[image:30.595.74.531.163.317.2]G (96)
[image:30.595.70.532.527.640.2]Table 8 shows the corresponding equations for three-regime OC PSCVT.
Table 8 Equations for three-regime OC PSCVT system
i v
P
P
PSCVTStage 1 5 1 ) 1 3 ( 2 5 G VG r
R
G
4 4 ) 2 3 ( 1 5 5 ) 1 3 ( 2 11
(
1
)
G
R
VG
R
G
r
G
v
G
GStage 2 3 4 ) 2 3 ( 1 4 ) 1 ( G G Vr R G
4 4 ) 2 3 ( 1 5 5 ) 1 3 ( 2 33
(
1
)
G
V
R
G
R
G
r
G
G
v
GStage 3 5 2 ) 1 3 ( 2 5 G VG r
R
G
4 4 ) 2 3 ( 1 5 5 ) 1 3 ( 2 22
(
1
)
G
R
VG
R
G
r
G
v
G
G9.6.Efficiency of the Two-regime PSCVT with negative power recirculation
9.6.1. Efficiency of the Two-regime IC PSCVT with negative power recirculation
Similarly for the two-regime system with negative power recirculation, the table 9 shows equations for the IC PSCVT system. The terminology used is defined in equations 56-62.
Table 9 Equations for two-regime IC PSCVT system with negative power recirculation
i v
P
P
PSCVTStage 1
Gv
v
Gv [image:30.595.67.538.527.641.2]9.6.2. Efficiency of the Two-regime OC PSCVT with negative power recirculation
For the reverse power flow direction equations 97-101 define the parameters. As was the case in the previous section for reverse power flow, the values ofr,V ,
G
m,G
vand *G are inverted.
4 5
n n
Gv (97)
1 6
n n
Gm (98)
8 4
n n
V (99)
10 7
n n
r (100)
11 3 *
n n
G (101)
[image:31.595.65.538.494.591.2]Table 10 shows equations for the OC PSCVT system.
Table 10 Equations for Two-regime OC PSCVT system with negative power recirculation
i v
P
P
PSCVTStage 1 1
v
GvStage 2 ) 1 2 ( 3 * ) 1 3 ( 2 *
(
1
)
v v GVG
G
R
r
m Gm v v Gv GG
R
V
G
R
G
r
) 1 2 ( 3 * ) 1 3 ( 2*
(
1
)
10. Results of different designs of PSCVT for the FESS
Figure 17 PSCVT ratio vs. variator ratio for single, two-regime and three-regime systems
Further in order to show the results of the power flow and efficiency of the three systems using the derived equations, the efficiency of the individual elements is needed. For the sake of simplicity the efficiencies of the variator and the fixed gears are assumed to be constant and the efficiency of the PGS is taken to be same in all directions, though it can also be derived depending on the direction of power flow (Macmillan26, Pennestri and Freudenstein6). The efficiency of the individual components such as variator can be taken as variable depending on their operating conditions.
Assuming the following efficiency values shown in equations 102-104 and applying the formulae derived previously for the three systems in section 9, the variator power to input power ratio and the overall efficiency for the example stated before are calculated.
98 . 0 :
) (np m
(102)9
.
0
:
v
(103)99
.
0
:
FG
(104)three-regime system, of course has this ratio less than unity and the difference between forward and reverse directions is insignificant. For the third system the negative ratio of variator power to input power can be seen for the second stage.
Consequently the effect of the ratio of variator power to input power can be seen on the system efficiency in the graph (B). The three-regime system has the highest efficiency of the three systems except towards higher speed ratios, where the regime system shows higher efficiency. The two-regime system has a drop in efficiency towards the start of the second stage, where it even drops below that of the single regime system. At this point the difference in efficiency between the forward and reverse power flow is also pronounced for the two-regime system.
Figure 18 Graph (A) shows the ratio of variator power to input power vs. PSCVT ratio for the three systems in both directions. Graph (B) shows the efficiency vs. PSCVT ratio for the three systems in both directions
[image:33.595.122.486.267.486.2]Figure 19 The PSCVT design methodology
11. Conclusions
speed ratio range and the application of the treatise of Pennestri and Freudenstein6 to derive the equations for ratio of variator to input power and efficiency of the PSCVT in both directions of the power flow including the efficiency of the variator, fixed gears and PGS for power recirculating and multi regime systems. The presented methodology can be applied to design a PSCVT for FESS in order to achieve any required speed ratio range and predict its efficiency in both directions of power flow i.e. for acceleration and brake regeneration. Using this methodology results were derived for three different types of PSCVT for an example of FESS.
Funding
This research received no specific grant from any funding agency in the public, commercial, or not-for-profit sectors.
References
1. Dhand A and Pullen K. Review of Flywheel based Internal Combustion Engine Hybrid Vehicles, International Journal of Automotive Technology 2013; 14(5): 797-804
2. Fuchs R, Tamura T, Mccullough N and Matsumoto K. The Making of the Full Toroidal Variator. JTEKT Engineering Journal English edition 2009; 1006E.
3. Srivastava N and Haque I. A review on belt and chain continuously variable transmissions (CVT): Dynamics and control. Mechanism and Machine Theory 2009; 44(1).
4. Kluger M and Long D. An Overview of Current Automatic, Manual and Continuously Variable Transmission Efficiencies and Their Projected Future Improvements. SAE Technical Paper
1999-01-1259; 1999.
5. White G. Properties of Differential Transmissions. The Engineer 1967; 224: 105–11.
6. Pennestri E and Freudenstein F. The mechanical efficiency of epicyclic gear trains. Journal of
Mechanical Design 1993; 115.
7. Planetary gear set [image on the internet]. 2013 [cited 16.04.2013]. Available from: http://www.dacoglu.com/desotocd/11A_ThreeSpeed%20With%20Overdrive/Plymouth%20 Bulletin%20-%20Overdrive%20Transmission.htm
8. White G. Multiple-Stage, Split-Power Transmissions. Journal of Mechanisms 1970; 5(4): 505- 520.
9. Yu D and Beachley N. On the mechanical efficiency of differential gearing. Journal of
Mechanisms, Transmissions and Automation in Design 1985; 107.
10. Hsieh L and Yan H. On the mechanical efficiency of continuously variable transmissions with planetary gear trains. International Journal of Vehicle Design 1990; 11(2).
11. Yan H and Hsieh L. Maximum mechanical efficiency of infinitely variable transmissions.
Mechanism and Machine Theory 1994; 29(5).
12. Mangialardi L and Mantriota G. Comments on: maximum mechanical efficiency infinitely variable transmissions. Mechanism and Machine Theory 1998; 33(4).
13. Mangialardi L and Mantriota G. Power flows and efficiency in infinitely variable transmissions. Mechanism and Machine Theory 1999; 34(7).
14. Mantriota G. Power split continuously variable transmission systems with high efficiency.
Proceedings of the Institution of Mechanical Engineers, Part D: Journal of Automobile
15. Mantriota G. Theoretical and experimental study of a power split continuously variable transmission system part 1. Proceedings of the Institution of Mechanical Engineers, Part D:
Journal of Automobile Engineering 2001; 215(7).
16. Mantriota G. Theoretical and experimental study of a power split continuously variable transmission system part 2. Proceedings of the Institution of Mechanical Engineers, Part D:
Journal of Automobile Engineering 2001; 215(7).
17. Mantriota G. Performances of a series infinitely variable transmission with type I power flow.
Mechanism and Machine Theory 2002; 37(6).
18. Mantriota G. Performances of a parallel infinitely variable transmissions with a type II power flow. Mechanism and Machine Theory 2002; 37(6).
19. Fussner D and Singh Y. Development of Single Stage Input Coupled Split Power Transmission Arrangements and Their Characteristics. SAE Technical Paper 2002-01-1294; 2002.
20. Beachley N, Anscomb C and Burrows C. et al. Evaluation of split path extended range continuously variable transmissions for automotive applications. Journal of the Franklin
Institute 1984; 317: 235-262.
21. Martinez-Gonzalez P. A study on the integration of a high-speed flywheel as an energy storage device in hybrid vehicles [PhD Thesis]. Imperial College London; 2010.
22. Bottiglione F and Mantriota G. Reversibility of Power-Split Transmissions. Journal of
Mechanical Design 2011; 133(8).
23. Read M. Flywheel Energy Storage Systems for Rail [PhD Thesis]. Imperial College London; 2010.
24. White G. A two-stage variable-speed transmission for extended speed ranges. Machine Tool
Research 1965; 4 (1): 115-120
25. Pennestri E and Valentini P. A review of formulas for the mechanical efficiency analysis of two degrees-of-freedom epicyclic gear trains. Journal of Mechanical Design 2003; 125(3): 602-608.
26. Macmillan R. Power flow and loss in differential mechanisms. Journal of Mechanical
Engineering Science 1961; 3(1).
List of Tables
Table 1: Conditions for different power modes of PSCVT to occur
Table 2: Definitions of basic ratio of the PGS depending on branch connections
Table 3: Values of Gm and Gv to achieve required PSCVT ratio limits in case of positive power
recirculation
Table 4: Values of Gm and Gv to achieve required PSCVT ratio limits in case of negative power
recirculation
Table 5: Values of G14 and G15 to achieve required PSCVT ratio limits in case of three-regime system
Table 6: Values of Gm and G* to achieve required ratio limits for two-regime PSCVT with negative
power recirculation
Table 8: Equations for three-regime OC PSCVT system
Table 9: Equations for two-regime IC PSCVT system with negative power recirculation Table 10: Equations for Two-regime OC PSCVT system with negative power recirculation
List of Figures
Figure 1 Planetary Gear Set7
Figure 2 Schematic of PGS (Arrows signify power. Power into the system is taken positive and out of the system as negative)
Figure 3 Input Coupled and Output Coupled PSCVT systems Figure 4 Different Power Regimes of PSCVT
Figure 5 Graph (A) shows the variation of variator ratio vs. PSCVT ratio. Graph (B) shows the variation of ratio of variator power to input power vs. PSCVT ratio
Figure 6 Different types of Multi Regime PSCVT Systems
Figure 7 Schematic of single regime PSCVT with additional gearing to achieve required operation limits
Figure 8 Ratio of variator power to input power vs. PSCVT ratio for positive and negative power recirculation
Figure 9 Two-Regime PSCVT without power recirculation
Figure 10 Three-Regime PSCVT System without power recirculation Figure 11: Two-regime PSCVT system with power recirculation Figure 12 Power Flow in PGS
Figure 13 Cases of Power Flow in PGS of IC PSCVT and OC PSCVT from fig. 3 Figure 14 Schematic of OC PSCVT without power recirculation
Figure 15 Schematic of IC PSCVT with positive power recirculation Figure 16 Schematic of OC PSCVT with positive power recirculation
Figure 17 PSCVT ratio vs. variator ratio for single, two-regime and three-regime systems
Figure 18 Graph (A) shows the ratio of variator power to input power vs. PSCVT ratio for the three systems in both directions. Graph (B) shows the efficiency vs. PSCVT ratio for the three systems in both directions
Figure 19 The PSCVT design methodology
Notation
AT Automatic transmission
A, B, C Clutches
Ds, Dc, Dr Diameter of sun, carrier and ring gears of PGS
EV Electric vehicle
FESS Flywheel energy storage system
FG Fixed gear
G Gear ratio
HV Hybrid vehicle
IC Input coupled
K Constant of PGS
n Angular speed
ns, nc, nr Angular speed of sun, carrier and ring gears of PGS
η Efficiency
OC Output coupled
P Power
PGS Planetary gear set
PSCVT Power split continuously variable transmission
Pv Power input into variator
Pi Power input into PSCVT
R Basic ratio of PGS
r Speed ratio of PSCVT
rt PSCVT ratio range
rmin, rmax Maximum and minimum value of PSCVT speed ratio
T Torque
V Variator ratio
Vt Variator ratio range