Integrated transcriptomic and proteomic analyses
uncover regulatory roles of Nrf2 in the kidney
Luke M. Shelton
1,8, Adam Lister
2,8, Joanne Walsh
1, Rosalind E. Jenkins
1, Michael H.L. Wong
1,3, Cliff Rowe
1,4,
Emanuele Ricci
5, Lorenzo Ressel
5, Yongxiang Fang
6, Philippe Demougin
7, Vanja Vukojevic
7,
Paul M. O
’
Neill
1,3, Christopher E. Goldring
1, Neil R. Kitteringham
1, B. Kevin Park
1, Alex Odermatt
2and
Ian M. Copple
11MRC Centre for Drug Safety Science, Department of Molecular and Clinical Pharmacology, University of Liverpool, Liverpool, UK; 2Division of Molecular and Systems Toxicology, Department of Pharmaceutical Sciences, University of Basel, Basel, Switzerland; 3Department of Chemistry, School of Physical Sciences, University of Liverpool, Liverpool, UK;4CN Bio Innovations Ltd, Centre for
Innovation & Enterprise, Oxford University Begbroke Science Park, Oxford, UK;5School of Veterinary Science, University of Liverpool, Liverpool, UK;6Centre for Genomic Research, Institute of Integrative Biology, University of Liverpool, Liverpool, UK and7Department Biozentrum, Life Sciences Training Facility, University of Basel, Basel, Switzerland
The transcription factor Nrf2 exerts protective effects in numerous experimental models of acute kidney injury, and is a promising therapeutic target in chronic kidney disease. To provide a detailed insight into the regulatory roles of Nrf2 in the kidney, we performed integrated transcriptomic and proteomic analyses of kidney tissue from wild-type and Nrf2 knockout mice treated with the Nrf2 inducer methyl-2-cyano-3,12-dioxooleano-1,9-dien-28-oate (CDDO-Me, also known as bardoxolone methyl). After 24 h, analyses identified 2561 transcripts and 240 proteins that were differentially expressed in the kidneys of Nrf2 knockout mice, compared with those of wild-type counterparts, and 3122 transcripts and 68 proteins that were differentially expressed in wild-type mice treated with CDDO-Me, compared with those of vehicle control. In the light of their sensitivity to genetic and pharmacological modulation of renal Nrf2 activity, genes/ proteins that regulate xenobiotic disposition, redox balance, the intra/extracellular transport of small molecules, and the supply of NADPH and other cellular fuels were found to be positively regulated by Nrf2 in the kidney. This was verified by qPCR, immunoblotting, pathway analysis, and
immunohistochemistry. In addition, the levels of NADPH and glutathione were found to be significantly decreased in the kidneys of Nrf2 knockout mice. Thus, Nrf2 regulates genes that coordinate homeostatic processes in the kidney, highlighting its potential as a novel therapeutic target.
Kidney Internationaladvance online publication, 30 September 2015; doi:10.1038/ki.2015.286
KEYWORDS: iTRAQ; Keap1; Nrf2; oxidative stress; ROS
Acute kidney injury is a significant clinical problem, with more than 7% of patients developing some form of acute kidney injury following admission to hospital.1Furthermore, as a result of the renal vasculature being exposed to ~ 25% of resting cardiac output,2 and given its role in the urinary excretion of conjugated reactive metabolites, the kidney often encounters relatively high levels of xenobiotics and their metabolites, of which a number are known to suppress renal function. A key mechanism underlying the nephrotoxicity of many xenobiotics (examples include cisplatin,3 ferric nitrilotriacetate,4 and streptozotocin5) is their ability to induce the generation of reactive oxygen species (ROS) and consequent oxidative stress in specific regions of the kidney. The transcription factor Nrf2 is widely regarded as the master regulator of defence against the deleterious effects of oxidative stress in mammalian cells.6 Under normal condi-tions, the level and activity of Nrf2 is restricted via its association with the cytosolic protein Keap1, which targets the transcription factor for ubiquitination and proteasomal degradation.6In the presence of reactive oxygen species and other potentially harmful stimuli, Nrf2 evades Keap1-mediated repression and accumulates in the nucleus, where it binds to antioxidant response elements (AREs) located in the promoter regions of cytoprotective genes, elevating expression of their products which serve to purge the toxic insult and minimize its damaging effects.6As a result, there is considerable interest in targeting Nrf2 for therapeutic benefit, particularly in disease contexts in which reactive oxygen species play an important role.7Indeed, the triterpenoid Nrf2 inducer methyl-2-cyano-3,12-dioxooleano-1,9-dien-28-oate (CDDO-Me) (also known as bardoxolone methyl) had until recently shown promise as a novel therapy for chronic kidney Correspondence: Alex Odermatt, Division of Molecular and Systems
Toxicology, Department of Pharmaceutical Sciences, University of Basel, Basel CH-4056, Switzerland or Ian M. Copple, MRC Centre for Drug Safety Science, Department of Molecular and Clinical Pharmacology, University of Liverpool, Ashton Street, Sherrington Building, Liverpool L69 3GE, UK. E-mail: alex.odermatt@unibas.ch or ian.copple@liv.ac.uk
8
These authors contributed equally to this work.
disease (CKD),8 when a phase III clinical trial was halted due to adverse cardiovascular events that are thought to be associated with an Nrf2-independent perturbation of endothelin signaling.9,10 Recently, two new phase II trials of CDDO-Me (in CKD—NCT02316821 and pulmonary arterial hypertension—NCT02036970) were initiated with stricter exclusion criteria for patients with a history of cardiovascular disease.
We previously provided insights into the molecular mechanisms by which Nrf2 protects against drug-induced liver injury, by defining the constitutive Nrf2-regulated hepatic proteome.11 We demonstrated that the expression of a number of proteins responsible for the detoxification of acetaminophen and other drugs is markedly decreased in the livers of Nrf2−/− mice,11 consistent with the enhanced sensitivity of these animals to the hepatotoxicty provoked by these compounds.12,13 In an extension to this study, we recently defined the biological processes that are sensitive to pharmacological modulation of Nrf2 in the liver by detailing the hepatic protein pool that is augmented in Nrf2+/+ mice, but not in Nrf2−/−counterparts, in response to CDDO-Me.14 This work revealed that CDDO-Me is a highly selective inducer of Nrf2-regulated proteins in the liver, and identified six proteins (cytochrome P450 2A5, glutathione-S -trans-ferases Mu 1 and Mu 3, ectonucleoside-triphosphate diphos-phohydrolase, UDP-glucose-6-dehydrogenase, and epoxide hydrolase) that were both downregulated in Nrf2−/− mice and upregulated by CDDO-Me in Nrf2+/+mice.14
In keeping with the role of Nrf2 as a key regulator of cell defence processes, it is known that Nrf2 protects against a number of nephrotoxic insults in experimental models, as we recently reviewed.15For example, ischemic–reperfusion of the mouse kidney has been shown to stimulate Nrf2 signaling,16 while the associated renal injury is exacerbated in Nrf2−/− mice17and lessened in wild-type mice pretreated with small molecule Nrf2 inducers.18,19 Similar consequences of Nrf2 inhibition and induction have been noted in the context of cisplatin-induced proximal tubular cell damage.3 Despite these and other studies supporting a role for Nrf2 in protection against acute kidney injury,15a global analysis of the biological processes that are regulated by Nrf2 in the kidney in vivo has yet to be performed. To address this knowledge gap, we have performed integrated transcriptomic and proteomic analyses of kidney homogenates from Nrf2+/+ and Nrf2−/− mice, treated or not treated with CDDO-Me. Our findings support a role for Nrf2 in regulating the expression of a battery of genes/proteins that contribute to the maintenance of renal homeostasis.
RESULTS
Genetic and pharmacological modulation of Nrf2 in the kidney
We first confirmed that CDDO-Me is an effective inducer of Nrf2 signaling in renal cells, through immunoblot and qPCR analysis of primary human proximal tubule epithelial cells following exposure to the compound, which provoked the
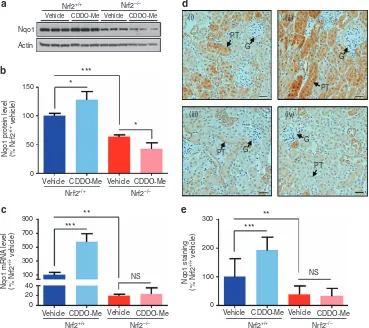
accumulation of Nrf2 and upregulated the expression of the established Nrf2 target NAD(P)H dehydrogenase quinone 1 (Nqo1) at both protein and mRNA levels (Supplementary Figure S1 online). Nqo1 was also found to be expressed at a lower level following siRNA depletion of Nrf2, and at a higher level following transfection with Keap1 siRNA (Supple-mentary Figure S1 online), confirming that it is a robust marker of Nrf2 activity in renal cells. In the light of these findings, we verified that the Nrf2 pathway could be pharmacologically modulated in the kidneys of Nrf2+/+mice and was non-functional in Nrf2−/−mice, before conducting transcriptomic and proteomic analyses, by determining the expression level of Nqo1 in kidney homogenates from both genotypes, 24 h after dosing with vehicle or CDDO-Me.20 The level of Nqo1 protein (Figure 1a and b) and mRNA (Figure 1c) was significantly lower in the kidneys of vehicle-exposed Nrf2−/− mice, compared with those of Nrf2+/+ counterparts, consistent with loss of Nrf2 function. Moreover, while the Nrf2 inducer CDDO-Me provoked the induction of Nqo1 24 h after administration to Nrf2+/+mice, this effect was abrogated in Nrf2−/− mice (Figure 1a–c). Consistent with these findings, and the established role of Nrf2 in the protection of mice against pathological insults that target the cortical tubules,15 there was a significant decrease in Nqo1 immunohistochemical staining in the renal cortex, and particularly within the proximal tubules, of Nrf2−/− mice, compared with those of Nrf2+/+ counterparts (Figure 1d and e). Furthermore, a significant increase in Nqo1 staining was observed in these structures in Nrf2+/+, but not in Nrf2−/−, mice in response to CDDO-Me (Figure 1d and e). Taken together, these data validate our model of genetic and pharmacological modulation of renal Nrf2 activity, and provide a platform for a global analysis of the regulatory roles of Nrf2 in the kidney.
Definition of the Nrf2-regulated renal transcriptome
CDDO-Me, demonstrated that the‘NRF2-mediated Oxidative-stress Response’was the most significantly altered pathway in both cases (Supplementary Table S4 online), supporting the genetic and pharmacological modulation of Nrf2 in our mouse model. Nine other pathways, including‘xenobiotic metabolism signaling’, ‘aryl hydrocarbon receptor signaling’, ‘PXR/RXR activation’, and ‘glutathione-mediated detoxification’, were commonly affected by both genetic inhibition and pharmaco-logical induction of Nrf2 (Supplementary Table S4 online), highlighting the role of Nrf2 in regulating homeostatic signaling processes in the mouse kidney. Only two pathways were significantly upregulated in the kidneys of Nrf2−/−mice,‘VDR/ RXR activation’ and ‘β-adrenergic signaling’ (Supplementary Table S4 online), while none were significantly downregulated in the kidneys of Nrf2+/+mice treated with CDDO-Me.
The 64 probes that were significantly downregulated (adj. P⩽0.05) in the kidneys of Nrf2−/− mice represented 56 unique coding genes, while the 65 probes that were significantly upregulated (adj. P⩽0.05) in the kidneys of Nrf2+/+mice treated with CDDO-Me represented 57 unique
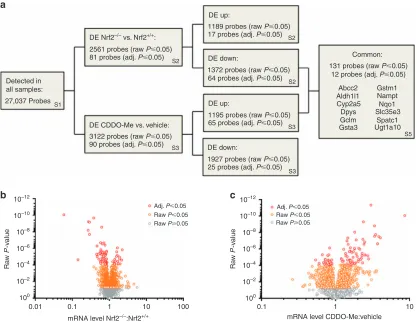
coding genes. We confirmed the altered expression level of selected coding genes in the kidneys of Nrf2−/− mice and CDDO-Me-treated Nrf2+/+mice by qPCR (Figure 3). Given that seven genes encoding for transporters were found to be differentially expressed (adj. P⩽0.05) in the kidneys of Nrf2−/− mice and/or CDDO-Me-treated Nrf2+/+ mice, we included solute carrier family 38 member 3 (Slc38a3) and Slc22a12 in this targeted analysis, which confirmed their lower expression in the kidneys of Nrf2−/−mice (Figure 3a). Cross-referencing of the microarray data sets revealed that no probes were both upregulated in Nrf2−/− mice and down-regulated in CDDO-Me -treated Nrf2+/+ mice, while 12 unique coding genes were found to be both downregulated in Nrf2−/−mice and upregulated in CDDO-Me-treated Nrf2+/+ mice (Figure 2a, Table 1 and Supplementary Table S5 online). The differential expression of a subset of these 12 coding genes was verified by qPCR (Figure 4), which showed good agreement with the microarray data. It is plausible that alterations of Nrf2 signaling in other tissues could indirectly affect the expression of the above genes in the kidneys of Nqo1
Actin
Nrf2+/+ Nrf2–/–
Nrf2+/+
Nrf2+/+
Nrf2–/–
Nrf2–/– Vehicle CDDO-Me Vehicle CDDO-Me
Vehicle CDDO-Me Vehicle CDDO-Me
Vehicle CDDO-Me Vehicle CDDO-Me
Nrf2+/+ Nrf2–/–
Vehicle CDDO-Me Vehicle CDDO-Me 150
100
50
0
Nqo1 protein le
v
e
l
(% Nrf2
+/+
v
ehicle)
Nqo1 mRNA le
v
e
l
(% Nrf2
+/+
v
ehicle)
Nqo1 staining
(% Nrf2
+/+
v
ehicle)
900
700
500
300
300
200
100 100
40 20
0 0
NS NS
***
*** ***
** **
*
*
PT
PT
PT
PT G
G
G
G
(i) (ii)
(iii) (iv)
a d
b
[image:3.594.113.482.67.395.2]c e
600 500 400 300 200 100 10 5 0 NS NS ** Slc38a3 100 50 0 150 200 NS NS ** Slc22a12 100 50 0 150 NS NS ** Serpina1d mRNA level (% Nrf2 +/+ + Vehicle) mRNA level (% Nrf2 +/+ + Vehicle) 100 50 0 150 200 NS NS ** Entpd5
Nrf2+/+ Vehicle
Nrf2–/– Vehicle Nrf2–/– CDDO-Me Nrf2+/+ CDDO-Me
[image:4.594.90.507.67.389.2]600 800 1000 400 200 NS NS *** 0 Pir NS NS 600 800 1000 400 200 0 * Srxn1 NS NS *** 600 800 400 200 0 Cbr1 100 NS NS *** 400 300 200 0 Ephx1 a b
Figure 3
|
Genes sensitive to genetic inhibition or pharmacological induction of Nrf2 in the mouse kidney.qPCR validation of genes that were shown to be (a) significantly downregulated in the kidneys of Nrf2−/−mice or (b) significantly upregulated in the kidneys of Nrf2+/+ mice treated with CDDO-Me. Gene expression levels are normalized to those of Ppia. Data represent mean+s.d. ofn= 5 animals per group. Statistical analysis of qPCR data was performed with an unpairedt-test or Mann–Whitney test; *P⩽0.05; **P⩽0.01; ***P⩽0.001;NS, nonsignificant. CDDO-Me, methyl-2-cyano-3,12-dioxooleano-1,9-dien-28-oate; qPCR, quantitative polymerase chain reaction. Detected in
all samples:
27,037 Probes S1
S2 S2 S2 S3 S3 S5 S3
DE Nrf2–/– vs. Nrf2+/+:
2561 probes (raw P艋0.05)
1189 probes (raw P艋0.05)
131 probes (raw P艋0.05)
1195 probes (raw P艋0.05) 1372 probes (raw P艋0.05)
3122 probes (raw P艋0.05) 81 probes (adj. P艋0.05)
17 probes (adj. P艋0.05)
12 probes (adj. P艋0.05) 64 probes (adj. P艋0.05)
65 probes (adj. P艋0.05)
1927 probes (raw P艋0.05)
Raw P艋0.05 Raw P艌0.05
25 probes (adj. P艋0.05)
Adj. P艋0.05
Raw P艋0.05 Raw P艌0.05 Adj. P艋0.05 90 probes (adj. P艋0.05)
DE CDDO-Me vs. vehicle:
DE up: DE up: DE down: DE down: Common: Abcc2 Aldh1l1 Cyp2a5 Dpys Gclm Gsta3 Gstm1 Nampt Nqo1 Slc35e3 Spatc1 Ugt1a10 Ra w P -v alue Ra w P -v alue 10–12 10–10 10–8 10–6 10–4 10–2 100 10–12 10–10 10–8 10–6 10–4 10–2 100
0.01 0.1 1 10 100 0.1 1 10
mRNA level Nrf2–/–:Nrf2+/+ mRNA level CDDO-Me:vehicle
a
[image:4.594.56.544.502.681.2]b c
Nrf2−/−mice or CDDO-Me-treated Nrf2+/+mice. However, bioinformatic analysis identified ARE-like sequences in many of the genes that were differentially expressed following genetic and/or pharmacological modulation of renal Nrf2 activity (Supplementary Table S6 online), includ-ing those which have been shown previously, through integrated ChIP-Seq and qPCR analyses, to be bound by Nrf2 and/or differentially expressed in Nrf2−/− and Keap1−/− mouse embryonic fibroblasts (Supplementary Table S7 online).21 Together, these findings indicate a role for Nrf2 as a transcriptional regulator of the above genes in the kidney.
Definition of the Nrf2-regulated renal proteome
[image:5.594.42.553.77.249.2]To complement our transcriptomic analysis of the kidneys of Nrf2+/+and Nrf2−/−mice treated with vehicle or CDDO-Me, we performed isobaric tags for relative and absolute quantification (iTRAQ)-based proteomic analyses on the same tissues (Figure 5a). Of the 2557 proteins quantified in at least four samples from each group at a false discovery rate of 1% (Supplementary Table S8 online), 240 were differentially expressed (P⩽0.05) in the kidneys of Nrf2−/− mice, com-pared with those of Nrf2+/+counterparts (Figure 5b, Supple-mentary Table S9 online). Three of the most substantially downregulated proteins in the kidneys of Nrf2−/− mice, Table 1
|
Genes/proteins sensitive to genetic inhibition and pharmacological induction of Nrf2 in the mouse kidneyMicroarray iTRAQ
Nrf2−/− vs. Nrf2+/+ CDDO-Me vs. Vehicle
Nrf2−/− vs. Nrf2+/+
CDDO-Me vs. Vehicle Gene symbol David ID RefSeq Ratio Adj.P-value Ratio Adj.P-value Accession Ratio P-value Ratio P-value
Abcc2 451709 NM_013806 0.77 9.43−03 1.46 2.79−04 Q8VI47 0.79 6.66−03 1.22 4.76−03
Aldh1l1 430403 NM_027406 0.72 8.21−03 1.38 9.42−03 Q8R0Y6 0.33 5.14−10 1.08 2.12−01
Cyp2a5 420632 NM_007812 0.27 6.17−05 2.04 2.01−02 P20852 ND ND ND ND
Dpys 425658 NM_001164466 0.29 8.53−06 1.67 4.28−02 Q9EQF5 0.66 3.78−02 1.04 7.75−01
Gclm 425831 NM_008129 0.76 1.40−03 1.28 2.96−03 O09172 0.81 2.06−02 1.05 5.59−01
Gsta3 423583 NM_001077353 0.27 8.20−06 2.13 2.89−03 P30115 0.16 8.62−08 0.90 3.42−01
Gstm1 443311 NM_010358 0.38 3.81−06 1.90 4.37−04 P10649 0.09 1.14−10 1.16 5.82−02
Nampt 465583 NM_021524 0.70 1.08−02 1.44 1.07−02 Q99KQ4 0.61 8.19−03 1.22 1.14−01
Nqo1 481143 NM_008706 0.29 1.45−04 3.47 1.39−04 Q64669 0.28 1.66−07 1.36 1.02−03
Slc35e3 443078 NM_029875 0.84 3.44−02 1.22 1.96−02 Q6PGC7 ND ND ND ND
Spatc1 429270 NM_028852 0.63 1.68−02 1.80 2.38−03 Q148B6 ND ND ND ND
Ugt1a10 446962 NM_201641 0.58 9.04−04 1.45 2.12−02 Q6ZQM8 0.25 6.18−05 1.09 5.50−01
Abbreviations: Adj., adjusted; CDDO-Me, methyl-2-cyano-3,12-dioxooleano-1,9-dien-28-oate; DMSO, dimethyl sulfoxide; iTRAQ, isobaric tags for relative and absolute quantification.
Microarray and iTRAQ analyses were performed on kidney tissue from Nrf2+/+
or Nrf2−/−mice treated with vehicle (DMSO) or CDDO-Me for 24 h. The 12 genes shown
above were found to be both significantly downregulated in the kidneys of Nrf2−/−mice and significantly upregulated in the kidneys of Nrf2+/+
mice treated with CDDO-Me. From the iTRAQ analysis, nine of the genes were also shown to be significantly downregulated at the protein level in the kidneys of Nrf2−/−mice. The remaining three
genes were not detected (ND) at the protein level by iTRAQ. These nine genes/proteins are therefore considered to be most sensitive to genetic inhibition and pharmacological induction of Nrf2 in the mouse kidney.
mRNA level
(% Nrf2
+/+
+ Vehicle)
mRNA level
(% Nrf2
+/+
+ Vehicle)
500 400 300 200 100 30 15 0
NS ***
***
Gstm1
400
300
200
100
30 15 0
NS **
**
Gsta3
400
300 200
100
10 5 0
NS *
*
Cyp2a5
400
300
200
100
30 15 0
NS *
*** Nrf2+/+ Vehicle
Nrf2–/– Vehicle Nrf2–/– CDDO-Me Nrf2+/+ CDDO-Me
Dpys
400
300
200
100
0
NS **
*
Abcc2
200
150
100
50
0 250
NS **
**
Gclm
200
150
100
50
0 250
NS **
***
Nampt
200
150
100
50
0 250
NS **
*
Cat
[image:5.594.50.546.344.513.2]glutathione-S-transferase Mu 1 (Gstm1; 11.5-fold lower in Nrf2−/−vs. Nrf2+/+mice), catalase (Cat; 4.3-fold lower), and ectonucleoside-triphosphate diphosphohydrolase (Entpd5; 2.8-fold lower), were also shown by immunoblotting of tissue homogenates to be expressed at a lower level in the absence of Nrf2 (Figure 6), demonstrating the robustness of our proteomic analysis. We also confirmed that the dimethyl sulfoxide vehicle had little effect on the expression levels of Nrf2-regulated proteins by performing an independent iTRAQ analysis of kidney homogenates from untreated Nrf2+/+and Nrf2−/−mice (Supplementary Figure S2 online), which showed excellent agreement with the primary data set.
Compared with its effects on gene expression, the acute effects of a single 24-h exposure to CDDO-Me were less evident at the protein level, with 68 proteins found to be differentially expressed (P⩽0.05) in the kidneys of Nrf2+/+ mice treated with CDDO-Me, compared with those of vehicle control (Figure 5c, Supplementary Table S10 online). Indeed, only ATP-binding cassette subfamily C member 2 (Abcc2), Entpd5, and Nqo1 were both significantly downregulated in the kidneys of Nrf2−/−mice and significantly upregulated in
the kidneys of Nrf2+/+ mice treated with CDDO-Me
Detected in all samples:
2557 proteins
3 proteins
S8
S9
S9
S9
S10
S11
S10 S10
DE Nrf2–/– vs. Nrf2+/+:
240 proteins (raw P艋0.05)
105 proteins (raw P艋0.05)
135 proteins (raw P艋0.05)
35 proteins (raw P艋0.05)
33 proteins (raw P艋0.05) 68 proteins (raw P艋0.05)
DE CDDO-Me vs. vehicle:
DE up:
DE up: DE down:
DE down:
Common:
Abcc2 Entpd5
Nqo1
Raw P艋0.05 Raw P艌0.05
Raw P艋0.05 Raw P艌0.05
Raw
P
-value
Raw
P
-value
10–10
10–8 10–6
10–4
10–2
10–2
10–1
10–3
100 100
Protein level Nrf2–/–:Nrf2+/+ Protein level CDDO-Me:Vehicle
0.01 0.1 1 10 100 0.01 0.1 1 10 100
a
[image:6.594.107.489.62.373.2]b c
Figure 5
|
Definition of the Nrf2-regulated renal proteome.iTRAQ analysis was performed on kidney tissue from Nrf2+/+or Nrf2−/−mice treated with vehicle (DMSO) or CDDO-Me for 24 h. (a) Overview of iTRAQ findings. DE, differentially expressed. The relevant supplementary tables are indicated in the boxes. (bandc) Volcano plots depicting differentially expressed proteins in the kidneys of (b) Nrf2−/−mice, compared with those of Nrf2+/+counterparts, and (c) Nrf2+/+mice treated with CDDO-Me, compared with those of vehicle. Each point represents a single protein, with those shaded red found to be significantly different (rawP-value) between groups. CDDO-Me, methyl-2-cyano-3,12-dioxooleano-1,9-dien-28-oate; DMSO, DMSO, dimethyl sulfoxide; iTRAQ, isobaric tags for relative and absolute quantification.150
100
50
0 Gstm1
Gstm1 Cat
Cat Entpd5
Entpd5 Actin
Nrf2+/+
Nrf2+/+ Nrf2–/–
Nrf2–/–
Protein level (% Nrf2
+/+
)
***
**
**
[image:6.594.321.536.466.662.2](Supplementary Table S11 online). While the relatively short timeframe used for this experiment (24 h) may not have been sufficient to provoke significant changes in the wider battery of Nrf2-regulated proteins, a targeted analysis revealed minimal additional changes in the expres-sion of Nqo1, Gstm1, Cat, and Entpd5 (which were sensitive to genetic inhibition of Nrf2 in the mouse kidney; Supplementary Table S8 online) at earlier or later time points, or at different doses of CDDO-Me (Supplementary Figure S3 online).
IPA interrogation of the proteins that were significantly downregulated in the kidneys of Nrf2−/− mice, or signifi-cantly upregulated in the kidneys of Nrf2+/+mice treated with CDDO-Me, again demonstrated that the ‘NRF2-mediated Oxidative Stress Response’was one of the most significantly represented pathways in both cases (Supplementary Table S12 online). Examination of the proteomic data also revealed that modulation of renal Nrf2 activity was associated with significant alterations in the expression level of proteins known to regulate core metabolic processes, including the pentose phosphate pathway (glucose-6-phosphate 1-dehydrogenase X, G6pdx; 6-phosphogluconate dehydrogen-ase decarboxylating, Pgd; transketoldehydrogen-ase, Tkt), the synthesis and recycling of amino acids (cysteine sulfinic acid decarbox-ylase, Csad; cystathionine gamma-lyase, Cth; threonine
synthase-like 2, Thnsl2), and the metabolism of lipids/fatty acids (acetyl-coenzyme A acetyltransferase 1, Acat1; peroxi-somal acyl-coenzyme A oxidase 3, Acox3; peroxiperoxi-somal multifunctional enzyme type 2, Hsd17b4). These findings further indicate that Nrf2 regulates the expression of genes/ proteins that coordinate renal homeostatic processes.
Comparison of transcriptomic and proteomic data
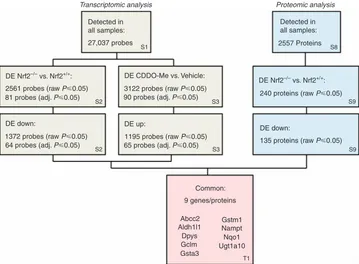
There was a good level of agreement between our transcrip-tomic and proteomic data sets (Figure 7). Indeed, IPA examination of the data from Nrf2−/− mice identified 12 pathways that were commonly altered at both gene and protein expression levels (Supplementary Tables S4 and S12 online). In keeping with this, of the 12 coding genes that were both significantly downregulated (adj.P⩽0.05) in the kidneys of Nrf2−/− mice and upregulated in the kidneys of Nrf2+/+ mice treated with CDDO-Me according to our microarray analysis, 9 were also found in our proteomic analysis to be significantly (P⩽0.05) downregulated at the protein level in the kidneys of Nrf2−/− mice, while the remaining three proteins were not detected (Table 1). These data highlight this panel of genes/proteins as sensitive markers of Nrf2 activity in the mouse kidney. Most likely due to their low abundance in whole-tissue homogenates, only 23 of the 72 transporters that were detected in our microarray analysis of the mouse
Detected in all samples:
27,037 probes
Detected in all samples:
2557 Proteins S1
S2
S2 DE Nrf2–/– vs. Nrf2+/+:
DE Nrf2–/– vs. Nrf2+/+:
2561 probes (raw P艋0.05)
240 proteins (raw P艋0.05)
135 proteins (raw P艋0.05) 81 probes (adj. P艋0.05)
S3
S8
S9
S9
T1 S3 3122 probes (raw P艋0.05) 90 probes (adj. P艋0.05) DE CDDO-Me vs. Vehicle:
1372 probes (raw P艋0.05) 64 probes (adj. P艋0.05) DE down:
DE down: 1195 probes (raw P艋0.05)
65 probes (adj. P艋0.05) DE up:
Common:
Abcc2 Aldh1l1 Dpys Gclm Gsta3
Gstm1 Nampt Nqo1 Ugt1a10 9 genes/proteins
[image:7.594.118.477.387.651.2]Transcriptomic analysis Proteomic analysis
Figure 7
|
Correlation of transcriptomic and proteomic analyses of Nrf2 activity in the mouse kidney.Microarray and iTRAQ analyses were performed on kidney tissue from Nrf2+/+or Nrf2−/−mice treated with vehicle (DMSO) or CDDO-Me for 24 h. DE, differentially expressed. Thekidney were also present in the iTRAQ data set (Supple-mentary Table S13 online). Of the seven transporters that were differentially expressed (adj.P⩽0.05) at the mRNA level in the kidneys of Nrf2−/− mice and/or CDDO-Me -treated Nrf2+/+mice, three were detected in our iTRAQ analysis, with two of these (Abcc2 and Slc22a12) found to have significantly altered expression in response to genetic and/or pharmaco-logical modulation of Nrf2 activity (Supplementary Table S13 online).
Nrf2 regulates the provision of NADPH and glutathione in the kidney
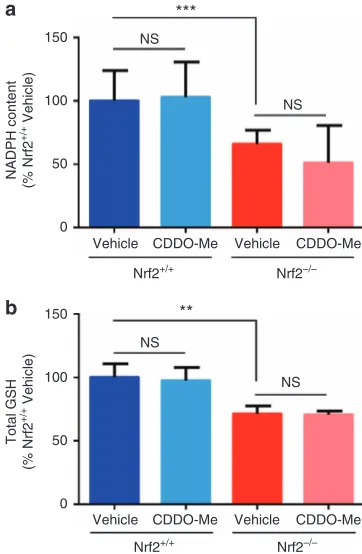
The transcriptomic and proteomic data sets demonstrated that genes/proteins that are known to regulate the synthesis and metabolism of NADPH and glutathione were down-regulated in the kidneys of Nrf2−/− mice. Consistent with these observations, the levels of NADPH (Figure 8a) and glutathione (Figure 8b) were found to be significantly lower in the kidneys of vehicle-treated Nrf2−/−mice, compared with those of Nrf2+/+ counterparts. The levels of NADPH and glutathione were not altered by CDDO-Me in Nrf2+/+ or
Nrf2−/−mice (Figure 8a and b), in keeping with the minimal effects of CDDO-Me at the protein level at 24 h. Taken together, these data confirm that Nrf2 contributes to the provision of NADPH and glutathione, which serve as important cofactors in a number of homeostatic processes, in the kidney.
DISCUSSION
Delineating the biological processes that are regulated by Nrf2 in the kidney is critical to understand the mechanisms by which Nrf2 protects against nephrotoxic insults,22 and to rationalize the pharmacodynamic effects associated with therapeutic Nrf2 inducers in the kidney.23 Previous work has demonstrated the role of Nrf2 in regulating the expression of selected cytoprotective genes in the kidney in vivoand in renal cells culturedin vitro.17,24However, prior to this study, a global analysis of the biological processes that are regulated by Nrf2 in the kidneyin vivohad not been performed. Using an integrated transcriptomic and proteomic approach, we have demonstrated that the kidneys of Nrf2−/− mice are deficient in the expression of genes/proteins that coordinate the synthesis and conjugation of glutathione, maintain cellular redox balance, control the metabolism and disposi-tion of a wide range of xenobiotics, and regulate the supply of NADPH and other cellular fuels (Figure 9). Consistent with these observations, we have also shown that Nrf2 influences the provision of NADPH and glutathione in the kidney in vivo. These findings demonstrate the role of Nrf2 in regulating the expression of genes/proteins that contribute to the maintenance of renal homeostasis.
As we recently reviewed, genetic and pharmacological modulation of Nrf2 activity has been shown to alter the threshold for sensitivity to a number of experimental nephro-toxins.15 For example, cisplatin-induced renal injury is exacerbated in Nrf2−/− mice and ameliorated in Nrf2+/+ (but not Nrf2−/−) mice by pretreatment with CDDO-Im, a structural analog of CDDO-Me.3 The primary structural targets of cisplatin-induced kidney injury are the cortical tubules, and especially proximal tubule epithelial cells.25Our IHC data demonstrate that Nrf2 activity is relatively high in the cortical tubules, in keeping with a report in healthy cynomolgus monkeys in which 28-day administration of CDDO-Me was shown to upregulate Nqo1 expression predominantly in these structures.26 Notably, Keap1 is also reported to be expressed at a much higher level in the human renal cortex than in the medulla.27These findings are consis-tent with the ability of Nrf2 and Nqo1 to directly protect against cisplatin nephrotoxicity in mice.3,28,29 Although further work is needed to define the contribution of other proteins and processes to the nephro-protective effects of Nrf2 in vivo, it is likely that the decreased expression of the gene battery reported here, and resulting lowered capacity to adapt to changes in local redox conditions via the provision of NADPH and glutathione, at least partly contributes to the enhanced sensitivity to renal insult associated with down-regulation of Nrf2 signaling.
150
100
50
0
150
100
50
0
NADPH content
(% Nrf2
+/+
Vehicle)
Total GSH
(% Nrf2
+/+
Vehicle)
***
** NS
NS
NS
NS Vehicle CDDO-Me Vehicle CDDO-Me
Vehicle CDDO-Me Vehicle CDDO-Me
Nrf2+/+ Nrf2–/–
Nrf2+/+ Nrf2–/–
a
[image:8.594.75.256.346.623.2]b
One-third of the proteins that we recently showed to be sensitive to genetic inhibition or pharmacological induction of Nrf2 in the mouse liver14were found here to be similarly regulated by Nrf2 in the kidney, demonstrating that there is a degree of overlap in the regulatory roles of Nrf2 across different tissues. Indeed, consistent with our findings in the kidney, a recent report demonstrated that Nrf2 influences the provision of NADPH in the liver.30However, several proteins found here to be sensitive to modulation of Nrf2 activity in the kidney were previously shown to be unaltered in the liver,
and vice versa, under the same experimental conditions.14We also noted that some Nrf2-regulated genes were down-regulated to a greater degree in the kidney, compared with the liver, of Nrf2−/− mice, and vice versa. For example, Gstm1 protein levels were found to be 11.4- and 4.1-fold lower in the kidneys and livers, respectively, of Nrf2−/− mice compared with those of wild-type counterparts.14 Given that our IHC data indicate that Nrf2 activity is relatively high in the cortical tubules of the kidney, and that our transcriptomic and proteomic analyses have been conducted on whole-tissue Por
Cyb5a Cyp7b1 Cyp2a5 NADPH
NADP+
NADP+
NADP+
e– e– Xenobiotic
Oxidized xenobiotic UDP-glucose+
Glutamate Cysteine
Glycine
Glutamate Cysteine
Glycine
Gclc
Gss
Gst
Gclc
Gss
Glutathione Ugdh
UDP-glucuronate
Ugt1a7c
Xenobiotic-glucoronide conjugate Xenobiotic-glutathione conjugate
Nqo1
Quinone Hydroquinone
Cbr1/3
Aldehyde/ketone Alcohol
Xenobiotic Xenobiotic ATP
ADP
Abcc1–4
Gpx4
2H2O2
2H2O2 H2O2
2H2O
2H2O
O2+ 2H2O
Prdx-SH Prdx-SOH
Srxn1-SOH Srxn1-SH
Txn-SOH Txn-SH
Txnrd1-SH Txnrd1-SOH
NADPH
Cat Glutathione
Oxidized glutathione
G6pd Pgd
Glucose 6-phosphogluconate Ribulose 5-phosphate NADPH
Purine synthesis
Nampt
Nicotinamide Nicotinamide mononucleotide
NAD
Tkt Glycolytic
pathway
Entpd5
UDP UMP ATP NADH
ATP
Pyruvate
TCA cycle
Malate Me1 Cul3
Cul3 Nrf2
Nrf2 Nrf2
Keap1 Keap1
Keap1 Keap1
Proteasomal degradation
Maf
Adaptive response to stress
Absence of overt stress a
b
[image:9.594.55.534.66.555.2]c
homogenates, it will be important to define the biological actions of Nrf2 in specific regions and cell types within the kidney, in order to better understand its roles in renal physiology and disease.
CKD in patients is characterized by a progressive decline in renal function, reduced metabolic capacity, and an increased burden of oxidative stress.36,37Notably, several animal studies have provided evidence for a downregulation of the Nrf2 pathway during the pathogenesis of CKD.22 Indeed, Vaziri and colleagues have observed a higher burden of oxidative stress and a lower level of expression of Nrf2 and its target genes, linked to an increase in the level of Keap1, in rat models of spontaneous focal glomerulosclerosis,38surgical nephrectomy,39and tubulo-interstitial nephropathy.40
The data reported here show that the Slc38a3 gene, which codes for the sodium-coupled neutral amino acid transporter 3 (Snat3), is expressed at a dramatically lower level in the kidneys of Nrf2−/− mice. Under physiological conditions, renal Snat3 protein expression is low (consistent with the absence of Slc38a3/Snat3 in our iTRAQ data sets) but is dramatically increased as part of the adaptive response to metabolic acidosis.34,35 The dysregulation of Snat3 could render Nrf2−/−mice unable to adapt efficiently to metabolic acidosis, which is associated with multiple forms of kidney disease and causes neurological or cardiovascular complica-tions in patients. We are currently testing this hypothesis.
CDDO-Me and its analogs have previously been shown to induce Nrf2 signaling and protect against experimental renal disease in animal models.3,19,31,32Here, CDDO-Me augmen-ted the expression of numerous cytoprotective genes in the mouse kidney, although the pharmacodynamic impact of a single acute exposure to the compound was less pronounced at the protein level, even up to 72 h post administration (Supplementary Figure S3 online). Consistent with this, the ability of CDDO-Me and its analogs to protect against experimental acute kidney injury provoked by ferric nitrilotriacetate,31cisplatin,3aristolochic acid,32and ischemia reperfusion19has only been demonstrated following repeated daily dosing of the triterpenoids, implying that chronic stimulation is necessary to provoke meaningful changes in the expression of Nrf2-regulated proteins in the kidney. As a result, further work is needed to define the effects of repeated administration of CDDO-Me on the renal Nrf2-regulated gene battery. In addition, Yateset al.33have provided evidence for the differential induction of Nqo1 mRNA in various tissues of mice following a single 6 h exposure to CDDO-Me or its structural analogs. Such a phenomenon could be influenced by drug disposition, and it will therefore be important to determine whether intraperitoneal injection (as used here) and oral administration (as used clinically) of CDDO-Me and other small molecule inducers provoke different magnitudes of Nrf2 pathway response in the kidney, and indeed other organs.
CDDO-Me improves estimated glomerular filtration rate in both cancer and early-stage CKD patients,8while structural analogues enhance estimated glomerular filtration rate41and
renal function42in rats. Recent work has shown that selected Nrf2 target genes are upregulated in the glomeruli of Keap1 hypomorphic knockdown mice.43However, the direct role of Nrf2 in the improved estimated glomerular filtration rate observed in patients and animals receiving CDDO-Me or related triterpenoids is currently unclear. Our microarray data reveal that none of the transcripts that are significantly altered by CDDO-Me in Nrf2+/+ mice are similarly altered in Nrf2−/− KO mice (see Supplementary Table S3 online), demonstrating the relative specificity of the compound as an acute inducer of Nrf2 in the kidney. However, it is possible that during chronic exposure CDDO-Me alters other renal signaling pathways, or has indirect effects on kidney function through stimulation of Nrf2 activity in other organs, such as the liver. Therefore, further work is needed to understand the pharmacological mechanisms that underlie the beneficial effect of CDDO-Me on estimated glomerular filtration rate, in order to support the development of potent, specific, and safe Nrf2 inducers that may represent promising candidates for the treatment of CKD, for which new drugs are urgently required.
MATERIALS AND METHODS Animals and dosing
Non-fasted male Nrf2+/+and Nrf2−/−mice (C57BL/6 background, generation, and genotyping described previously44,45) of 10–12 weeks of age were utilized throughout the study, which was conducted according to the Animals (Scientific Procedures) Act 1986 and University of Liverpool local guidelines. Mice were housed at 19–23 °C on a 12 h light/dark cycle, and given free access to food and water. Mice were administered a single intraperitoneal dose of vehicle (dimethyl sulfoxide, 100μl/mouse) or CDDO-Me (3 mg/kg), and killed 24 h later by exposure to a rising concentration of CO2followed by cardiac puncture. The renal capsule and fat were removed from excised kidneys, which were then snap frozen, along with other organs, and stored at−80 °C.
Microarray analysis and bioinformatics
according to the robust microarray analysis method46and data were log2-transformed. To select differentially expressed genes, a two-way analysis of variance model, using method of moments,47was applied. The false discovery rate adjustedP-values were computed from raw P-values as described by Benjamini and Hochberg.48Probes with transcript IDs but no associated gene assignment, gene symbol, or RefSeq were excluded from bioinformatic analysis of the microarray data. To identify coding genes, probes that represented predicted genes, pseudogenes, uncharacterized cDNAs, Riken cDNAs, and those without an identifier were excluded. Cross-referencing to the iTRAQ data set was facilitated by assignment of a DAVID identifier (http://david.abcc.ncifcrf.gov/conversion.jsp) to relevant coding genes.
iTRAQ analysis
Individual whole kidneys (n=6 per group) were homogenized in 0.5 mol/l triethylammonium bicarbonate/0.1% sodium dodecyl sulfate and subjected to a 1-h freeze–thaw cycle, followed by 3 × 10 s bursts of sonication (3μm amplitude). Samples were centrifuged (12,000g, 10 min, 4 °C) and supernatants were retained for iTRAQ and immunoblot analysis. iTRAQ labeling, mass spectrometry, and data analysis were performed as described.14Reported proteins were detected in at least four of six animals per treatment group. Differential expression (P⩽0.05) was determined using the limma package within the R programming environment,49 enabling simultaneous comparisons between multiple treatments using design and contrast matrices via a linear regression model. Cross-referencing to the microarray data set was facilitated by assignment of a DAVID identifier to relevant proteins.
IPA and identification of ARE-like sequences
IPA (www.ingenuity.com) of the microarray and iTRAQ data sets was performed to reveal biological pathways that were perturbed under the various conditions. Pathways represented by a single gene/ protein were excluded for robustness. Regulatory Sequence Analysis Tools (RSAT) software (http://www.rsat.eu/)50was used to identify ARE sequences in the 5′-flanking regions upstream of putative Nrf2-regulated genes. 5′-Flanking sequences (5000 bp upstream of the start codon) were retrieved directly from the ENSEMBL database from within the RSAT package. Promoter sequences were then interrogated for ARE or ARE-like sequences using a string-based analysis with the subprogram ‘dna search’ available within RSAT. The search terms used were TMAnnRTGABnnnGCR and TGABnnnGC (where M=A/C, R=A/G, B=G/C/T, and N=any nucleotide). Consensus ARE sequences were taken from Hayes et al.51
qPCR analysis
For relative quantification of selected genes, cDNA generated for microarray analysis of kidney tissue (n=5 per group) was analyzed, using KAPA SYBR FAST qPCR reagent (Kapa Biosystems, Wilmington, MA) on a Rotor-Gene 3000A qPCR machine (Corbett Research, Cambridge, UK), and normalized toPpia. Gene-specific primers are detailed in Supplementary Table S14 online.
Immunoblotting
Tissue homogenates (20μg protein, n=6 per group) were separated by sodium dodecyl sulfate polyacrylamide gel electrophoresis as previously described.11The Nqo1 (ab2346), Gstm (ab53942), Entpd5 (ab92542), Cat (ab16731), and β-actin (ab6276) antibodies were
from Abcam (Cambridge, UK). Immunoreactive band volumes were quantified using TotalLab 100 software (Nonlinear Dynamics, Newcastle upon Tyne, UK) and normalized to β-actin, which was probed as a loading control.
Quantification of NADPH and glutathione
Whole-kidney tissue from Nrf2+/+ or Nrf2−/− mice dosed with dimethyl sulfoxide or CDDO-Me (n=6 per group) was homo-genized, and NADPH or glutathione levels were determined using NADP/NADPH-Glo or GSH-Glo assay kits (Promega, Southampton, UK), as per the manufacturer’s instructions, with the exception that NADPH and GSH were quantified after 5 and 2 min incubations, respectively, of the homogenates with the relevant detection reagents. NADPH was normalized to total protein content. Glutathione content was normalized to tissue weight.
Immunohistochemistry and image analysis
Whole kidneys from Nrf2+/+or Nrf2−/−mice dosed with dimethyl sulfoxide or CDDO-Me (n=5 per group) were fixed in 10% neutral buffered formalin, then longitudinally trimmed and embedded in paraffin. Serial 4-μm-thick sections were cut and placed on polylysine-coated slides, rehydrated through serial passages in solutions at a decreasing concentration of alcohol and moved to Tris-buffered saline Tween solution, before quenching endogenous peroxidase activity through incubation in 0.3% hydrogen peroxide. After blocking non-specific labeling using a 30-min incubation at room temperature with 20% normal goat serum, the rabbit polyclonal anti-Nqo1 antibody (HPA007308, Sigma-Aldrich) was diluted 1:100 in Tris-buffered saline Tween and applied overnight at 4 °C. Negative control staining was performed by replacing the primary antibody with normal rabbit serum (X0902, Dako, Ely, UK; see Supplementary Figure S4 online) or by omitting the primary antibody. Finally, after washing in Tris-buffered saline Tween, anti-rabbit HRP EnVisionTM polymer detection system (K4011, Dako) was applied for 30 min at room temperature. After 30 min incubation with appropriate secondary antibodies, slides were washed with Tris-buffered saline Tween and 3,3'-diaminobenzidine was added as chromogen for 10 min. Slides were counterstained with Papanicolaou hematoxylin and mounted. For each experimental animal, a maximum of 10 non-overlapping microscopic fields of the cortex, including at least a glomerulus, were captured at × 100 with a Nikon DS-5Mc camera mounted on a Nikon Eclipse 80i microscope, before automated processing with ImageJ software. After elaboration of an appropriate plugin for batch measure, color channel splitting, application of color threshold, and measurement of the percentage of moderately to strongly stained areas within the microscopic fields was consecutively and automatically performed for all images and all experimental groups.
DISCLOSURE
All the authors declared no competing interests.
ACKNOWLEDGMENTS
Programme on Integrative Kidney Physiology and Pathophysiology of the European Community's seventh Framework Programme (FP7/2007-2013) under grant agreement number 2346539.
SUPPLEMENTARY MATERIAL
Figure S1.CDDO-Me activates Nrf2 pathway signaling in primary human proximal tubule epithelial cells.
Figure S2.Differentially expressed proteins in the kidneys of DMSO treated and untreated Nrf2−/−mice.
Figure S3.Dose–response and time-course analysis of Nrf2-regulated proteins in kidneys of Nrf2+/+mice exposed to a single dose of CDDO-Me.
Figure S4.Negative control immunohistochemical staining. Table S1.Microarray data for 27,037 probes detected in all samples. Table S2.Microarray data for 81 probes found to be differentially expressed (adj.P⩽0.05) in the kidneys of Nrf2−/−mice.
Table S3.Microarray data for 90 probes found to be differentially expressed (adj.P⩽0.05) in the kidneys of Nrf2+/+mice treated with CDDO-Me.
Table S4.Ingenuity pathway analysis of differentially expressed genes in the kidneys of Nrf2−/−mice or Nrf2+/+mice treated with CDDO-Me, based on microarray data.
Table S5.Microarray data for 12 genes found to be both downregulated (adj. P⩽0.05) in the kidneys of Nrf2−/−mice and upregulated (adj. P⩽0.05) in the kidneys of Nrf2+/+mice treated with CDDO-Me.
Table S6.Characterized and putative ARE-like sequences identified in promoter regions of selected genes found here to be differentially expressed in the kidneys of Nrf2−/−mice or Nrf2+/+mice treated with CDDO-Me.
Table S7.Cross-referencing of selected genes found to be
differentially expressed in the kidneys of Nrf2−/−mice, or Nrf2+/+mice treated with CDDO-Me, with ChIP-Seq data from Malhotraet al. (2010).
Table S8.iTRAQ data for 2557 proteins quantified in at least four of six mice from each group.
Table S9.iTRAQ data for 240 proteins found to be differentially expressed (rawP⩽0.05) in the kidneys of Nrf2−/−mice. Table S10.iTRAQ data for 68 proteins found to be differentially expressed (rawP⩽0.05) in the kidneys of Nrf2+/+mice treated with CDDO-Me.
Table S11.iTRAQ data for three proteins found to be both downregulated (rawP⩽0.05) in the kidneys of Nrf2−/−mice and
upregulated (raw P⩽0.05) in the kidneys of Nrf2+/+mice treated with CDDO-Me.
Table S12.Ingenuity pathway analysis of differentially expressed proteins in the kidneys of Nrf2−/−mice or Nrf2+/+mice treated with CDDO-Me, based on iTRAQ data.
Table S13.Microarray and iTRAQ data for transporter genes and proteins detected in the kidneys of Nrf2−/−mice or Nrf2+/+mice treated with CDDO-Me.
Table S14.Primers used for qPCR analysis of mouse kidney tissue. Supplementary material is linked to the online version of the paper at http://www.nature.com/ki
REFERENCES
1. Nash K, Hafeez A, Hou S. Hospital-acquired renal insufficiency.Am J Kidney
Dis2002;39: 930–936.
2. Choudhury D, Ahmed Z. Drug-associated renal dysfunction and injury.Nat
Clin Pract Nephrol2006;2: 80–91.
3. Aleksunes LM, Goedken MJ, Rockwell CEet al.Transcriptional regulation
of renal cytoprotective genes by Nrf2 and its potential use as a therapeutic target to mitigate cisplatin-induced nephrotoxicity.
J Pharmacol Exp Ther2010;335: 2–12.
4. Umemura T, Sai K, Takagi Aet al.Oxidative DNA damage, lipid
peroxidation and nephrotoxicity induced in the rat kidney after ferric
nitrilotriacetate administration.Cancer Lett1990;54: 95–100.
5. Jiang T, Huang ZP, Lin YFet al.The protective role of Nrf2 in
streptozotocin-induced diabetic nephropathy.Diabetes2010;59:
850–860.
6. Bryan HK, Olayanju A, Goldring CEet al.The Nrf2 cell defence pathway:
Keap1-dependent and -independent mechanisms of regulation.Biochem
Pharmacol2013;85: 705–717.
7. Copple IM. The Keap1-Nrf2 cell defense pathway—a promising
therapeutic target?Adv Pharmacol2012;63: 43–79.
8. Pergola PE, Krauth M, Huff JWet al.Effect of bardoxolone methyl on
kidney function in patients with T2D and Stage 3b-4 CKD.Am J Nephrol
2011;33: 469–476.
9. de Zeeuw D, Akizawa T, Audhya Pet al.Bardoxolone methyl in type 2
diabetes and stage 4 chronic kidney disease.N Engl J Med2013;369:
2492–2503.
10. Chin MP, Reisman SA, Bakris GLet al.Mechanisms contributing to adverse
cardiovascular events in patients with type 2 diabetes mellitus and stage
4 chronic kidney disease treated with bardoxolone methyl.Am J Nephrol
2014;39: 499–508.
11. Kitteringham NR, Abdullah A, Walsh Jet al.Proteomic analysis of Nrf2
deficient transgenic mice reveals cellular defence and lipid metabolism as
primary Nrf2-dependent pathways in the liver.J Proteomics2010;73:
1612–1631.
12. Enomoto A, Itoh K, Nagayoshi Eet al.High sensitivity of Nrf2 knockout
mice to acetaminophen hepatotoxicity associated with decreased expression of ARE-regulated drug metabolizing enzymes and
antioxidant genes.Toxicol Sci2001;59: 169–177.
13. Liu J, Wu KC, Lu YFet al.Nrf2 protection against liver injury produced
by various hepatotoxicants.Oxid Med Cell Longev2013;2013: 305861.
14. Walsh J, Jenkins RE, Wong Met al.Identification and quantification of the
basal and inducible Nrf2-dependent proteomes in mouse liver:
biochemical, pharmacological and toxicological implications.J Proteomics
2014;108: 171–187.
15. Shelton LM, Park BK, Copple IM. Role of Nrf2 in protection against acute
kidney injury.Kidney Int2013;84: 1090–1095.
16. Leonard MO, Kieran NE, Howell Ket al.Reoxygenation-specific activation
of the antioxidant transcription factor Nrf2 mediates cytoprotective gene
expression in ischemia-reperfusion injury.FASEB J2006;20: 2624–2626.
17. Liu M, Grigoryev DN, Crow MTet al.Transcription factor Nrf2 is protective
during ischemic and nephrotoxic acute kidney injury in mice.Kidney Int
2009;76: 277–285.
18. Yoon HY, Kang NI, Lee HKet al.Sulforaphane protects kidneys against
ischemia-reperfusion injury through induction of the Nrf2-dependent
phase 2 enzyme.Biochem Pharmacol2008;75: 2214–2223.
19. Wu QQ, Wang Y, Senitko Met al.Bardoxolone methyl (BARD) ameliorates
ischemic AKI and increases expression of protective genes Nrf2,
PPARgamma, and HO-1.Am J Physiol Renal Physiol2011;300:
F1180–F1192.
20. Elangovan S, Hsieh TC. Control of cellular redox status and upregulation of
quinone reductase NQO1 via Nrf2 activation by alpha-lipoic acid in
human leukemia HL-60 cells.Int J Oncol2008;33: 833–838.
21. Malhotra D, Portales-Casamar E, Singh Aet al.Global mapping of binding
sites for Nrf2 identifies novel targets in cell survival response through
ChIP-Seq profiling and network analysis.Nucleic Acids Res2010;38:
5718–5734.
22. Ruiz S, Pergola PE, Zager RAet al.Targeting the transcription factor Nrf2
to ameliorate oxidative stress and inflammation in chronic kidney disease.
Kidney Int2013;83: 1029–1041.
23. Choi BH, Kang KS, Kwak MK. Effect of redox modulating NRF2 activators
on chronic kidney disease.Molecules2014;19: 12727–12759.
24. Jeong HS, Ryoo IG, Kwak MK. Regulation of the expression of renal drug
transporters in KEAP1-knockdown human tubular cells.Toxicol In Vitro
2015;29: 884–892.
25. Ozkok A, Edelstein CL. Pathophysiology of cisplatin-induced acute
kidney injury.Biomed Res Int2014;2014: 967826.
26. Reisman SA, Chertow GM, Hebbar Set al.Bardoxolone methyl decreases
megalin and activates nrf2 in the kidney.J Am Soc Nephrol2012;23:
1663–1673.
27. Xu B, Yoshida Y, Zhang Yet al.Two-dimensional electrophoretic profiling
of normal human kidney: differential protein expression in glomerulus,
cortex and medulla.J Electrophoresis2005;49: 5–13.
28. Oh GS, Kim HJ, Choi JHet al.Pharmacological activation of NQO1
increases NAD levels and attenuates cisplatin-mediated acute kidney
injury in mice.Kidney Int2013;85: 547–560.
29. Gang GT, Kim YH, Noh JRet al.Protective role of NAD(P)H:quinone
oxidoreductase 1 (NQO1) in cisplatin-induced nephrotoxicity.Toxicol Lett
30. Wu KC, Cui JY, Klaassen CD. Beneficial role of Nrf2 in regulating NADPH
generation and consumption.Toxicol Sci2011;123: 590–600.
31. Tanaka Y, Aleksunes LM, Goedken MJet al.Coordinated induction of Nrf2
target genes protects against iron nitrilotriacetate (FeNTA)-induced
nephrotoxicity.Toxicol Appl Pharmacol2008;231: 364–373.
32. Wu J, Liu X, Fan Jet al.Bardoxolone methyl (BARD) ameliorates
aristolochic acid (AA)-induced acute kidney injury through Nrf2 pathway.
Toxicology2014;318: 22–31.
33. Yates MS, Tauchi M, Katsuoka Fet al.Pharmacodynamic characterization
of chemopreventive triterpenoids as exceptionally potent inducers of
Nrf2-regulated genes.Mol Cancer Ther2007;6: 154–162.
34. Nowik M, Lecca MR, Velic Aet al.Genome-wide gene expression
profiling reveals renal genes regulated during metabolic acidosis.
Physiol Genomics2008;32: 322–334.
35. Busque SM, Stange G, Wagner CA. Dysregulation of the glutamine
transporter Slc38a3 (SNAT3) and ammoniagenic enzymes in obese,
glucose-intolerant mice.Cell Physiol Biochem2014;34: 575–589.
36. Levey AS, Eckardt KU, Tsukamoto Yet al.Definition and classification of
chronic kidney disease: a position statement from Kidney Disease:
Improving Global Outcomes (KDIGO).Kidney Int2005;67: 2089–2100.
37. Small DM, Coombes JS, Bennett Net al.Oxidative stress, anti-oxidant
therapies and chronic kidney disease.Nephrology (Carlton)2012;17:
311–321.
38. Kim HJ, Sato T, Rodriguez-Iturbe Bet al.Role of intrarenal angiotensin
system activation, oxidative stress, inflammation, and impaired nuclear factor-erythroid-2-related factor 2 activity in the progression of focal
glomerulosclerosis.J Pharmacol Exp Ther2011;337: 583–590.
39. Kim HJ, Vaziri ND. Contribution of impaired Nrf2-Keap1 pathway to
oxidative stress and inflammation in chronic renal failure.Am J Physiol
Renal Physiol2010;298: F662–F671.
40. Aminzadeh MA, Nicholas SB, Norris KCet al.Role of impaired Nrf2
activation in the pathogenesis of oxidative stress and inflammation in
chronic tubulo-interstitial nephropathy.Nephrol Dial Transplant2013;28:
2038–2045.
41. Ding Y, Stidham RD, Bumeister Ret al.The synthetic triterpenoid, RTA 405,
increases the glomerular filtration rate and reduces angiotensin II-induced
contraction of glomerular mesangial cells.Kidney Int2013;83: 845–854.
42. Vaziri ND, Liu S, Farzaneh SHet al.Dose-dependent deleterious and
salutary actions of Nrf2 inducer, dh404, in chronic kidney disease.Free
Radic Biol Med2015;86: 374–381.
43. Miyazaki Y, Shimizu A, Pastan Iet al.Keap1 inhibition attenuates
glomerulosclerosis.Nephrol Dial Transplant2014;29: 783–791.
44. Itoh K, Chiba T, Takahashi Set al.An Nrf2 small Maf heterodimer mediates
the induction of phase II detoxifying enzyme genes through antioxidant
response elements.Biochem Biophys Res Commun1997;236: 313–322.
45. McMahon M, Itoh K, Yamamoto Met al.The Cap'n'Collar basic leucine
zipper transcription factor Nrf2 (NF-E2 p45-related factor 2) controls both constitutive and inducible expression of intestinal detoxification and
glutathione biosynthetic enzymes.Cancer Res2001;61: 3299–3307.
46. Irizarry RA, Hobbs B, Collin Fet al.Exploration, normalization, and
summaries of high density oligonucleotide array probe level data.
Biostatistics2003;4: 249–264.
47. Eisenhart C. The assumptions underlying the analysis of variance.
Biometrics1947;3: 1–21.
48. Benjamini Y, Hochberg Y. Controlling the false discovery rate: a practical
and powerful approach to multiple testing.J R Stat Soc B1995;57:
289–300.
49. R-Development-Core-Team.R: A Language and Environment for Statistical
Computing. R Foundation for Statistical Computing, 2005.
50. van Helden J. Regulatory sequence analysis tools.Nucleic Acids Res2003;
31: 3593–3596.
51. Hayes JD, McMahon M, Chowdhry Set al.Cancer chemoprevention
mechanisms mediated through the Keap1-Nrf2 pathway.Antioxid Redox