Int. J. Electrochem. Sci., 13 (2018) 4561 – 4574, doi: 10.20964/2018.05.68
International Journal of
ELECTROCHEMICAL
SCIENCE
www.electrochemsci.org
Facile Synthesis of Mn
2O
3for Highly Active Catalytic Oxidation
and Reduction of Organic Substances and Electrochemical
Determination of L-Methionine
Ragu Sasikumar1, Tse-Wei Chen1,Shen-Ming Chen1,*, Syang-Peng Rwei2, Ming-Chin Yu3,4* 1
Department of Chemical Engineering and Biotechnology, National Taipei University of Technology, No. 1, Section 3, Chung-Hsiao East Road, Taipei 106, Taiwan, ROC.
2
Institute of Organic and Polymeric Materials, National Taipei University of Technology, No. 1, Section 3, Chung-Hsiao East Road, Taipei 106, Taiwan, ROC.
3
Department of Surgery, Chang Gung Memorial Hospital, Taoyuan 333, Taiwan, ROC. 4
Department of Surgery, Xiamen Chang Gung Hospital, Xiamen, Fujian, China *
E-mail: smchen78@ms15.hinet.net, mingchin2000@gmail.com
Received: 16 January 2018 / Accepted: 10 March 2018 / Published: 10 April 2018
This paper reports the electrochemical determination of L-Methionine (L-Met) in phosphate buffer solution (pH = 7.0) utilizing the Mn2O3 on screen-printed carbon electrode (Mn2O3/SPCE) and Mn2O3 catalyst display excellent activity for catalytic reduction of p-Nitrophenol. Initially, as-prepared Mn2O3 were characterized by various analytical methods. From the electrochemical studies bare SPCE showed an ill-defined oxidation peak around 1.214 (0.02) V for L-Met whereas Mn2O3/SPCE showed a well-defined oxidation peak at 1.173 (0.02) V. Under optimum conditions, the Mn2O3/SPCE showed a linear range of L-Met concentrations of 1.0 x 10⁻⁶ to 6.1 x 10⁻⁴ M. The limit of detection is about 1.0 x 10⁻⁹ M (S/N = 3). The presently modified working electrode has also been effectively applied for the determination of L-Met in real sea food samples. The Mn2O3 signifies user-friendly, strong and high sensitive with real applications for electrochemical determination of amino acids as well as catalytic reduction of p-Nitrophenol.
Keywords: Manganese oxide, amino acid, L-Methionine, p-Nitrophenol, Wild Salman.
1. INTRODUCTION
predominant manganese oxide phases, and its applications as electrode materials in primary Li/MnO2 batteries, catalysts in ion sieves as well as in electrochemical capacitors [17–23]. The preparation of MnO2 is difficult techniques due to its problematical designates of process control. Many synthesis procedures available for MnO2 such as reduction process [24], sol-gel [25], thermal oxidation [26], and chemical co-precipitation [27]. Manganese oxide employed an important role in electrochemical biosensors in recent years. Recent years, scientists were reported numerous electrochemical sensors based on MnO2 [28-30].
Most of the animals, and plants have sulphur involved chemical compounds and them performance a vital role in the active system [31]. L-methionine (L-Met) have sulphur-attached protein genic amino acids. It originates and avoids the infections in hair, and skin. It is a considerable amino acid and consequential role for living methylation reactions. By incrementing lecithin engenderment, L-Met is utilized to reduce the cholesterol level and additionally paramount for human magnification [32]. Deficiencies of L-Met have been attributed to muscle paralysis, toxemia, despondency, and reduced magnification [33]. Above-mentioned astringent effects of L-Met, the dosage level must be quantified in pharmaceutical performs. Accordingly, the purpose of L-Met is very consequential in the medical perspective. The electrochemical method has remarkable receptiveness due to its great selectivity and sensitivity, quick response, low cost, and simple procedure. From the literature survey there is many oxidation studies reported for L-Met by betokens of different modified working electrodes such as an electro-polymerized film of non-peripheral amine superseded Cu(II) phthalocyanine [34], poly (3-amino-5-mercapto-1,2,4-triazole) [35], colloidal-gold cysteamine [36], and poly (methyl violet) [37]. The chemical structure of L-Methionine as exhibited in Scheme 1.
Scheme 1. Chemical structure of L-Met.
2. EXPERIMENTAL SECTION
2.1. Materials
Manganese acetate tetrahydrate [Mn(OAc)2.4H2O] (>99%), N, N’-dimethylformamide (DMF) (99.8%), acetone (99.7%), and L-Methionine (L-Met) (≧98%) were obtained from Sigma-Aldrich. All the chemicals, reagents, and solvents used were of analytical grade. De-ionized water was used throughout the experiments.
2.2. Methods
2.2.1. Synthesis of Mn2O3
Initially, 0.091 g of [Mn(OAc)2.4H2O] was dissolved in 67.5 mL of DMF under constant stirring, and 7.5 mL of DI water was added to get a final concentration of 5 x 10⁻³ M. The yellowish-brown solution was stirred at 49 °C for 1 h and the resulting solution was left to stand for 3 months under at room temperature. After 3 months, the dark brown precipitate was obtained. The obtained precipitate was centrifuged, and washed several times with DI water and acetone to remove excess surfactant from the solution, and then dried in air at 120 °C for 30 minutes.
2.2.2. Fabrication of Mn2O3/SPCE
5 mg of Mn2O3 was well dispersed in 1 mL water under ultrasonic treatment for 1 h. On the surface of SPCE, the optimized concentration of about 8 µL of a dispersed solution was drop cast on the active surface of the SPCE followed by drying in an air oven at 30 °C for 1 h.
2.2.3. Characterization
3. RESULTS AND DISCUSSION
[image:4.596.190.401.210.383.2]3.1. Structural properties
Fig. 1 shows that the Mn2O3 diffraction peaks are detected at 2θ ca. 23.1° (211), 32.9° (222), 38.1° (400), 45.0° (332), 49.3° (431), 55.0° (440), and 65.7° (622) of Mn2O3 can be well correlated with pure Mn2O3 (JCPDS #24-0508) [38-40]. For Mn2O3, no other peaks were noticed from extra phases, proposing that the as-synthesized Mn2O3 are of high purity.
Figure 1. PXRD pattern for Mn2O3.
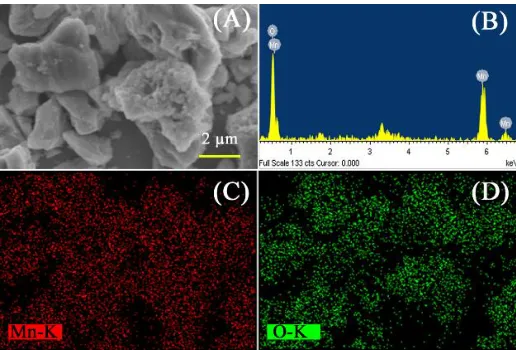
SEM with EDX analysis studied the structural, and elemental composition of the as-prepared Mn2O3. SEM images of prepared Mn2O3 is shown in Fig. 2 (A). It is seen that, Mn2O3 micro-clusters are not uniformly spread. The spectrum of EDX, elemental color mapping for synthesized Mn2O3 are shown in Fig. 2 (B-D). The spectrum shows the peaks equivalent to manganese and oxygen. The results confirm the purity of as-synthesized micro-clusters with no chemical impurities [37].
[image:4.596.169.427.538.713.2][image:5.596.148.447.183.396.2]
The textural properties of the Mn2O3 sample were studied by N2 adsorption/desorption isotherm, as shown in Fig. 3. The Mn2O3 sample showed isotherm curve close to the typical type III (IUPAC classification) isotherm. Therefore, a Brunauer-Emmett-Teller (BET) surface area of Mn2O3 sample was ca. 2.48 m2 g1. The above result tells the probability of as-prepared Mn2O3 sample with satisfactory surface area.
Figure 3. N2 adsorption/desorption isotherm for Mn2O3.
3.2. Electro-catalytic oxidation of L-Met at Mn2O3/SPCE
Figure 4. CVs obtainted of (a) bare SPCE, and (b) Mn2O3/SPCE in N2 saturated 200 µM L-Met containing PBS at the scanning rate of 50 mV s-1.
Scheme 2. Oxidation mechanism of L-Met.
3.3. Influence of L-Met addition
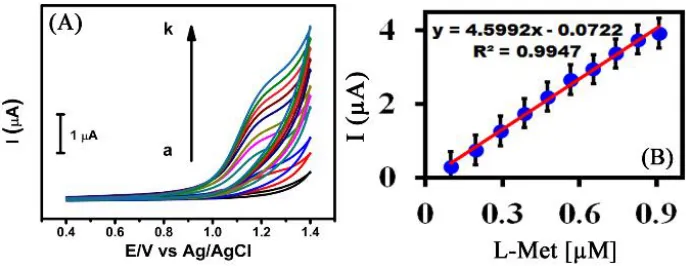
[image:6.596.185.407.83.258.2]Figure 5. CVs obtained of (A) Mn2O3/SPCE different concentrations of L-Met (a = absence; b-k = 100-1000 µM L-Met, and (B) plot of oxidation peak current versus the concentration of L-Met in N2 saturated PBS at the scanning rate of 50 mV s-1.
[image:6.596.126.469.470.603.2]
behavior of L-Met at Mn2O3/SPCE, and can be used for sensitive determination of L-Met. Fig. 5B demonstrates the plot between oxidation peak current, and L-Met concentrations, which may be communicated by a linear regression equation as Epa (V) = 4.5992x – 0.0722, R2 = 0.9947.
3.4. Influence of scanning rates
Fig. 6A shows that the effect of scanning rate of electro-catalytic oxidation responses of Mn2O3/SPCE in PBS (pH 7) for the determination of L-Met. The CV curves observed the oxidation peak currents are gradually increased when increasing the anodic peaks from 20 to 200 mV s-1. When the oxidation peaks current (Ipa) increases the scanning rates also increases linearly which may be communicated by a linear regression equation as Epa (V) = 0.032x – 0.0063, R2 = 0.9977. Additionally, the linear plot among oxidation peak current versus the square root of the scanning rates has displayed a relationship which suggesting that the oxidation process of L-Met appeared at the Mn2O3/SPCE is a diffusion controlled electron transfer process Fig. 6B. From the results, we approve that the observed CV reports are due to the determination of L-Met diffused on the surface of the Mn2O3/SPCE.
LOD=3Sb/b --- 1
The LOD is calculated by using the above formula, slope of the straight line of the electrochemical analytical curve and SD of the mean value for ten voltammograms of the blank (Sb).
Figure 6. CVs obtained of (A) Mn2O3/SPCE different scanning rates of 200 µM L-Met from 20 to 200 mV s-1, and (B) plot of oxidation peak current versus the square root of the scanning rates in N2 saturated PBS at the scanning rate of 50 mV s-1.
3.5. Calibration curve, and limit of detection
[image:7.596.127.474.409.536.2]
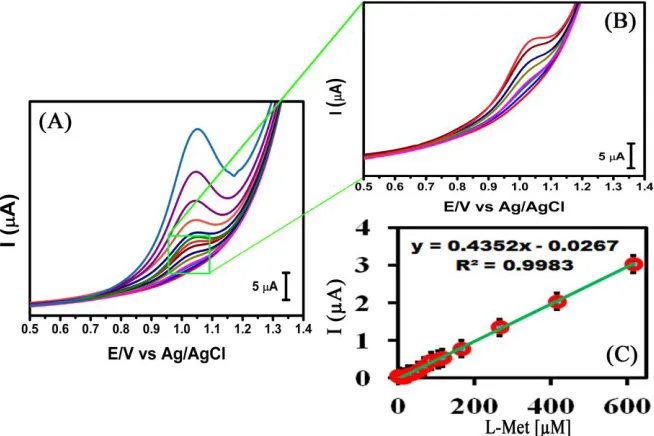
obtained using 1.0 x 10⁻⁶ M to 6.1 x 10⁻⁴ M of L-Met and a linear regression values and correlation coefficient as Ipa (V) = 0.4352x + 0.0267 and R² = 0.9983 respectively. The comparison of analytical parameters such as concentration range, and limit of detection of L-Met with other modified electrodes compared to previous reports (Table 1).
[image:8.596.135.462.156.374.2]Figure 7. DPVs obtained of (A) Mn2O3/SPCE different concentrations from 1.0 x 10⁻⁶ M to 6.1 x 10⁻⁴ M (B) lower concentrations, and (C) calibration curve of peak current versus the concentrations of L-Met in N2 saturated PBS at the scanning rate of 50 mV s-1.
Table 1. Similarity parameters for detection of L-Met at a various modified electrode.
Electrode Substrate Linear range (M) Detection limit (M) Ref ETAP-Cu(II)/GCE 5.0 x 10⁻⁵ – 5.0 x 10⁻⁴ 2.7 x 10⁻⁸ 34
PAMT/GCE 1.0 x 10⁻⁷ – 1.0 x 10⁻⁴ 4.1 x 10⁻¹⁰ 35
Au-Cys/GCE 1.0 x 10⁻⁶ – 1.0 x 10⁻⁴ 5.9 x 10⁻⁷ 36
Bi (V) -PbO2/Au 1.0 x 10⁻³ 41
SWCNT-NiCNT/GCE 1.0 x 10⁻⁵ – 1.0 x 10⁻⁴ 4.5 x 10⁻⁶ 42
Ni/CCE 2.0 x 10⁻⁶ – 9.0 x 10⁻⁵ 2.0 x 10⁻⁶ 43
Rh2POM/CE 7.3 x 10⁻⁴ 44
GO/SPCE 2.0 x 10⁻⁶ – 9.6 x 10⁻⁵ 1.8 x 10⁻⁷ 45
Co(OH)2/GCE 2.5 x 10⁻¹ – 1.2 x 100 1.6 x 10⁻⁴ 46
F-C60/GCE 1.0 x 10⁻⁵ – 1.0 x 10⁻³ 8.2 x 10⁻⁶ 47
Mn2O3/SPCE 1.0 x 10⁻⁶ – 6.1 x 10⁻⁴ 1.0 x 10⁻⁹ This
[image:8.596.62.535.487.675.2]
3.6. Accumulation time, reproducibility, and operational stability
To study the impacts of an accumulation time for the electro-catalytic oxidation of L-Met, the CV curve were reported for Mn2O3/SPCE in the presence of 200 μM L-Met in 0.05 M PBS (pH 7) with a scanning rate of 50 mV s1 as shown in Fig. 8A. Additionally, the oxidation peak currents for L-Met were recorded for the different accumulation time started from 0 to 210 s, where the higher electro-catalytic oxidation peak current was detected for 90 s. Therefore, the modified electrode was optimized with suitable accumulation time was considered to be 90 s for a proficient electro-catalytic oxidation of L-Met molecule. Reproducibility of the sensor, was determined by using five different Mn2O3/SPCE were modified and verified towards 200 μM L-Met. The attained reproducibility results are displayed in Fig. 8B which reveals that the Mn2O3/SPCE have an excellent reproducible ability, and the electrode can be used for exact detection of L-Met. The CV response of 100 nonstop cycles of the Mn2O3/SPCE in the absence and presence of L-Met is shown in Fig. 8C, D. The results indicated Mn2O3/SPCE has long-term stability [48].
Figure 8. CV response of (A) accumulation time (B) reproducibility (C) operational stability of 100 nonstop cycles without, and (D) with L-Met of Mn2O3/SPCE N2 saturated PBS at the scanning rate of 50 mV s-1.
3.7. Real sample analysis
[image:9.596.158.444.321.511.2]
Figure 9. DPV curves of the Mn2O3/SPCE in (A) Wild Salman (C) Shrimp samples containing L-Met with PBS (pH 7), and (B) plots of oxidation current versus L-Met + Wild salman extract and (D) plots of oxidation current versus L-Met + Shrimp extract were obtained at a scanning rate of 50 mV s-1.
Table 2. Real sample analysis of L-Met using spiked method Mn2O3/SPCE. (n = 3)
S.No Samples Added
(µM)
Found (µM)
Recovery (%)
RSD (%)
1 Wild Salman
10 9.59 95.9 2.25
20 21.45 107.25 3.61
30 30.26 100.86 3.58
2 Shrimp
10 9.23 92.3 2.15
20 20.95 104.75 2.95
30 25.32 84.4 4.12
RSD = Relative standard deviation
3.8. Catalytic reduction of p-NP
[image:10.596.90.506.424.540.2]
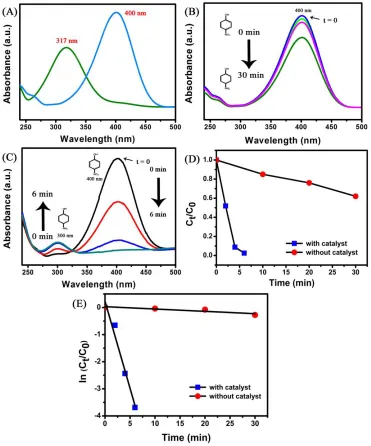
gradually improved with time, showing the expected formation of p-Aminophenol (p-AP). Moreover, even in the existence of strong reducing agent NaBH4, the wavelength, and intensity of the peak responsible for p-Nip (at 400 nm) stayed closely unmoved in the absence of a Mn2O3.
Figure 10. (A) UV-Vis spectra obtained from aqueous p-NP before (green curve) and after (blue curve) the addition of NaBH4 solution, (B) Absorption spectra of aqueous solution containing p-NP (1 x 10⁻⁴ M) and NaBH4 (1 M) without Mn2O3, (C) with Mn2O3 (D) Plots of Ct/C0 versus reaction time (min), and (F) Plots of ln (Ct/C0) versus reaction time (s) for the reduction of p-NP with Mn2O3.
[image:11.596.113.484.137.583.2]
activity is known to depend on the surface area of the Mn2O3 as well as the mass transfer resistant to the reactant. The final clearly assistances from the mesoscopic properties such as surface area, pore volume, and porous size of the Mn2O3. The catalytic reduction of p-NP, which is the rate-determining step is activated by the relations of the adsorbed p-NP with hydrogen atoms bound on the active surfaces of Mn2O3 (Steps II and III). As a result of reduction reaction, p-AP is formed, followed by the desorption of product from the Mn2O3 (Step IV) and reactivation of the Mn2O3 system [27].
Scheme 3. The suggested mechanism of the catalytic reduction of the 4-NP by NaBH4 using Mn2O3.
4. CONCLUSIONS
ACKNOWLEDGEMENTS
The authors gratefully acknowledge the financial support of the National Taipei University of Technology, and Chang Gung Memorial Hospital Joint Research Program(NTUT-CGMH-107-No.04), (CORPG1H0011). The National Science Council, and The Ministry of Education, Taiwan supported this work. We would also like to acknowledge The Ministry of Science and Technology, Taiwan (MOST 106-2113-M-027-003) for its financial support.
References
1. S. Ching, D. A. Kriz, K. M. Luthy, E. C. Njagi and S. L. Suib, Chem. Commun., 47 (2011) 8286. 2. C. Yuan, L. Hou, L. Yang, D. Li, L. Shen, F. Zhang and X. Zhang, J. Mater. Chem., 21 (2011)
16035.
3. L. Espinal, W. Wong-Ng, J. A. Kaduk, A. J. Allen, C. R. Snyder, C. Chiu, D. W. Siderius, L. Li, E. Cockayne, A. E. Espinal and S. L. Suib, J. Am. Chem. Soc., 134 (2012) 7944.
4. A. K. Sinha, M. Basu, M. Pradhan, S. Sarkar, Y. Negishi, T. Pal, J. Phys. Chem. C 114 (2010) 21173.
5. J. Cao, Q. Mao and Y. Qian, J. Solid State Chem., 191 (2012) 10.
6. Y. Ren, Z. Ma, L. Qian, S. Dai, H. He and P. G. Bruce, Catal. Lett., 131 (2009) 146. 7. Y. Wang, Y. Wang, D. Jia, Z. Peng, Y. Xia and Zheng, Nano Lett., 14 (2014) 1080.
8. Y. Zhang, Y. Yan, X. Wang, G. Li, D. Deng, L. Jiang, C. Shu and C. Wang, Chem. – Eur. J., 20 (2014) 1.
9. Y. Qiao, Y. Yu, Y. Jin, Y. –B. Guan and C. –H. Chen, Electrochim. Acta 132 (2014) 323. 10.Y. Dai, H. Jiang, Y. Hu and C. Li, RSC Adv., 3 (2013) 19778.
11.Y. Cai, S. Liu, X. Yin, Q. Hao, M. Zhang, T. Wang, Phys. E 43 (2010) 70. 12.M. –W. Xu, Y. –B. Niu, S. Bao and C. M. Li, J. Mater. Chem. A 2 (2014) 3749.
13.(a) J. J. Cao, Y. Zhu, K. Bao, L. Shi, S. Liu and Y. Qian, J. Phys. Chem. C 113 (2009) 17755; (b) L. Chang, L. Mai, X. Xu, Q. An, Y. Zhao, D. Wang and X. Feng, RSC Adv. 3 (2013) 1947. 14.Y. Deng, Z. Li, Z. Shi, H. Xu, F. Peng and G. Chen, RSC Adv. 2 (2012) 4645.
15.X. Zhang, Y. Qian, Y. Zhu and K. Tang, Nanoscale 6 (2014) 1725.
16.P. Pal, A. K. Giri, S. Mahanty, A. B. Panda, CrystEngComm., 16 (2014) 10560. 17.H. Y. Lee and J. B. Goodenough, J. Solid State Chem., 144 (1999) 220.
18.S. –C. Pang, M. A. Anderson and T. W. Chapman, J. Electrochem. Soc., 147 (2000) 444. 19.Y. U. Jeong and A. Manthiram, J. Electrochem. Soc., 149 (2002) A1419.
20.J. –K. Chang and W. –T. Tsai, J. Electrochem. Soc., 150 (2003) A1333. 21.C. –C. Hu and C. –C. Wang, J. Electrochem. Soc., 150 (2003) A1079.
22.H. Y. Lee, S. W. Kim and H. Y. Lee, Electrochem. Solid State Lett., 4 (2001) A19. 23.M. Toupin, T. Brousse and D. Belanger, Chem. Mater., 16 (2004) 3184.
24.T. E. Moore, M. Ellis and P. W. Selwood, J. Am. Chem. Soc., 72 (1950) 856.
25.J. W. Long, A. L. Young and D. R. Rolison, J. Electrochem. Soc., 150 (2003) A1161. 26.R. N. Reddy and R. G. Reddy, J. Power Sources 124 (2003) 330.
27.S. –J. Bao, B. –L. He, Y. –Y. Liang, W. –J. Zhou and H. –L. Li, Mater Sci Eng A 397 (2005) 305. 28.J. Liu, Q. Sheng, F. Nie and J. Zheng, J. Electrochem. Soc., 161 (2014) B225.
29.A. Puangjan, S. Chaiyasith, S. Wichitpanya, S. Daengduang and S. Puttota, J. Electrochem. Soc., 782 (2016) 192.
30.J. Chen, W. –D. Zhang and J. –S. Ye, Electrochem Commun., 10 (2008) 1268. 31.D. Voet and J. G. Voet, Biochemistry, II edn, Wiley, New York (1995). 32.M. Salimi and Roushani, Electroanal., 18 (2006) 2129.
36.N. D. Popovic and D. C. Johnson, Electroanal., 11 (1999) 934.
37.K. S. Pugazhvadivu, K. Ramachandran, and Tamilarasan, Physics Procedia 49 (2013) 205. 38.Q. Javed, F. P. Wang, M. Y. Rafique, A. M. Toufiq, Q. S. Li, H. Mahmood and W. Khan,
Nanotechnology 23 (2012) 1.
39.S. Zhan, D. Zhu, M. Qiu, H. Yu and Y. Li, RSC Adv., 5 (2015) 29353.
40.F. Jiao, A. Harrison, A. H. Hill and P. G. Bruce, Adv. Mater., 19 (2007) 4063.
41.H. Xu, W. Zhang, W. Zhu, D. Wang, J. Ye, K. Yamamoto and L. Jin, Anal. Chim. Acta 545 (2005) 182.
42.O. Daniel, BJU Int., 26 (1954) 153.
43.P. Kalimuthu and S. A. John, Electrochem. Commun., 11 (2009) 367. 44.S. B. Revin and S. A. John, Electrochim. Acta 56 (2001) 8934.
45.R. Sasikumar, P. Ranganathan, S. –M. Chen, T. Kavitha, S. –Y. Lee, T. –W. Chen and W. –H. Chang, Int. J. Electrochem. Sci. 12 (2017) 4077.
46.P. Kalimuthu and S. A. John, Electrochim. Acta 55 (2009) 183. 47.J. G. Velasco, Electroanal., 9 (1997) 880.
48.R. Sasikumar, M. Govindasamy, S. –M. Chen, Y. –C. Liu, P. Ranganathan and S. –P. Rwei, J. Colloid Interface Sci., 504 (2017) 626.