This is a repository copy of
Developing and evaluating a tool to measure general practice
productivity: a multimethod study
.
White Rose Research Online URL for this paper:
http://eprints.whiterose.ac.uk/134411/
Version: Published Version
Article:
Dawson, J. orcid.org/0000-0002-9365-8586, Rigby-Brown, A., Adams, L. et al. (8 more
authors) (2019) Developing and evaluating a tool to measure general practice productivity:
a multimethod study. Health Services and Delivery Research, 7 (13). ISSN 2050-4349
https://doi.org/10.3310/hsdr07130
© Queen’s Printer and Controller of HMSO 2019. Reproduced in accordance with the
publisher's self-archiving policy.
[email protected] https://eprints.whiterose.ac.uk/
Reuse
Items deposited in White Rose Research Online are protected by copyright, with all rights reserved unless indicated otherwise. They may be downloaded and/or printed for private study, or other acts as permitted by national copyright laws. The publisher or other rights holders may allow further reproduction and re-use of the full text version. This is indicated by the licence information on the White Rose Research Online record for the item.
Takedown
If you consider content in White Rose Research Online to be in breach of UK law, please notify us by
VOLUME 7 ISSUE 13 MARCH 2019 ISSN 2050-4349
Developing and evaluating a tool to measure general
practice productivity: a multimethod study
measure general practice productivity:
a multimethod study
Jeremy Dawson,
1,2
* Anna Rigby-Brown,
2
Lee Adams,
2
Richard Baker,
3
Julia Fernando,
4
Amanda Forrest,
2
Anna Kirkwood,
5
Richard Murray,
6
Michael West,
6
Paul Wike
7
and Michelle Wilde
7
1
Sheffield University Management School, The University of Sheffield, Sheffield, UK
2
School of Health and Related Research (ScHARR), The University of Sheffield,
Sheffield, UK
3
Department of Health Sciences, University of Leicester, Leicester, UK
4
Aston Business School, Aston University, Birmingham, UK
5
The Medical School, The University of Sheffield, Sheffield, UK
6
The King
’
s Fund, London, UK
7
Dovercourt Surgery, Sheffield, UK
*Corresponding author
Declared competing interests of authors:Jeremy Dawson is a board member of the National Institute for Health Research Health Service and Delivery Research programme. Amanda Forrest is a board member of Sheffield Clinical Commissioning Group.
Published March 2019
DOI: 10.3310/hsdr07130
This report should be referenced as follows:
ISSN 2050-4349 (Print) ISSN 2050-4357 (Online)
This journal is a member of and subscribes to the principles of the Committee on Publication Ethics (COPE) (www.publicationethics.org/). Editorial contact: [email protected]
The full HS&DR archive is freely available to view online at www.journalslibrary.nihr.ac.uk/hsdr. Print-on-demand copies can be purchased from the report pages of the NIHR Journals Library website: www.journalslibrary.nihr.ac.uk
Criteria for inclusion in theHealth Services and Delivery Researchjournal
Reports are published inHealth Services and Delivery Research(HS&DR) if (1) they have resulted from work for the HS&DR programme or programmes which preceded the HS&DR programme, and (2) they are of a sufficiently high scientific quality as assessed by the reviewers and editors.
HS&DR programme
The Health Services and Delivery Research (HS&DR) programme, part of the National Institute for Health Research (NIHR), was established to fund a broad range of research. It combines the strengths and contributions of two previous NIHR research programmes: the Health Services Research (HSR) programme and the Service Delivery and Organisation (SDO) programme, which were merged in January 2012.
The HS&DR programme aims to produce rigorous and relevant evidence on the quality, access and organisation of health services including costs and outcomes, as well as research on implementation. The programme will enhance the strategic focus on research that matters to the NHS and is keen to support ambitious evaluative research to improve health services.
For more information about the HS&DR programme please visit the website: http://www.nets.nihr.ac.uk/programmes/hsdr
This report
The research reported in this issue of the journal was funded by the HS&DR programme or one of its preceding programmes as project number 13/157/34. The contractual start date was in June 2015. The final report began editorial review in March 2018 and was accepted for publication in August 2018. The authors have been wholly responsible for all data collection, analysis and interpretation, and for writing up their work. The HS&DR editors and production house have tried to ensure the accuracy of the authors’report and would like to thank the reviewers for their constructive comments on the final report document. However, they do not accept liability for damages or losses arising from material published in this report.
This report presents independent research funded by the National Institute for Health Research (NIHR). The views and opinions expressed by authors in this publication are those of the authors and do not necessarily reflect those of the NHS, the NIHR, NETSCC, the HS&DR programme or the Department of Health and Social Care. If there are verbatim quotations included in this publication the views and opinions expressed by the interviewees are those of the interviewees and do not necessarily reflect those of the authors, those of the NHS, the NIHR, NETSCC, the HS&DR programme or the Department of Health and Social Care.
© Queen’s Printer and Controller of HMSO 2019. This work was produced by Dawsonet al.under the terms of a commissioning contract issued by the Secretary of State for Health and Social Care. This issue may be freely reproduced for the purposes of private research and study and extracts (or indeed, the full report) may be included in professional journals provided that suitable acknowledgement is made and the reproduction is not associated with any form of advertising. Applications for commercial reproduction should be addressed to: NIHR Journals Library, National Institute for Health Research, Evaluation, Trials and Studies Coordinating Centre, Alpha House, University of Southampton Science Park, Southampton SO16 7NS, UK.
NIHR Journals Library Editor-in-Chief
Professor Ken Stein Chair of HTA and EME Editorial Board and Professor of Public Health,
University of Exeter Medical School, UK
NIHR Journals Library Editors
Professor Ken Stein Chair of HTA and EME Editorial Board and Professor of Public Health,
University of Exeter Medical School, UK
Professor Andrée Le May Chair of NIHR Journals Library Editorial Group (HS&DR, PGfAR, PHR journals)
Professor Matthias Beck Professor of Management, Cork University Business School, Department of Management
and Marketing, University College Cork, Ireland
Dr Tessa Crilly Director, Crystal Blue Consulting Ltd, UK
Dr Eugenia Cronin Senior Scientific Advisor, Wessex Institute, UK
Dr Peter Davidson Consultant Advisor, Wessex Institute, University of Southampton, UK
Ms Tara Lamont Scientific Advisor, NETSCC, UK
Dr Catriona McDaid Senior Research Fellow, York Trials Unit, Department of Health Sciences,
University of York, UK
Professor William McGuire Professor of Child Health, Hull York Medical School, University of York, UK
Professor Geoffrey Meads Professor of Wellbeing Research, University of Winchester, UK
Professor John Norrie Chair in Medical Statistics, University of Edinburgh, UK
Professor John Powell Consultant Clinical Adviser, National Institute for Health and Care Excellence (NICE), UK
Professor James Raftery Professor of Health Technology Assessment, Wessex Institute, Faculty of Medicine,
University of Southampton, UK
Dr Rob Riemsma Reviews Manager, Kleijnen Systematic Reviews Ltd, UK
Professor Helen Roberts Professor of Child Health Research, UCL Great Ormond Street Institute of Child Health, UK
Professor Jonathan Ross Professor of Sexual Health and HIV, University Hospital Birmingham, UK
Professor Helen Snooks Professor of Health Services Research, Institute of Life Science, College of Medicine,
Swansea University, UK
Professor Jim Thornton Professor of Obstetrics and Gynaecology, Faculty of Medicine and Health Sciences,
University of Nottingham, UK
Professor Martin Underwood Warwick Clinical Trials Unit, Warwick Medical School, University of Warwick, UK
Please visit the website for a list of editors: www.journalslibrary.nihr.ac.uk/about/editors
Editorial contact: [email protected]
Abstract
Developing and evaluating a tool to measure general
practice productivity: a multimethod study
Jeremy Dawson,
1,2* Anna Rigby-Brown,
2Lee Adams,
2Richard Baker,
3Julia Fernando,
4Amanda Forrest,
2Anna Kirkwood,
5Richard Murray,
6Michael West,
6Paul Wike
7and Michelle Wilde
71Sheffield University Management School, The University of Sheffield, Sheffield, UK
2School of Health and Related Research (ScHARR), The University of Sheffield, Sheffield, UK
3Department of Health Sciences, University of Leicester, Leicester, UK
4Aston Business School, Aston University, Birmingham, UK
5The Medical School, The University of Sheffield, Sheffield, UK
6The King’s Fund, London, UK 7Dovercourt Surgery, Sheffield, UK
*Corresponding author [email protected]
Background:Systems for measuring the performance of general practices are extremely limited.
Objectives:The aim was to develop, pilot test and evaluate a measure of productivity that can be applied across all typical general practices in England, and that may result in improvements in practice, thereby leading to better patient outcomes.
Methods:Stage 1–the approach used was based on the Productivity Measurement and Enhancement System (ProMES). Through 16 workshops with 80 general practice staff and 72 patient representatives, the objectives of general practices were identified, as were indicators that could measure these objectives and systems to convert the indicators into an effectiveness score and a productivity index. This was followed by a consensus exercise involving a face-to-face meeting with 16 stakeholders and an online survey with 27 respondents. An online version of the tool [termed the General Practice Effectiveness Tool (GPET)] and detailed guidance were created. Stage 2–51 practices were trained to use the GPET for up to 6 months, entering data on each indicator monthly and getting automated feedback on changes in effectiveness over time. The feasibility and acceptability of the GPET were examined via 38 telephone interviews with practice representatives, an online survey of practice managers and two focus groups with patient representatives. Results:The workshops resulted in 11 objectives across four performance areas: (1)clinical care,
Limitations:It was not possible to create a measure that provides comparability between all practices, and most practices could not provide sufficient financial data to create a productivity index, leaving an effectiveness measure instead. Having a relatively small number of practices, with no control group, limited this study, and there was a limited timescale for the testing and evaluation.
Implications:The GPET has demonstrated some viability as a tool to aid practice improvement. The model devised could serve as a basis for measuring effectiveness in general practice more widely.
Future work:Some additional research is needed to refine the GPET. Enhanced testing with a control sample would evaluate whether or not it is the use of the GPET that leads to improved performance. Funding:The National Institute for Health Research Health Services and Delivery Research programme.
ABSTRACT
Contents
List of tables xi
List of figures xiii
Glossary xv
List of abbreviations xvii
Plain English summary xix
Scientific summary xxi
Chapter 1Introduction and background 1
Introduction 1
The context of general practice in England 1
Overview of measurement of productivity and effectiveness in general practice 2
Performance measurement: literature review 4
Overall performance measurement 4
Performance measurement in primary care 4
General practice performance in the NHS 7
Productivity Measurement and Enhancement System 11
Research aims and objectives 13
Chapter 2Factors affecting performance in general practice: a mapping review 15
Aims of the review and review question 15
Methods 15
Defining the map parameters 15
Search strategy 16
Study selection 16
Data extraction 16
Quality assessment 18
Data synthesis 18
Results 19
Search results 19
Study designs 20
Quality assessment 20
Data synthesis: study mapping 21
Means of evaluating productivity, quality and effectiveness 21
Features and processes adaptable at practice level 21
Implications 24
Conclusions 25
Chapter 3Overall methods 27
Research objectives 27
Overall study design 27
Stage 1a: ProMES-based workshops 27
Stage 1b: finalisation of the measure 28
Stage 2a: piloting of the measure 28
Chapter 4Stage 1: developing the measure 31
Overall plan for stage 1 31
Detailed workshop methods 31
Phase 1 workshops 31
Phase 2 workshops 32
Phase 3 workshops 34
Consensus exercise methods 36
Part 1: general practitioners only 37
Part 2: all respondents 37
Phase 1 workshops: findings 37
Phases 2 and 3 workshops: findings 40
Clinical care 41
Practice management 42
Patient focus 44
External focus 45
Consensus exercise: findings 47
Initial meeting 47
Online survey 49
Development of the online tool 50
Software: Effecteev 50
Involvement of PRIMIS 51
Final tool for piloting 52
Chapter 5Stage 2: piloting and evaluating the measure 69
Overall plan for stage 2 69
Detailed stage 2 methods 69
Pilot study in general practices 69
Interviews with practice staff and members of the public 72
Practice manager questionnaire 72
Findings from the pilot study 73
Findings from interviews 78
Interviews with staff 78
Feedback from patients and the public 85
Findings from the practice manager questionnaire 87
On average, how much time (in hours) would you estimate was spent on using the
tool per month? 87
Usefulness and ease of use 87
What, if any, additional resources were needed to use the tool? 87
Did you experience difficulties in using the software itself? 88
Please describe briefly the difficulties you encountered 88
Were there any performance areas missing from the General Practice Effectiveness Tool? 88
Were there any objectives missing from the General Practice Effectiveness Tool? 88
Were any of the indicators problematic to gather? 88
Were any of the indicators problematic to interpret? 89
Discussion of feedback 89
Did the feedback/data lead to any actions taken to improve effectiveness? 89
If you have any other comments about the General Practice Effectiveness Tool,
please state these here 89
Financial data 90
Conclusions 91
CONTENTS
Chapter 6Discussion 93
Overall summary of research findings 93
The overall effectiveness model 94
How feasible is it to measure general practice productivity? 96
Successful use of the tool 98
Changes in effectiveness 99
Specific areas for future development 100
Performance area: clinical care 100
Performance area: practice management 101
Performance area: patient focus 102
Performance area: external focus 102
The online General Practice Effectiveness Tool 103
Use of feedback 103
Implications for practices 104
Implications for the wider system 105
Limitations and future directions 105
Recommendations for research 107
Overall conclusions 108
Acknowledgements 109
References 111
Appendix 1Database search strategies 121
Appendix 2Mapping review data extraction form 125
Appendix 3Mapping review quality assessment 127
Appendix 4Mapping review data synthesis study mapping 137
Appendix 5Interview schedule (practice staff) 145
Appendix 6Interview schedule (patients) 147
Appendix 7Measuring General Practice Productivity public focus group schedule 149
Appendix 8The General Practice Effectiveness Tool 151
Appendix 9Practice manager questionnaire and quantitative results 167
Appendix 10Change over time by indicator 177
Appendix 11Improvements to the General Practice Effectiveness Tool suggested
List of tables
TABLE a Performance areas and objectives of general practices xxiii
TABLE 1 The 2017/18 QOF domains, areas, numbers of indicators and points
available 8
TABLE 2 The SPIDER framework 15
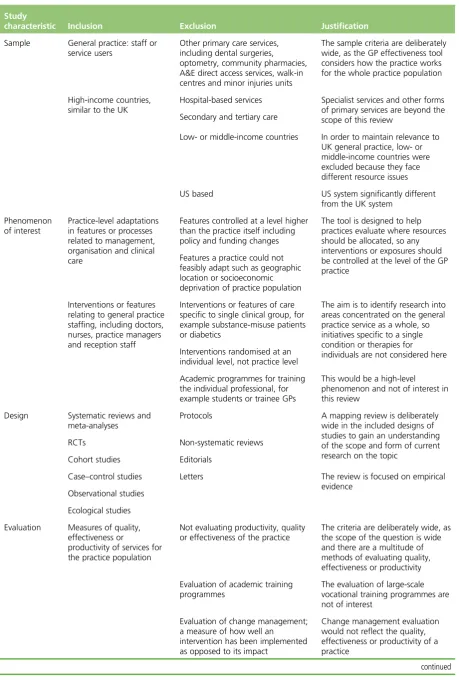
TABLE 3 Eligibility criteria 17
TABLE 4 Themes from phase 1 workshops 38
TABLE 5 Objectives derived from phase 1 workshops 39
TABLE 6 Performance areas and objectives 39
TABLE 7 Performance areas and objectives with weighting 50
TABLE 8 Final version of the GPET 52
TABLE 9 Number of practices that completed data entry for each month of the
pilot study 73
TABLE 10 Association between data completeness and practice characteristics 75
TABLE 11 Changes over time for overall effectiveness points and performance areas 76
TABLE 12 Changes over time for each objective 76
TABLE 13 Practices using each optional indicator 77
TABLE 14 Links between 10 high-impact actions and the GPET 96
TABLE 15 Mapping review quality assessment 128
List of figures
FIGURE 1 Example of a ProMES contingency 12
FIGURE 2 The PRISMA flow diagram 19
FIGURE 3 Classification of study outcomes 21
FIGURE 4 Overall summary of the research design 30
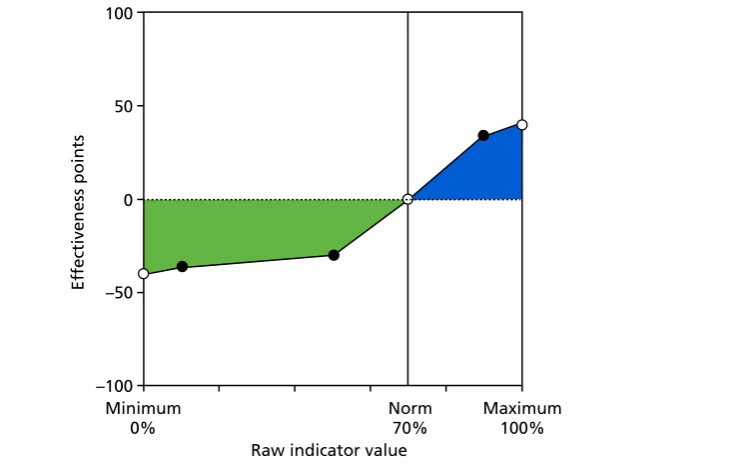
FIGURE 5 An example of contingency in the GPET 35
FIGURE 6 Performance areas and objectives 40
FIGURE 7 Contingencies forclinical careindicators 1.1–1.8a 57
FIGURE 8 Contingencies forclinical careindicators 1.8b–2.6b 58
FIGURE 9 Contingencies forclinical careindicators 2.6c–3.5 60
FIGURE 10 Contingencies forpractice managementindicators 4.1–6.4 61
FIGURE 11 Contingencies forpractice managementindicators 6.5–7.6 63
FIGURE 12 Contingencies forpatient focusindicators 64
FIGURE 13 Contingencies forexternal focusindicators 66
FIGURE 14 Average effectiveness points by month 75
FIGURE 15 Staff interview thematic map 78
FIGURE 16 Performance areas and objectives 95
FIGURE 17 Quality assessment for quantitative studies (n=26) 134
FIGURE 18 Quality assessment for qualitative studies (n=4) 135
Glossary
Allied health professionals Professionals aligned to medicine, excluding nurses. These professionals include arts therapists, chiropodists, dietitians, occupational therapists, orthoptists, paramedics,
physiotherapists, prosthetists and orthotists, psychologists, psychotherapists, radiographers, and speech and language therapists.
Contingencies A term used in Productivity Measurement and Enhancement System for the functions that show how much each score on the indicators is worth in effectiveness points.
EMIS (EMIS Health, Leeds, UK) A clinical system used in some general practices.
Medical Research Council grading Medical Research Council grading scales for clinical conditions.
MIQUEST Queries to extract data from clinical systems.
Preferred Reporting Items for Systematic Reviews and Meta-Analyses An evidence-based minimum
set of items for reporting in systematic reviews and meta-analyses.
PRIMIS A health informatics organisation based at the University of Nottingham.
Qualtrics (Provo, UT and Seattle, WA, USA) Online survey software.
Read codes A structured clinical vocabulary for use in an electronic patient health record.
SNOMED (SNOMED International, London, UK) A structured clinical vocabulary for use in an electronic patient health record.
SPIDER A tool to develop effective search strategies of qualitative and mixed-methods research.
List of abbreviations
BME black and minority ethnic BMI body mass index
CCG Clinical Commissioning Group CHD coronary heart disease CI confidence interval
CMHT Community Mental Health Team COPD chronic obstructive pulmonary
disease
CQC Care Quality Commission CRN Clinical Research Network DDA Disability Discrimination Act DNA did not attend
EPA-Cardio European Practice Assessment of Cardiovascular risk management FFT Friends and Family Test
FTE full-time equivalent GMS General Medical Services GP general practitioner
GPET General Practice Effectiveness Tool ICS integrated care system
IT information technology MDT multidisciplinary team
MIQUEST Morbidity Information Query and Export Syntax
NICE National Institute for Health and Care Excellence
NIHR National Institute for Health Research
OOH out of hours
PMS Personal Medical Services PPG patient participation group PRG patient reference group PRISMA Preferred Reporting Items for
Systematic Reviews and Meta-Analyses
ProMES Productivity Measurement and Enhancement System
QI quality improvement
QOF Quality and Outcomes Framework RCGP Royal College of General
Practitioners
RCT randomised controlled trial SCIE Social Care Institute for Excellence SD standard deviation
SNOMED Systematized Nomenclature of Medicine
SPIDER sample, phenomenon of interest, design, evaluation, research type STP sustainability and transformation
Plain English summary
G
eneral practice is central to the NHS. Despite increasing numbers of older people and people with long-term and multiple conditions, funding has not kept pace. Practices are under increasing pressure to work more productively and in different ways.This study set out to develop a standardised measure of productivity for general practice. The result was the General Practice Effectiveness Tool (GPET). This was developed in 16 workshops with general practitioners, practice staff and members of the public, in addition to wider consultation, although strictly speaking it could not be considered a productivity index.
The GPET comprises four performance areas (i.e.clinical care,practice management,patient focusand external focus) that are covered by 11 objectives, measured by 52 indicators, gathered mainly from existing data.
A total of 51 practices across England were trained to use the GPET. Of these, 38 practices used the tool for multiple months (28 practices used it for the full period), and their data were analysed. The effectiveness of these practices improved moderately, particularly in the areas ofpractice managementandpatient experience. Participants were asked how useful the tool was via 38 telephone interviews, a survey of practice managers and two focus groups with patients. Views were mixed, with just under half of practices finding it useful, whereas some interviewees suggested that they could not spare enough time to use it fully.
Scientific summary
Background
There is a continuing need in the NHS to make the best use of available resources for the best possible outcomes. Despite most initial contacts happening within primary care, systems for measuring the
performance of general practices are extremely limited, with the main mechanism for doing so [the Quality and Outcomes Framework (QOF)] criticised for being too narrow and ineffective; in particular, in recent years the QOF has focused on clinical data at the expense of other areas of practice objectives, such as patient experience or broader public health activity. Similarly, other published indicators (e.g. Care Quality Commission inspection ratings) lack comprehensiveness, regularity or both.
General practice is awash with data, but few are available to help practices assess their performance on an ongoing basis. This project aimed to bridge this gap by developing a measure of productivity for general practices.
Objectives
The main aim of this study was to develop and evaluate a measure of productivity (a ratio of quality-adjusted effectiveness to inputs) that can be applied across all typical general practices in England, and that may result in improvements in practice, leading to better patient outcomes.
The specific objectives were to:
1. develop, via a series of workshops with primary care providers and patients based on Productivity Measurement and Enhancement System (ProMES) methodology, a standardised, comprehensive measure of general practice productivity
2. test the feasibility and acceptability of the measure by piloting its use in 50 general practices over a 6-month period
3. evaluate the success of the pilot, leading to recommendations about the wider use of the measure across primary health care in consultation with key stakeholders at local and national levels.
Methods
Stage 1
that could be used as indicators of these objectives. A further two large-scale workshops, involving 11 practice staff and 27 members of the public, were scheduled to work on developing the contingencies; however, owing to the scope and complexity of general practice, a further six smaller workshops, involving 23 practice staff and 10 members of the public, were added to complete the generation of indicators and development of contingencies. The result of these workshops was an overall measure, the General Practice Effectiveness Tool (GPET).
A consensus exercise was held to check on both the purpose and detail of the GPET. This involved a face-to-face meeting with 16 participants representing the NHS, general practitioners (GPs) and patient bodies, followed by two online surveys, which had 27 respondents, including eight GPs.
As some of the indicators were to come from clinical systems, we then worked with the PRIMIS team at the University of Nottingham to develop standardised queries that could be automatically run by practices each month to extract the relevant indicators. The GPET was converted into an online platform that would allow practices to enter all their indicators on a monthly basis and get an automated feedback report. Stage 2
The second stage of the study aimed to test the feasibility and acceptability of GPET by piloting its use with a range of practices over a 6-month period, and to evaluate how successful this pilot was.
A total of 51 general practices from 18 Clinical Commissioning Group (CCG) areas in several regions agreed to participate and received face-to-face training in using the GPET, together with a detailed manual on using the online system. These practices were then expected to use the measure over the next 6 months, entering data on each indicator each month, with data coming from a variety of sources, but predominantly existing already. Each month, a feedback report on each indicator, objective and overall effectiveness would be produced, and practices were encouraged to discuss these, for example in a practice’s team meetings. The data entered were tracked centrally by the research team and analysed for completeness of data entry (using descriptive statistics) and for change over time (using multilevel growth modelling). In addition, various practice characteristics were tested for associations with both completeness and change. The main evaluation of the feasibility and acceptability of the GPET was accomplished via a telephone interview with a representative from each practice, as well as an online questionnaire sent to the practice manager. The interview and questionnaire both asked about overall perceptions of the GPET, including its content, usability and usefulness, and examined specific areas within it. The practice manager questionnaire also asked for monthly financial data to enable the construction of a more traditional productivity index. In addition, telephone interviews were held with four patient representatives, and seven other patient representatives participated in focus groups, to establish whether or not the GPET was appropriate and useful from a patient perspective.
Results
Stage 1
The first phase of workshops revealed nine separate objectives of general practices. Subsequently, one of these (better clinical care) was judged to be too broad for a single objective and, so, was split into three different objectives.
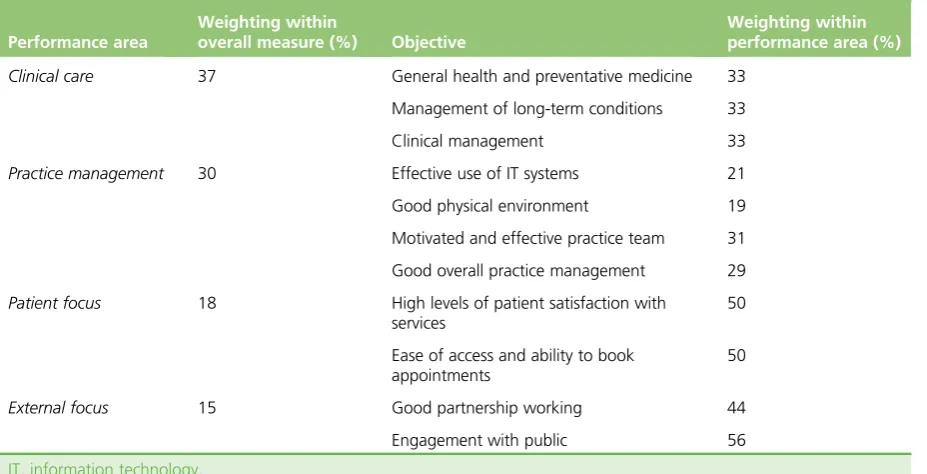
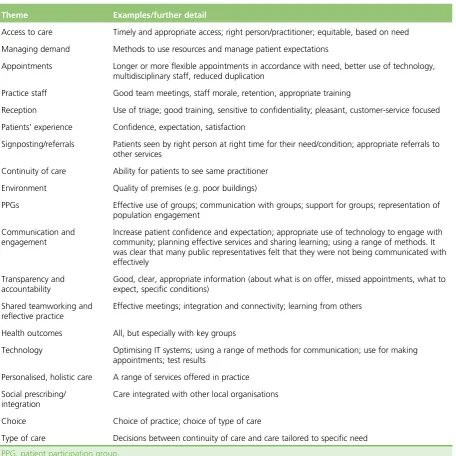
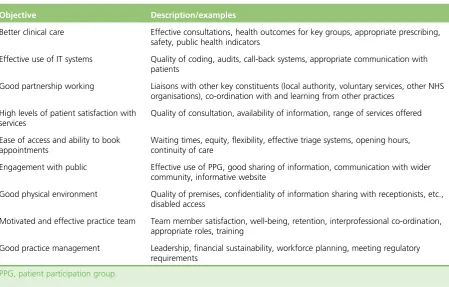
Because of the large number (n= 11) of objectives produced compared with usual ProMES exercises (4–6 is typical), these objectives were organised into four‘performance areas’that form an extra level between the objectives and overall effectiveness. The four performance areas and 11 objectives are presented inTable a (shown also with the weighting each area was given from subsequent workshops and the consensus exercise).
SCIENTIFIC SUMMARY
TABLE a Performance areas and objectives of general practices
Performance area
Weighting within
overall measure (%) Objective
Weighting within performance area (%)
Clinical care 37 General health and preventative medicine 33
Management of long-term conditions 33
Clinical management 33
Practice management 30 Effective use of IT systems 21
Good physical environment 19
Motivated and effective practice team 31
Good overall practice management 29
Patient focus 18 High levels of patient satisfaction with
services
50
Ease of access and ability to book appointments
50
External focus 15 Good partnership working 44
Engagement with public 56
IT, information technology.
A large range of indicators was suggested for many of these objectives, although for some (particularly in theexternal focusperformance area), identification of appropriate sources of data that would be available to all practices was harder. In total, 52 indicators were agreed across the workshops to measure these 11 objectives:
l 19 of the indicators were gathered from clinical information systems, with Morbidity Information Query and Export Syntax (MIQUEST) queries developed to extract these data automatically from EMIS (EMIS Health, Leeds, UK) and SystmOne [The Phoenix Partnership (TPP), Leeds, UK]
l 14 indicators came from practice records (including staff records, minutes of meetings, attendance records, etc.)
l 15 indicators were based on checklists (questionnaires) answered by the data inputter (each includes several yes/no questions)
l 3 indicators came from patient views, collected as part of an enhanced regular Friends and Family Test (FFT)
l 1 indicator came from a very brief (five-item) questionnaire administered to practice staff.
An additional 10 indicators were thought to be potentially useful, but it was recognised that most practices would not have the data readily available. These were therefore left as optional indicators that practices could choose to use if they wanted to, but that would not contribute to the overall effectiveness score. The consensus exercise workshop gave a clear steer that the most useful aspect of the GPET would be to enable practices to monitor and improve their own performance across time, as it was thought that differences between practice populations and local commissioning arrangements would make a direct comparison in scores between practices unfair from a performance management point of view. However, the ability to track data within practices over time was felt to be a very positive attribute. The online survey part of the consensus exercise enabled some refinement of indicators and contingencies, and suggested the weightings for each performance area and objective, as seen inTable a.
Stage 2
51 practices (55%) managed to use the GPET as it was fully intended. Of those that did not participate fully, the most common reasons were a lack of time and changes in practice personnel, making participation difficult. In particular, 13 indicators were found to be problematic for data gathering, meaning that even among those practices that did fully participate, not all managed to complete every indicator. The extent of participation was not associated with most practice characteristics examined, although there was a greater level of participation from practices that had participated in stage 1 and from those practices using the EMIS clinical system, which was likely to be because these practices were trained first.
There was evidence that, over the course of the 6-month pilot, practice effectiveness increased significantly. Specifically, each month, the increase was estimated to be 1.3% of the total effectiveness points, or a standardised effect of 0.09 (p= 0.01). There were significant increases in both thepractice management andpatient focusperformance areas, and for each objective within these areas except forgood physical environment. Although the level of change was not linked to most of the practice characteristics, there was some evidence that larger practices were likely to observe greater levels of improvement (p= 0.02). Although this tallies with previous ProMES research that has shown improvements in performance, it cannot be known whether or not this improvement is due to the use of the GPET as there was no control group, and other factors (e.g. time of year) may have contributed to improved performance.
The practice staff interviews and practice manager questionnaire both gave clear indications that there was a wide variety of perceptions of the GPET. Practice managers rated it, on average, 4.5 out of 10.0 for usefulness, suggesting that just under a half found it useful. Forty-nine per cent of respondents to the practice manager questionnaire said that there were difficulties gathering certain indicators (with five indicators highlighted as being problematic), 27% said that there were difficulties with entering data and 29% said that there were difficulties with getting used to the online system (factors that might be inherently improved with some further development of the tool). Most practice interviewees (66%) indicated that it had taken more time to use than they had anticipated. However, 40% said that they would like to keep using it if they had the chance, and 41% had had discussions about the results in team meetings. There was a consensus that the areas covered by the GPET were appropriate, and there were no clear omissions. These findings were similar for the patient representatives.
Unfortunately, most practices were unable to provide sufficiently detailed monthly financial data, which meant that it was not possible to generate a more conventional productivity index using inputs (i.e. financial expenditure) as a denominator.
Conclusions
Implications for health care
The different stages of this study have different implications. One aspect of the study that seemed highly successful was the development of a model for evaluating the effectiveness of general practices. The model devised in the stage 1 workshops, comprising four performance areas (i.e.clinical care,practice management,patient focusandexternal focus) covering 11 objectives, was found to be appropriate and comprehensive, not only in the initial workshops, but also in both parts of the consensus exercise, in both methods of evaluation of the pilot practices and by additional evaluation with patient representatives. This model could serve as a basis for measuring effectiveness in general practice more widely, whether or not it is using the indicators developed for the GPET.
In particular, as the NHS prepares to adapt or replace the QOF, this may provide one model that allows multiple aspects of general practice activity to be considered in future developments, including good practice management, high levels of patient satisfaction, working more widely to ensure joined up working with other agencies, and a broader focus on public health. This could also apply to any models for general practice used by other agencies, including CCGs and integrated care systems.
SCIENTIFIC SUMMARY
There is initial evidence to suggest that the GPET could, with some refinement, be used as an improvement tool for practices. There was clearly an appetite for such a tool in many practices. The fact that there were improvements in effectiveness shown over a small number of months points to the potential benefits of using the tool itself, and also to the tool’s sensitivity for detecting change. However, there are also limitations of this research. In particular, the GPET cannot provide a fair comparison between practices, which was one of the original objectives, and also, the tool does not measure productivity in its traditional sense. Furthermore, the research was conducted in a relatively small number of self-selecting practices, and there was no control group.
Recommendations for research
First, it is recommended that some additional research is conducted to refine the GPET by updating indicators produced from clinical systems to the new Systematized Nomenclature of Medicine (SNOMED) codes (introduced since the study), by refining other problematic indicators either via clearer guidance on data collection or alteration of the indicator itself, and by improving the online system so it is easier for practice staff to use.
Second, an enhanced testing of the tool is also recommended by comparing its use in practices receiving feedback with a control sample of practices that do not view the results of their performance. This would enable a test of the hypothesis that it is specifically the use of the tool that has led to improvements in performance.
Third, it is suggested that this study provides supporting evidence of the usefulness of the large-scale ProMES process, and that future research considers this as a possible approach for measure development in the NHS.
Funding
Chapter 1
Introduction and background
Introduction
This report describes a study aimed at designing a measure of productivity for general practices providing NHS services in England. It uses a two-stage process of developing a measure [using the Productivity Measurement and Enhancement System (ProMES)] and then testing and evaluating the measure’s use in a range of general practices. In this chapter, the context for the measure is introduced, including the role of general practice and what measures are currently available, and then the study aims and objectives are outlined.
The context of general practice in England
Since the formation of the NHS in 1948, general practitioners (GPs) have always existed on the periphery of the main NHS structure, in the sense that the majority are not employed directly by NHS organisations, but are either independent contractors, being partners in small businesses (general practices) that receive payments for providing NHS services, or employed by such practices. General practices are a key element of the provision of primary care, which can be defined as the first point of contact for health care for most people, mainly provided by GPs, but also by community pharmacists, opticians and dentists.1GPs do not
work in isolation, but generally in multidisciplinary teams (MDTs) comprising nurses, allied health professionals and other clinical and administrative staff. Critically, GPs often act as the gatekeeper to other NHS services, and provide key links to other parts of the health and social care system.
Each general practice has a list of patients for whom it provides primary medical services, including (but not limited to) patient-led consultations with GPs, practice nurses and other clinical staff; prescriptions;
treatment for certain ailments; referrals to specialists; screening and immunisations; management of long-term conditions; and health promotion. The variety and scope of tasks undertaken by general practices is huge, and in recent times there has been greater encouragement towards integrated care, and to prevention rather than cure.2The nature of the employment relationship, however, in addition to the variety and complexity of
the task performed by GPs in providing primary care, means that even defining productivity and effectiveness, let alone collecting data to measure such concepts, is far from straightforward.
Since 2004, there have been two major changes in the management of primary care provision in England that have had significant implications for both the role of the general practice and the data available. First, in 2004, new GP contracts were introduced: the General Medical Services (GMS) contract, used by ≈60% of practices, and the Personal Medical Services (PMS) contract, used by≈40% of practices.3The
funding methods are not straightforward, but depend on a combination of core payments for delivering essential services to registered patients, and various additional payments for meeting particular targets and delivering enhanced services (which may be commissioned locally). In particular, a major route for determining extra payments is the Quality and Outcomes Framework (QOF), which will be discussed in greater detail inOverview of measurement of productivity and effectiveness in general practice.
The other significant recent change is the Health and Social Care Act 2012,4which led to the creation of
many general practices have sought to improve efficiency and manage demand better by developing networks or federations including multiple practices. These would typically share some services, but, again, the extent and formality of this arrangement will vary from one network to another. Some practices are owned by a parent company; typically, such companies will employ GPs and other staff working within their practices.
The role of general practice within the NHS is paramount. It has been estimated that≈90% of NHS contacts take place in general practice.3As of December 2017, there are 6601 general practices on either
GMS or PMS contracts within England, covering over 58 million registered patients. There are a total of 41,817 GPs, with a full-time equivalent (FTE) of 33,782 GPs. One year previously, these numbers were 41,589 GPs and 34,126 FTE GPs. As of March 2017, there were 132,430 other staff employed by general practices (90,984 FTE), including 22,737 nurses (15,528 FTE), 17,585 other clinicians involved in direct patient care (11,413 FTE), 11,147 practice managers or management partners (9784 FTE) and 81,258 other administrative and non-clinical staff (54,259 FTE).6–8
At the same time, general practice is facing unprecedented challenges.9The number of people aged ≥65 years is increasing sharply in all areas of the country, and the number of people with long-term conditions, most which are managed within general practice, is increasing. The number of consultations in general practice between 2010/11 and 2014/15 grew by over 15%, whereas funding has remained relatively stable, placing practices under massively increasing pressure. In conjunction with a workforce that is failing to keep up with rising demand, this suggests that an emphasis on productivity, efficiency and effectiveness is needed.10TheGeneral Practice Forward View,11discussed more fully in the next
section, provides some processes setting out how this may be achieved. Improving access in order to improve outcomes for some patient groups is a priority and new data from the British Social Attitudes survey12published in February 2018 has shown that public satisfaction with the services provided by GPs
is at its lowest level since the survey began in 1983.13,14
Overview of measurement of productivity and effectiveness in
general practice
Productivity and effectiveness are terms that are used in myriad ways. A classical definition of productivity is simply the ratio of outputs to inputs, and is often defined in simple financial terms. However, in health care this definition is not sufficient–the simple measurement of financial outputs does not usually take account of the quality of care delivered. Productivity in health care should measure‘how much health for the pound, not how many events for the pound’.15Therefore, a definition often used within health is ‘the ratio of outputs to inputs, adjusted for quality’.16(Reproduced from Applebyet al.16© The King’s Fund
2010. This is an Open Access article distributed in accordance with the terms of the Creative Commons Attribution (CC BY-NC-ND 4.0) license, which permits others to copy and redistribute the work, provided the original work is properly cited. See: https://creativecommons.org/licenses/by-nc-nd/4.0/). However, the nature of this adjustment is a matter of debate: it is not generally possible to assess the financial effects of quality directly, as to do this would require assessment of the services’marginal contributions to social welfare,17and identifying and isolating these contributions would be difficult if not impossible (although,
in principle, identifying the financial inputs should be easier).
Although attempts have been made to measure quality-adjusted outputs directly (e.g. Dawsonet al.18
and Castelliet al.19), these have tended to focus on secondary care, and do not generally account for the
wide range of potential data, but instead rely on routinely collected outcome data. Quality can refer to a mixture of things, including health outcomes, safety and patient experience. Here, it is argued that, particularly for primary care, the full extent of quality cannot be measured without taking into account a broader set of indicators, for example the views of patients.20
INTRODUCTION AND BACKGROUND
Given the importance of primary care and general practice within the NHS more widely, it is perhaps surprising that there have not been more attempts to provide a more specific definition and measurement of productivity–or other forms of performance, such as effectiveness–that can be applied at the practice level. There have, however, been various attempts to capture the performance of general practice for other, more specific, purposes.
The widest-known current method for assessing general practice outputs is the QOF. This sets payments to practices based on their activity against a number of indicators across two principal domains. Practices report on their performance on these indicators in accordance with clearly defined criteria; each indicator has a different weighting, so that the total QOF score is composed of a weighted sum of all the indicators together. Specifically, in 2017/18, there were 63 clinical indicators (across 19 specific clinical conditions or groupings of condition) and 12 public health indicators.21
Despite the growing demands of a larger population, more older people and more people with multiple chronic conditions requiring management in primary care, the share of NHS spending on general practice has fallen in recent years. There are plans to redress this problem, and in April 2016 NHS England announced a 5-year plan to increase investment in general practice.11The funds allocated to each practice each year
include a global sum calculated to adjust for workloads and features of the patient population (age, morbidity, mortality, population turnover), and pay for performance elements made up of the QOF and enhanced services, some of which may be determined locally. On the basis of these payment streams, in 2014–15 practices received a median of £105.79 (interquartile range £96.35–121.38) per patient. In recent work,22however, it has been shown that population factors related to health needs were, overall, poor
predictors of variations in adjusted total practice payments and in the payment component designed to compensate for workload.
The precise content has varied from year to year. Notably, all of the‘quality and productivity’indicators and the one‘patient experience’indicator from earlier years were discontinued from 2014/15 onwards, giving the impression that only clinical outcomes, rather than other areas of effectiveness and patient experience, are being prioritised. QOF has been criticised for many reasons, including being arbitrary in its setting of targets, being influenced by contractual negotiations, being subject to regular changes and creating tensions between patient-centred consulting and management.23,24These arguments will be
expanded in the next section, which reviews the literature on the topic. Other output measures, such as those used by the Office for National Statistics (ONS) and the National Institute for Health and Care Excellence (NICE), likewise do not cover all activity or focus on a different level (e.g. the NHS Outcomes Framework, which focuses on the CCG level).25
The importance of primary care quality is further indicated by the fact that the Care Quality Commission (CQC) now inspects general practices, including out-of-hours (OOH) services. These inspections ask the key questions about whether or not services are safe, effective, caring, responsive and well led. This brings together quality and safety, but does not directly address productivity, and leads to a broad-brush rating at one of four levels between‘inadequate’and‘outstanding’.26
Performance measurement: literature review
Overall performance measurement
The measurement of performance in health care has long been a contentious issue. The pressures of competing priorities mean that there is often no consensus over the definition of what constitutes high-quality performance.28In health systems that operate for profit, profitability of a unit may provide
one suitable measure of performance; however, in the NHS and other systems that do not operate on a for-profit basis, the measurement of financial performance is both more complex and less appropriate. To capture overall performance in health care (whether of a single organisation or the system as a whole), a range of different indicators is undoubtedly necessary. Often these will take the form of a‘balanced scorecard’ –a set of measures designed to capture all the main areas of performance. For example, areas covered may include indicators relating to patient health, mortality, safety, patient satisfaction and the extent to which targets are met. The precise types of measures will depend on the context and nature of the units being studied; however, there should certainly be alignment between the objectives of the unit and the measurements used.29,30
Productivity is a particularly difficult area of performance measurement. It is always a challenge for health-care providers and administrators to be able to produce as much as possible with the resources available. In the NHS, for example, the Wanless report31identified that in future years the NHS would need
to be able to make better use of its resources in order to maintain the same level of service–and that was at a time of relative prosperity and growth in the NHS. In times of relative austerity and uncertainty, the necessity becomes even greater.
A classical definition of productivity is simply the ratio of outputs to inputs, and is often defined in simple financial terms. However, in health care this definition is not sufficient: the simple measurement of financial outputs does not usually take account of the quality of care delivered. The most common definition used in health care is the ratio of outputs to inputs, adjusted for quality.
Although attempts have been made to measure quality-adjusted outputs directly, these have tended to focus on secondary care, and do not generally account for the wide range of potential data, but instead prefer routinely collected outcome data.18,19Quality can refer to a mixture of things, including health
outcomes, safety and patient experience. It seems evident that, particularly for primary care, the full extent of quality cannot be measured without taking into account the views of patients.20
Performance measurement in primary care
Primary care in general (and general practice in particular) covers a huge range of activity, with practitioners needing a wide enough scope of knowledge to be able to deal with all presenting problems, whether these are dealt with directly within the primary care setting or referred on to secondary care or other services.2,32
Some models of overall primary care effectiveness do exist, although they do not focus on productivity, and are not geared towards the NHS situation in particular. However, the dimensions identified by Kringoset al.33
in particular (i.e. primary care processes determined by access in addition to continuity, co-ordination and comprehensiveness of care, and outcomes determined by quality of care, efficiency of care and equity in health) give a useful benchmark for comparison.
The role of the GP within this setting is key to its success, and the nature of the consultation between GP and patient has itself been the subject of much scrutiny, particularly with regard to its potential to explore broader health concerns than that initially presented by the patient. For example, Stott and Davis34presented
a four-point framework to help GPs achieve greater breadth in consultations, covering management of presenting problems, modification of help-seeking behaviour, management of continuing problems and opportunistic health promotion. By engaging in all four of these aspects, rather than merely dealing with the primary issue, GPs can seek to improve general health and avoid future concerns. Mehay35went further than
this, describing 15 separate models of doctor–patient consultation, and Pawlikowskaet al.36undertook an
INTRODUCTION AND BACKGROUND
analysis of a variety of consultation types. Although they36did not advocate any one particular model, their
analysis suggested some key themes including establishing a rapport, appropriate questioning style, active listening, empathy, summarising, reflection, appropriate language, silence, responding to cues, patient’s ideas, concerns and expectations, sharing information, social and psychological context, clinical examination, partnership, honesty, safety netting/follow-up and housekeeping. In particular, Pawlikowskaet al.36
concluded that excellent communication skills alone are not enough. In general, GPs also have a key role in managing patients’uncertainty, and act as a key operator at the boundary between different agencies.37
With this in mind, the measurement of performance in general practice needs to embrace this complexity and reflect the broad activity undertaken by GPs and other practice staff, including the work of practice nurses and other clinicians working under the umbrella of the general practice; however, this is far from straightforward. One attempt to do so is the provision of profiles of general practices by Public Health England. However, these include only certain areas of performance and are updated infrequently. A 2015 review38conducted by the
Health Foundation examined indicators that were then in use in the NHS. Although there were a multiplicity of sources of indicators available, the over-riding conclusion was that the accessibility of these indicators was poor, particularly from the patients’perspective. Considering that the rationale for publication of indicators may include improvement, patient choice/voice, and accountability, it recommended that a single web location be developed to provide access to these indicators (rather than relying on very different web sources, such as NHS Choices, CQC ratings, MyNHS, Public Health England and NHS Digital), but, even then, there would be significant areas of performance that were not covered by reliable indicators. The review also suggested that composite indicators should not be developed and gave six reasons for this: (1) aggregation masks aspects of quality of care, (2) it was suggested that a composite index would provide little value over and above the CQC ratings, (3) patients and service users are not a homogeneous group, (4) any selection and weighting of indicators would be highly contentious, (5) the number of robust indicators available is extremely small and not comprehensive and (6) there would not be enough detail for professionals to pinpoint areas for improvement.38
Some of these arguments are more persuasive than others. It is certainly true that aggregation can mask specific aspects of care, but this does not imply that overall performance is not a meaningful concept. In particular, if an overall performance index can be developed that also allows examination of specific areas within it, it could service both needs. We disagree that no value can be added to the CQC ratings with other composite indicators; as discussed later in this section, CQC inspections (leading to ratings) are made too infrequently and do not offer the detail that could be given by a more comprehensive index. It is also true that patients and service users are a very varied group, and any attempt to measure overall performance of a practice should not imply that the performance is the same for all groups. The contentious nature of the choice of indicators, particularly in the light of the small number of robust indicators, is a critical issue. This suggests that any specific choice of indicators might favour one type of practice over another. The difficulty of balance in performance measurement is something discussed by multiple authors.39–41For this reason, any
overall performance index may not be so useful as a direct comparison between practices, but instead as a longitudinal tracker within practices–more as an improvement tool than a performance management tool. Baker and England42have presented a framework covering many of these outcomes: both final outcomes
One of the greatest challenges for general practice is in the effective allocation of resources. A 2017 study by Watsonet al.43used a value-based health-care framework to propose how resources can be
allocated more effectively. As well as quality, safety, efficiency and cost-effectiveness, it includes optimality (balancing of improvements in health against cost of improvement). Optimality requires evidence and shared decision-making with individual patients. The authors argue that primary care has an essential role in delivering optimality and, therefore, value. However, they also point to the lack of readiness currently within the primary care system:‘primary care measurement systems need to be developed to generate data that can assist with the identification of optimality’.43Of interest, among its suggestions for things to
do more/less of, it suggests fewer health checks and fewer unnecessary appointments. It does, however, recommend more social prescribing, more patient self-care, better integration of services and a higher overall allocation of resources into primary care.
This is closely tied to the area of efficiency, which has had its own section of literature within health care generally and primary care in particular. Of particular note here is the work using data envelopment analysis, which uses multidimensional geometric methods to compare the inputs and outputs of a unit and to establish a comparative index of efficiency. In particular, Peloneet al.44–46have undertaken to do this in different
primary care settings. However, this method is simply one of using other indicators to create a composite measure of efficiency (or productivity); it does not calculate a specific index, but instead depends on the comparability of units. Therefore, the choice of appropriate indicators is still of paramount importance. The nature of primary care means that a certain number of clinical and patient activity indicators are inevitable, and these should cover as many of the major conditions and patient types as possible, including public health priorities. However, there are other, more general areas that also need to be considered. One of these is patient safety. However, patient safety within primary care is not something that is measured in any standard form. Lydonet al.47conducted a systematic review of measurement tools for the proactive assessment of
patient safety in general practice. Of the 56 studies identified by this systematic review, 34 used surveys/ interviews, 14 used a form of patient chart audit and 7 used practice assessment checklists; there were a handful of other tools that were not repeated across studies. Nothing was discovered that was either
commonplace or appropriately sophisticated. Similarly, Hatounet al.48undertook a systematic review of patient
safety measures in adult primary care. They found 21 articles, including a total of 182 safety measures, and classified these into six dimensions: (1) medication management, (2) sentinel events, (3) care co-ordination, (4) procedures and treatment, (5) laboratory testing and monitoring and (6) facility structures/resources. However, the types of measures were not dissimilar to those found by Lydonet al.47An earlier review
by Ricci-Cabelloet al.49undertook a similar exercise and reached similar conclusions (albeit on a smaller
scale). Therefore, the inclusion of patient safety within a broader index will pose a significant challenge. It also seems important, following on from the Baker and England42and Dixonet al.38frameworks, that the
experience of the patient is given a key place within any overall index. Patient satisfaction and experience measures are commonplace in health care, but are used to a different extent in different scenarios; in the NHS, routine data collection is common, with the annual GP patient survey and all practices using a (minimal) Friends and Family Test (FFT) on an ongoing basis, as well as gathering qualitative feedback via patient reference groups (PRGs). Moreover, the advent of technology has started to change how these data are collected. A recent National Institute for Health Research (NIHR) Programme Grants for Applied Research study examined patient survey scores in detail, aiming to understand the data and how general practices respond to low scores, looked at some specifics [e.g. black and minority ethnic (BME) patient scores and OOH care] and carried out a randomised controlled trial (RCT) of an intervention to improve patient experience. This intervention involved real-time feedback via a touchscreen on exit; encouragement of patients boosted response rates hugely. The major conclusions were that a variety of feedback mechanisms should be used, and certainly not reliance on postal surveys. In addition to satisfaction with the care provided, access is a key issue for patients, but it is increasingly under pressure.50
Overall, a wide variety of measures of performance have been used in general practice settings (both in the NHS and elsewhere), and these continue to evolve without there yet being much in the way of definitive
INTRODUCTION AND BACKGROUND
best practice. However, it is important to consider next what is currently used in the NHS at a national stakeholder level, and to determine in what ways these do and do not satisfy the needs of practices, patients and other stakeholders.
General practice performance in the NHS
As with much of the NHS, there has been significant emphasis on measuring performance in primary care, even though this is sometimes less straightforward than for other parts of the service (such as the acute sector). Since the introduction of the GMS and PMS contracts for general practice in 2004, the main vehicle for measuring the performance of practices, and for determining at least part of the payments due to practices, has been the QOF.
Under the QOF, each practice needs to submit data annually as evidence of how they are meeting various targets. Detailed rules are provided about how each score should be calculated, with most being derived directly from clinical information systems. For example, one of the indicators under the area‘secondary prevention of coronary heart disease (CHD)’is the percentage of patients with CHD in whom the last blood pressure reading (measured in the preceding 12 months) was≤150/90 mmHg. This percentage, which can be extracted using a specific query from the practice’s clinical system, is worth up to 17 points (out of a possible 45 points for the domain, or 558 QOF points in total) and is maximised when the percentage is between 53% and 93%. The sum for all 77 indicators (across 25 areas in two domains) is calculated for a practice and this is converted to a payment made to the practice as part of their overall funding. Thus, the financial incentive for practices to perform well on QOF is strong.
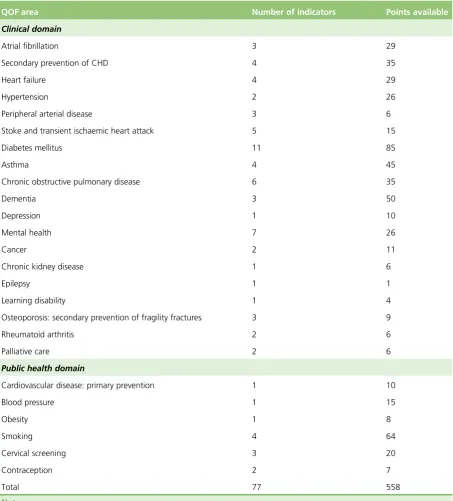
In one sense, therefore, this already provides an overall index of performance for a practice. However, the content of the QOF indicators is a matter of some contention.Table 1summarises the domains, areas and indicators in use in the NHS year 2017/18, although this detail has changed somewhat over the years. Originally, the QOF indicators were developed by the Department of Health and Social Care, with a total of 146 indicators across four domains: clinical, organisational, patient experience and additional services. Since 2009, the changes made to the QOF have been the responsibility of NICE. As with much of NICE’s work, this was supposed to ensure that decisions were based on a strong evidence base. However, within general practice this is not always straightforward, and the evidence (or lack of evidence) underlying changes to QOF scores has been criticised as relying too much on expert opinion.52
In particular, there have been major changes to the structure of the QOF. Of the initial four domains, the clinical domain has been substantially expanded, but the organisational and patient-experience domains have been removed, principally because of a lack of good-quality data in these areas, rather than because of a perceived lack of importance. This, therefore, represents a significant weakness within the current QOF; it is often perceived as being imbalanced (either in terms of what is perceived as most important or in terms of the actual work of general practices).53In addition, and probably less controversially, the additional
services domain has been subsumed within a broader public health domain.
Even more contentious, however, is the effectiveness of the QOF as an index and its usefulness as a methodology. This has attracted a substantial level of research and comment in recent years. Forbeset al.54
undertook a review of research examining the effects of the QOF. They found that the introduction of the QOF was associated with a modest slowing of both the increase in emergency admissions and the increase in consultations in severe mental illness, and modest improvements in diabetes mellitus care. However, there was no clear evidence of causality. Furthermore, there was no evidence of any effect on mortality, on integration or co-ordination of care, on holistic care, self-care or patient experience. The work of this research team in the field of CHD confirms the lack of evidence of an effect on mortality and offers a potential explanation in that the QOF has concentrated clinical attention on the management of patients with diagnosed conditions instead of a population approach to primary care that actively identifies patients with undiagnosed conditions.55Specifically, levels of detection of hypertension predict premature mortality,
Marshall and Roland57argued that the QOF is highly divisive and has become increasingly unpopular
with GPs. Using financial incentives has diverted focus from the interpersonal elements that are important in consultations, and care for single diseases has been prioritised over holistic care. Their review57of
[image:37.595.82.536.93.595.2]observational studies suggested that there had been modest improvements in some areas and a small decrease in emergency admissions in the incentivised areas, but no overall effect on patient mortality. Counterbalancing the limited evidence of improvements is a rising administrative workload associated with the QOF. They conclude that although the QOF may have had some benefits, it has failed to achieve what was intended in terms of driving improvements in health.57In a similar vein, Ryanet al.58performed TABLE 1 The 2017/18 QOF domains, areas, numbers of indicators and points available
QOF area Number of indicators Points available
Clinical domain
Atrial fibrillation 3 29
Secondary prevention of CHD 4 35
Heart failure 4 29
Hypertension 2 26
Peripheral arterial disease 3 6
Stoke and transient ischaemic heart attack 5 15
Diabetes mellitus 11 85
Asthma 4 45
Chronic obstructive pulmonary disease 6 35
Dementia 3 50
Depression 1 10
Mental health 7 26
Cancer 2 11
Chronic kidney disease 1 6
Epilepsy 1 1
Learning disability 1 4
Osteoporosis: secondary prevention of fragility fractures 3 9
Rheumatoid arthritis 2 6
Palliative care 2 6
Public health domain
Cardiovascular disease: primary prevention 1 10
Blood pressure 1 15
Obesity 1 8
Smoking 4 64
Cervical screening 3 20
Contraception 2 7
Total 77 558
Note
Source: NHS Digital.51© 2018, NHS Digital.51Contains public sector information licensed under the Open Government
Licence v3.0.
INTRODUCTION AND BACKGROUND