SOME PHYSIOLOGICAL AND ENVIRONMENTAL FACTORS LIMITING THE YIELD OF SOYBEAN
by
Ross Gary Woodward M.Sc. Agr. (Univ. of Sydney)
A thesis submitted to the
Australian National University for the degree
of
Doctor of Philosophy
2. CERTIFICATE OF ORIGINALITY
The text of this thesis contains no material which has been accepted as part of the requirements for any other degree or diploma in any University or any material previously published unless due reference to this
material is made. I was given much advice and aid by many people who are acknowledged elsewhere. All research was planned and performed by myself except those experiments described in Section C and Appendix II which were done in collaboration with Dr H.M. Rawson, CSIRO, Division of Plant Industry; however, all planning of these experiments, design and assembly of equipment, and analysis and interpretation of data was done jointly and equally.
3. ACKNOWLEDGEMENTS
I wish to thank Dr J.E. Begg, Principal Research Scientist,
Division of Plant Industry, CSIRO, and Dr M.J. Aston, Lecturer, Depart
ment of Botany, A.N.U., for their advice in planning and conducting the
research reported here, for commenting on drafts of this manuscript, and
for supervising my study for this degree. I would also like to thank Dr
H.M. Rawson, Research Scientist, Division of Plant Industry, CSIRO, for
his helpful advice, for the invitation to collaborate with him and for
his valuable comments on drafts of this manuscript.
I would like to express my sincere appreciation to Dr R.J. Mill
ington, Chief, Division of Land Use Research, for permitting me to
conduct this research at CSIRO, and for supporting the entire program.
1 have benefited in many ways from contact with scientists and others in
this Division, and I express my appreciation to these people for their
cheerfully given advice and help and especially to-Mr Tony Swan for
maintaining the electronic equipment and building some of the items;
Ms. Kay Haszler, for computing aid, especially with paper tapes; Ms.
Iris Aldridge and Dr D. Byth (University of Queensland) for chemical
analyses of the soybean seed; Mr Ross Cunningham (Division of Mathematics
and Statistics) for statistical advice; Personnel of the Potting Shed
for their knowledgeable and efficient glasshouse services; Ms. Margaret
Mills, Divisional Editor, and her staff for valuable assistance in the
production of this thesis.
To Dr D.R. Laing, Senior Lecturer, Department of Agronomy,
University of Sydney, I owe gratitude for stimulating my interest in the
soybean before it reached its present status in Australian agriculture
5. TABLE OF CONTENTS
Page
Title Page 1
Certificate of Originality 2
Acknowledgements 3
Summary 6
Introduction 9
Review of Literature concerning the factors limiting the 13
yield of soybean under various environments
Section A: The effect of water deficits on photosynthesis, 30
stomatal behaviour and yield of soybean
Section B: Photosynthesis and expansion of leaves of 58
soybean grown in two light regimes
Section C: Photosynthesis and transpiration of expanding 70
and senescing leaves of soybean
Section D: The effect of atmospheric humidity on the 91
yield of soybean
General Discussion 111
Bibliography 121
Appendix I: Description of the apparatus for measuring 135
net fluxes of CO^ and R^O in leaves and the methodology for calculating the fluxes and diffusive resistances in the leaves
Appendix II: Photosynthesis and transpiration of 147
6. SUMMARY
A review of the literature concerning the growth and develop
ment of the soybean plant
(Glyoine max
(L.) Merrill) showed that photosyn- thate production would probably limit the yield of beans under idealgrowing conditions and that plant water deficits would probably be a
common limitation to the attainment of high bean yields in the Australian
environment. Some aspects of these factors were studied on soybean
plants of cultivar Lee which were grown in controlled environments.
Leaf photosynthesis and transpiration were determined during the expansion
and senescence of leaves on plants at various stages of development
growing under different light regimes, and the influence of sink size on
photosynthesis and transpiration was examined. The response of the
plant to a reduced water supply or an increased atmospheric demand for
water was also examined.
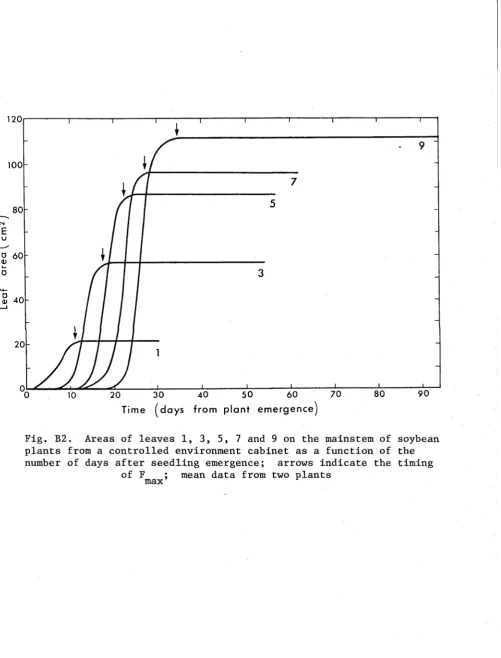
Maximum photosynthetic rates, final leaf areas and leaf dur
ations increased for successive leaves up to the ninth node on the
mainstera but were similar for leaves from equivalent nodes on plants
grown under different irradiance levels. Net photosynthesis and trans
piration per unit area of soybean leaves reached a maximum at approxim
ately the same time as the lamina reached full expansion and then declined
The fluxes of both carbon dioxide and water followed similar patterns
through all stages of leaf development. Later peaks occurred in photo
synthesis and transpiration which appeared to be related to flowering
and pod filling and an increased requirement for assimilate at these
stages. This behaviour contrasted with that of tobacco leaves where a
rapid decline in photosynthetic rates before the leaf was fully expanded
7
.Net photosynthesis and transpiration of leaves on podded and partially depodded soybean plants were similar, and a hormone control system for photosynthesis which is partially independent of sink size is suggested. The stomatal and mesophyll (residual) resistances to gaseous diffusion
behaved similarly through all stages of leaf development. Both resistances
were high when the leaf was expanding or senescing and photosynthesis was low, and both were at a minimum when photosynthesis was high;
possible mechanisms of this linkage are discussed. The mesophyll resist
ance was always the largest resistance.
A low atmospheric humidity during growth significantly reduced the bean yields of well watered plants, primarily as a result of reduced
numbers of pods. Low humidity also reduced the dry weights of stems and
leaves and the number of nodes on the mainstem, compared to plants grown
at a high atmospheric humidity. However, the oil and protein contents
of the seed were not affected by humidity levels. The results are discussed in terms of stomatal responses to humidity and leaf water deficits and
reduced photosynthesis at the lower humidity. For plants grown in a
glasshouse excessive water in the root zone during early pod-set encouraged
vegetative growth and resulted in pod abortion and low yields. For
plants which were stressed by withholding water the adaxial stomata closed earlier than the abaxial stomata in leaves going into a water deficit and the adaxial stomata opened later in leaves recovering from a
water deficit. Other aspects of stomatal behaviour, such as the response
to irradiance level and the effect of leaf age on stomatal resistance, were similar to what has been observed in a wide range of other species.
8
.
Implications of this to increasing the yield of protein from the soybean
is discussed. Finally, the results are discussed in the context of
increasing the bean yield of the soybean plant by increasing the product
ion of photosynthate and improving the partitioning of photosynthate to
reproductive tissue. Practical limitations to these objectives are
mentioned and the relevance of the results to the Australian situation
9.
INTRODUCTION
Shortages of food will be a problem on a world scale for many
years although the specific nature of such shortages will change spatially
and temporally as the weather and technology change, and not unimport
antly, as man’s understanding of his nutrition changes (Porter and Rolls
1973). The once widely held belief that protein shortage
pev se
is responsible for undernutrition in less developed countries has beenchallenged and the problem is now seen to be considerably more complex,
involving not only the quality of the diet but also the total energy
intake of the people (Sukhatme 1973; Mauron 1973). However, there are
still substantial areas of the world where the protein supply and its
composition in the diet are two of the major limitations to adequate
nutrition (Evans 1972).
Historically, the dietary protein requirement of Australia’s
population has come predominantly from animals, particularly meat (37%)
and dairy products (23%) (Stillings 1973). However grazing animals use
arable land inefficiently as only between 5 and 20% of plant energy is
recovered as energy suitable for human consumption (Heichel and Frink
1975). The time when it will be necessary to raise this efficiency by
increasing the proportion of plant energy in ma n ’s diet may not be far
off. The domestic utilization of vegetable oils and protein meals has
increased dramatically in recent years as a result of the increasing
consumption by humans and animals (pigs and poultry) and the increasing
availability of vegetable oils for industrial uses as a result of in
10. of the area sown to oilseed crops, notably Helianthus annuus (sunflower),
Brassiea napus (rape), and Glyoine max (L.) Merrill -soybean.
Soybean has attributes that favour it for production in
Australia compared to other new crops - a high yield of protein (-40%)
with a good balance of amino acids for human or animal nutrition, a
moderately high oil content (-20%, with 80% poly-unsaturated acids), an
ability to fix nitrogen in conjunction with Rhizobium spp., a summer
growing period making it an alternative to cotton or sugar cane, a large
world market, alternative uses of the bean, a favourable price, and the
benefit of a large amount of research from the United States of America
on many aspects of its growth and utilization.
Soybean research in Australia commenced in the early 1890s but
poor methodology and little understanding of the plant’s agronomic
requirements resulted in low yields and hindered progress for almost 70
years. Intensive varietal testing under irrigation since 1963 and
recent agronomic studies on plant spacing and competition has nearly
doubled soybean yields (from 770 kg ha ^ in 1967-68 to 1345 kg ha ^ in
1973-74) and together with high prices, has stimulated commercial interest
in the crop. An estimated 53,000 hectares (70% in Queensland and 30% in
New South Wales) were sown in 1974-75, an increase of 49,000 hectares
since 1969-70 (Anon. 1975). Despite this increase, imports of soybean
products increased to $US15.1 million in 1973-74 (Anon. 1975) with the
prospect of greater usage with freer availability. However, it is not
easy to obtain high yields (4-5000 kg ha 1) of soybean, although farm
11. et al. 1975) and have been obtained occassionally in Australia (Carter
1975). Irrigation is necessary in low effective rainfall environments,
yields may be reduced by lodging, pod shattering, weed competition or
insect infestation, and present commercial varieties have been bred or
selected for American conditions with one exception (cv. Ruse). Some of
these deficiencies could be corrected by varietal selection and breeding,
providing our major limitations to production are defined and researched.
In the U.S.A., soybean is grown in areas of high rainfall and
humidity where susceptibility to water deficits is not as common as in
the drier Australian environment. Here the availability of an adequate
supply of water is of major importance in selecting the most suitable
areas for growing the crop, in specifying irrigation regimes, and in
determining yields and economic returns. An estimated 71% of the Austra
lian crop was irrigated in 1970-71. The Review of Literature will show
that the drought physiology of the plant is not well understood especially
in high water demand situations, and that carbon assimilation, which is
dependent on an adequate plant water balance, appears to limit bean
yield. One of the fundamental aims of crop research is to maximize the
yield of a product of acceptable quality within the constraints imposed
by limited resources. Land suitable for cropping is generally regarded
as the resource which is most limiting and so increases in food product
ion must come more from increased yields per unit area and less from
expanding areas. Investigating some of the important restraints to high
yields of soybean is the theme of this Thesis.
Experiments discussed in this Thesis were planned to study
factors affecting photosynthesis, water balance and yield in soybean
12.
to plant development and the effect of some environmental and plant
factors on carbon assimilation and bean yields. The aim of the work on
water relations was to determine the effect of water deficits, imposed
by reduced supply or increased demand at different stages of growth, on
plant growth and yield.
The influence of changes in the water supply was studied in a
glasshouse during summer, and differing atmospheric demand situations
were studied in controlled environment cabinets; carbon assimilation
13.
REVIEW OF LITERATURE
This review attempts to collate the knowledge on yield physiol
ogy of the soybean in order that the factors limiting yield may be
identified and deficiencies defined in the context of the Australian
environment. Emphasis has been placed on the interaction between carbon
assimilation and bean yield and associated factors which may influence
or control this relationship. I have attempted to define the major
barrier to high yields in soybean, given adequate nutrition, an adapted
variety and good agronomic management.
Agronomy
The soybean requires a minimum screen temperature greater than
8-10°C for growth and a maximum soil temperature (4 cm) greater than 13-
15°C for germination and seedling growth (Laing and Byth 1972). The
optimum temperature for leaf area and dry matter production in seedlings
(cv. Biloxi) is between 27° and 33°C (Hofstra 1972). The rate of plant
development prior to flowering shows a curvilinear relationship with
increasing temperature with an optimum near 30°C (Brown 1960). Flower
initiation and continued reproductive development in the plant is depend
ent upon temperature and the length of the night period (Howell 1960;
Johnson
et dl,
1960), and there is considerable variation in the response of cultivars to these factors. The selection of a suitable cultivar
for a particular environment is necessary for high bean yields (see
Carter 1974; Laing 1974). Water deficits during flowering, pod develop
ment and pod filling may decrease bean yields (Laing 1966; Thompson 1970;
14. of water during the growing season or between 76 and 95% of pan evapor
ation (Peters and Johnson 1960; Dusek et al. 1971; Thompson 1974).
Average soybean yields have been regarded as comparatively low and attempts to increase the general yield level in the U.S.A. have not been very successful. The average annual yield increase for soybean has been 17.9 kg ha ^ yr ^ (1.3% of the mean yield, for the period 1935-68), but 102.6 kg ha ^ yr ^ (3.6% of the mean yield, for 1935-68) for maize, and 109.5 kg ha ^ yr ^ (5.7% of the mean yield, for 1944-68) for sorghum
(Russell 1973). Mean soybean yield for the 1974 season in the U.S.A. was 1580 kg ha"^". Mean bean yield in New South Wales for 1971-72 was
1840 kg ha ^ (irrigated, and the highest mean yield to 1975); compared
to an average wheat yield of 1340 kg ha ^ (dryland for 1959-69) and an
average maize yield of 3220 kg ha ^ (1959-69). Even allowing for the
higher energy content of the soybean seed, energy yields are still comparatively low (Long 1934; Hanson et at. 1961).
Parameters Influencing Yield
Growth of the "determinate" soybean plant can be divided into
three stages. Stage I concerns vegetative growth to form the photo
synthetic structure and the nutrient and water absorbing system. Maxi mum Relative Growth Rate (RGR) of these parts occurs during this period
(Koller et al. 1970). Stage II involves initiation of flower primordia
in leaf and branch axils, floral development and fertilization. Concur
rently, the greatest (absolute) increase in leaf, stem, petiole and root dry weight per unit land area occurs (Koller 1971; Mitchell and Russell
1971). During Stage III, pod wall growth is followed by seed filling
15. At senescence most of the leaves have abscissed leaving a bare stem with pods in racemes.
The prime determinants of yield expression are the total amount of photosynthate produced and the efficiency of utilisation of the photosynthate by the beans. The former is a function of net photo synthetic rate, leaf area, and the duration of photosynthetic activity (the assimilate source) and the latter is dependent upon the number of beans and their ability to compete for the photosynthate (the assimilate
sink). The photosynthetic process is controlled by irradiance levels, while the conversion of photosynthate into plant tissue is dependent on temperature (Elmore et at. 1967). Other factors such as nutrient avail ability, the plants’ response to water deficits, translocation resist ance, rooting pattern, ’’harvest index” , or canopy shape may also influence yield but are manifested through the above parameters (Curtis et at.
1969).
Does the sink or the source or neither limit the yield of soybean, what is the interaction between these parameters, and what environmental factors affect the limiting process?
Limitations on Bean Yietd Imposed by Sink Size
Total sink size is determined by root and top vegetative growth, photorespiration, night respiration and reproductive growth. The size of the reproductive sink is determined by the number of pods per plant, the number of beans per pod and the potential size of the beans. The yield component of the sink may be too small or unable to absorb all the photosynthate produced. The following discussion
16.
Up to 81% of flowers and pods may be shed under ’normal’ circumstances in the field (van Schaik and Probst 1958), but there was no evidence relating the shedding to high day and night temperatures
(32°C) or long photoperiods which increased shedding in a controlled
environment. Forty per cent manual depodding did not affect the bean
yield of treated plants compared to control plants which aborted an apparent 10-20% of pods naturally in the field (McAlister and Krober
1958). The bean yield and pod number per plant were not affected when
all floral buds were removed from one-third sections (top, middle, and bottom of the canopy) of soybean plants (Hicks and Pendleton 1969). Limited assimilate translocation to the heavily podded sections may have reduced natural shedding in the treated plants and the authors suggested that normal shedding is a result of lack of assimilates.
CO2 enrichment (1200 yl 1 ^ of cv. Hark) during the vegetative and flowering periods increased pod numbers but not seed yield indicat ing that sink size was less limiting to yield than the amount of photo-
synthate produced during pod filling (Hardman and Brun 1971). CC^
enrichment during pod filling increased bean yield by 25% as a result of more filled pods demonstrating the degree of sensitivity of the florets and young pods to competition for photosynthate.
Therefore, potential sink size (pod number) would not appear to limit the yield of soybeans as there are more sites for pod formation than the plant normally develops.
Source Limitations to Bean Yield
17. p a t t e m of distribution of assimilate within the plant may prevent the development of all floral primordia, will now be discussed.
Photo synthetic Physiology of the Leaf Canopy. Soybean crops
show a critical leaf area index (LAI) rather than an optimal LAI i.e. the lower leaves do not become parasitic on the plant and compete for
photosynthate (Shibles and Weber 1965). Respiration and possibly
photorespiration in these leaves are low or these lower leaves abscise
(Ojima et at. 1965; Kumura 1969; Jeffers and Shibles 1969; Johnston
et at. 1969). From 70 to 90% of the incident radiation on a soybean
canopy is intercepted by the upper layer of leaves (Shaw and Weber 1967;
Luxmoore et at. 1970). Increasing the irradiant flux density in the
lower parts of the canopy has increased bean yield (Shaw and Weber 1967;
Johnston et at. 1969); although the most efficient use of solar radiat
ion by the canopy would occur when the lowest leaves are at their light
compensation points. However, leaf growth in excess of that required
for full radiation interception uses assimilate inefficiently and may reduce bean yield as a result of a longer vegetative period and increased water deficits (Shibles and Weber 1966) or increased lodging and plant
competition (Weber et at. 1966).
Photosynthetic patterns measured in a field chamber led Sakamoto and Shaw (1967) to conclude the canopy was light saturated at 64.5 to 68.8 klux during initial flowering when LAI was 7, and at 59.1 klux
during pod formation and filling when LAI <6. The midday plateau in
18.
crops. Leaves from field grown canopy plants may saturate at 107.5 klux
thus the canopy would have saturated at a much greater irradiance level
-2
(Beuerlein and Pendleton 1971). At an irradiance level of 838 W m
(about 80 klux), canopy photosynthesis was light saturated at an LAI <4 and continued to increase up to an LAI >8 (Jeffers and Shibles 1969;
Buttery 1970). Jeffers and Shibles (1969) suggested that the light
saturation observed by Sakamoto and Shaw (1967) was a result of
supra-optimal air temperatures. Egli et al. (1970) showed that the canopies
-2
of three cultivars of soybean were not light saturated at 838 W m from
eight weeks after sowing (the LAI was not indicated). The saturating
irradiant flux density (and the maximum rate of photosynthesis) in field and cabinet grown soybeans is a function of the irradiant flux density
on the leaf or plant during growth (Bowes et at. 1972). These authors
believed acclimation to light could account for differences recorded in these parameters.
Thus the soybean canopy is characterized by a critical LAI for dry matter production, an optimal LAI for seed production under certain agronomic regimes, a poor distribution of light within the canopy, and a high irradiance requirement for light saturation, which are undesirable features for maximum productivity.
Changes in the Supply of Photosynthate and Yield. Partial
defoliation of soybean canopies has generally reduced bean yields, however the amount of total leaf area removed has not decreased yield proportionately. Removal of leaves from the top, middle or bottom
19.
8% respectively (Johnston and Pendleton 1968). Row spacing was 102 cm
which would over-estimate the contribution of the middle and lower
leaves to yield in many commercial crops. Eighty per cent and 40%
random defoliation (leaf area basis) at the commencement of pod filling
reduced seed yields by 48% and 21% as a result of fewer pods per plant
and lower seed weights (McAlister and Krober 1958). Light, medium and
heavy defoliation at regular intervals reduced seed yields and stem
and root weights in two varieties (Gibson et at. 1943). Partial defol
iation of several species has resulted in increased photosynthesis in
the remaining leaves, thus counteracting defoliation effects to some
extent (Wareing et at. 1968 with maize and bean; Meidner 1970 with
bean; Beuerlein and Pendleton 1971 with soybean; Hodgkinson 1974 with
lucerne). It appears that any significant reduction in leaf area decreas
es bean yield in soybean as a result of a reduced supply of assimilate
although mechanisms are present which may reduce such effects. Develop
ing leaves and other vegetative parts may compete effectively with
developing flowers and pods for assimilates (Weber 1968; McAlister and
Krober 1968; Mann and Jaworski 1970; Hardman and Brun 1971), suggest
ing a limited supply within the plant.
Increasing the irradiation within a field canopy has usually
increased bean yields. Johnston et at. (1969) increased the bean yield
by 16% by placing ’Grolux’ lamps within the canopy and white plastic on
the soil nine weeks after sowing, with 50 cm row spacing. The response
was most pronounced in the bottom and middle sections of the canopy
where yield increased by 30% and 20% as a result of more beans per plant
(yield did not increase in the top section). Shaw and Weber (1967)
20. increased by manual plant spreading during flowering to simulate lodging,
compared to a naturally lodged canopy. Thus, increasing the irradiant
flux density in the lower sections of the canopy by changing its architect
ure would probably increase yields through the more efficient utilization
of natural light.
Yield differences between varieties are not a result of differ
ences in photosynthetic rates but of the total photosynthate produced as
determined by the duration of the pod filling period (Curtis et at.
1969; Dornhoff and Shibles 1970). Increased yield within a variety
could possibly be obtained by breeding for higher rates of photo
synthesis if leaf area duration was maintained.
Thus it is apparent that the bean yield of soybean plants
under field conditions is limited by the amount of photosynthate available
during flowering and pod set (which may result in reduced numbers of
pods per plant) or during pod filling (which may result in reduced bean
weights). Increases in seed yield could be obtained by increasing
irradiation levels to the leaves below the peripheral layer, or through
higher leaf angles (cf. Sakamoto and Shaw 1967) or changing leaf shape
or plant morphology, or by increasing photosynthesis rates (Ojima and
Kawashima 1968; Moss and Musgrave 1971), or by extending the pod filling
period.
Arguments contrary to a source limitation can be found.
Koller (1971) excluded a source limitation to yield when he concluded
seed growth rate was primarily controlled by regulatory mechanisms
within the seed (i.e. directly proportional to stage of seed development)
rather than by the external availability of assimilates. His conclusion
21. such as where the yield has been limited through flower shedding.
Further data on the same crop (Koller et dl. 1970) showed a large increase (up to 40%) in net assimilation rate (NAR) from the commencement of pod filling, indicating at least a strong interaction between seed filling
and photosynthesis. Shibles et al. (1975) have challenged this inter
pretation and say the increase in NAR may have been a result of rapid leaf abscission.
Gifford (1974a) and Gifford et dl. (1973) proposed that both the source and sink can be limiting at the same time and presented
calculations of the degree of source limitation. What these authors may actually be measuring is the competitive ability of the reproductive sink compared to the vegetative sink, or a complex interaction between the two. In any case, their method is not suited to studying the soy bean because of the overlap in time of the vegetative and reproductive
phases of growth. Gifford’s proposal that the source and the sink are
both partially limiting yield is worthy of further consideration and is discussed in a later section.
Limitations to Photosynthesis
Because the supply of photosynthate limits bean yield, then with a fixed irradiance, leaf area and duration, limitations to photo-
synthetic rate are restricting yield. These are primarily C0^ transfer
Carbon Dioxide Transfer
The photosynthetic response of a single leaf to increasing irradiance (Fig. LI) shows a limitation by irradiance level in section A of the curve, a limitation by CO^ transfer in section C and both factors
partially limiting at B. Net photosynthetic rate per unit area (F) of
individual leaves of two varieties of soybean was light saturated at 22 klux at a CC> 2 concentration of 300 yl 1 \ but at 75 klux F increased linearly with CO^ concentration to above 600 yl 1 ^ and the leaf was not CO^ saturated at 1670 yl 1 ^ (Brun and Cooper 1967). The authors con cluded that F was limited by the transfer of CO2 from the atmosphere to
the chloroplasts and not by cell biochemistry. Increasing the CO2
concentration from 300 to 600 yl 1 ^ increased the mean daily photo synthesis (ground area basis) for crops of Harosoy and Wayne soybeans by 84% and 75% respectively, 60 days after sowing (Egli et at. 1970).
Soybean plants grown in a glasshouse with air containing 350 and 1350 yl 1 ^ of CO2 produced 50% more yield at the higher concentration owing to an increased number of pods per plant (Cooper and Brun 1967). CO2 enrichment of field-giown Hark soybeans (1200 yl 1 ^) for five weeks during pod filling increased seed yield by 25% (Hardman and Brun 1971). Clearly, the supply of CO2 limits photosynthesis and yield of soybean
plants. Several plant factors influence this relationship and will now
2 2 .
23.
2000 1200
Fig. LI. Net photosynthetic rate (F)
of a soybean leaflet at increasing irradiant flux density (I, 400-700 nm);
data taken from Section A
Carbon dioxide transfer from the atmosphere to the reaction centres in the chloroplasts is limited by three principal resistances in
series; the boundary layer resistance (r ), the stomatal resistance
3.
(rg) , and the mesophyll resistance (r^) consisting of physical and chemical components (Jarvis 1971).
The boundary layer resistance is dependent upon leaf size,
shape, roughness and windspeed (Gaastra 1959). In assimilation chambers
with air stirring r is generally less than 1.5 s cm ^ (El-Sharkawy and
3
Hesketh 1965; Dornhoff and Shibles 1970; Upmeyer and Koller 1973).
[image:23.544.112.529.78.499.2]24.
The stomatal and mesophyll resistances of soybean leaves are
similar in magnitude under favourable conditions, although r^ is usually
about twice rg . rg ranges from 1.5 to 15 s cm ^ and r^ ranges from 1.6
to 15.5 s cm ^ for active leaves (El-Sharkawy and Hesketh 1965; Dornhoff
and Shibles 1970; Stevenson and Shaw 1971; Upmeyer and Koller 1973;
Beardsell et at. 1973b).
Stomatal resistance appears to be important in limiting F in
soybean. Reduced transpiration as a result of stomatal closure has been
accompanied by parallel decreases in F (Boyer 1970b; Beardsell et at.
1973a).
Gaastra (1959) believed that r^ was an important yield
determining factor in crop plants because of its relatively high value,
and in soybean Dornhoff and Shibles (1970) and Beardsell et at. (1973b)
have shown r^ to be the most limiting resistance to F. The physical
transfer component of r is the major limiting resistance in some circumst
ances (Gaastra 1959; Brun and Cooper 1967; Kriedemann et at. 1970;
Jones and Slatyer 1972). However in two similar experiments on cotton,
Jones and Slatyer (1972) found the transfer component was the major
resistance in one and the carboxylation component in the other and
suggested that both components are linked.
In soybean (and other plants) CO^ reacts with
ribulose-1-5-diphosphate (RuDP) to form 3-phosphoglycerate in the presence of RuDP
carboxylase, in the chloroplast. It has been suggested that this or
associated reactions may also limit or control F. The evidence is
somewhat indirect. Hesketh (1963) originally proposed that the different
25
.
increased F of the remaining leaves within a few days (Sweet and Wareing1966). This was later demonstrated on other species on fully expanded
leaves (Woolhouse 1968; Hodgkinson 1974) and the increase in F was
associated with increased activity of RuDP carboxylase and increased
supply of cytokinins from the roots (Wareing et at. 1968). Part of the
increase in F was probably attributable to increased demand for assimil ate on the remaining leaves, and some of the increase (of the order of 30%) could also have been attributable to increased stomatal conductance
(Meidner 1970). However, the lower rg may be directly attributable to
the lower rw and the subsequent lower substomatal concentrations of C0o
M z
(Meidner and Mansfield 1965). Meidner (1970) also showed that debudding Xanthium increased F in the leaves as a result of changes in rw , not r .
M s
A close relationship was found between F and RuDP carboxylase activity in the first eight leaves of Capsicum (Steer 1971), in leaves of cabinet grown soybean (Bowes et at. 1972), and in bean (Wareing et at. 1968), and cf. Bjorkman (1968).
Therefore F is also limited by the activity of carboxylation enzymes in the chloroplasts. It is possible the transfer and carbo xylation components of r^ both partially limit F.
It is also clear that both rg and r^ partially limit F. Unless CO^ concentration in the canopy can be increased, which is not feasible with present technology (Allen et at. 1974) , finding varieties with more efficient F at 300 yl 1 ^ CO^ via lower stomatal and mesophyll
26. Photorespiration
Photorespiration is a light induced CO^ release process involv ing glycolate metabolism and requiring oxygen (Jackson and Volk 1970) and is difficult to estimate because of the inadequacy of present methods
(Ludlow and Jarvis 1971). The rate of photorespiration of soybean
-2 -1
leaflets has been estimated at between 17 and 45 ng CO^ cm s (Forrester
et at. 1966; Samish et at. 1972) depending on the method used. This
represents between 7% and 30% of F.
Clearly, reducing photorespiration would increase net photo synthesis in leaves, but attempts to find soybean varieties without
photorespiration have been unsuccessful (Cannell et at. 1969). In fact,
Hofstra and Hesketh (1969) and Jackson and Volk (1970) have suggested that photosynthesis and photorespiration are closely associated which may mean that one can not only be easily reduced without affecting the
other, although Samish et at. (1972) found no such relationship over several varieties of soybean.
Water Deficits and Photosynthesis
Water serves at least four functions in plant growth. It is a major constituent of living tissue, a reagent in photosynthesis, a
solvent for salts, sugars and gases, and aids the maintenance of cell
turgidity (Kramer 1963). Transpired water also helps to prevent high
temperatures in some tissues which could affect enzyme action. Reduced
water availability can have important consequences on photosynthesis and leaf growth (Boyer 1970a) and thus the total production of photosynthate.
biochem-27.
istry. The broad, planar leaves of soybean intercept large quantities
of irradiation which promotes leaf water deficits (Stevenson and Shaw
1971). Ghorashy
et at.
(1971) claimed that photosynthesis in the soybean plant is more sensitive to stress during pod filling than during flowering. This may be true in absolute units of F but the three isolines
which were studied exhibited between 74 and 120% higher F during pod
filling than during flowering. The relative decrease in F in all three
isolines at both stages of growth was similar (-57%) with only one
exception, as a result of a drop in leaf water potential (LWP) from -8
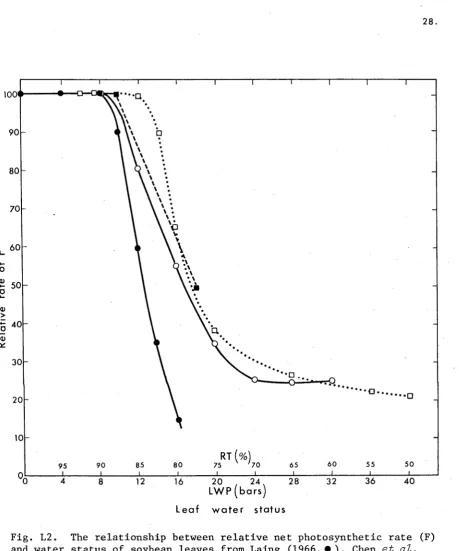
or -12 bars to -20 bars. F decreased linearly with decreasing LWP. F
decreased when relative turgidity (RT) fell below 90%, and was half the
maximum rate at 79-84% RT for soybean leaves (Chen
et di.
1971; Laing 1966) - Fig. L2. F of leaves of cv. Harosoy was unaffected by desiccation until LWP dropped below -11 bars (Boyer 1970a,b). Large increases
in rg have been observed when LWP dropped below -13 bars (Teare and
Kanemasu 1972). F was controlled solely by stomatal behaviour down to a
LWP of -16 bars where F was 60% that of a well-watered plant (Boyer
1970b). r__ remained low, -6 s cm ^ (24% of the total resistance, r +
M a
rs + r^) at desiccation levels of -41 bars, r^ in cotton was similarly
unaffected when RT dropped from 92 to 56% (Troughton and Slatyer 1969).
Biochemical pathways were not affected by water stress down to -12 bars
in
Vision
(Boyer and Bowen 1970) and again stomatal aperture had the greatest influence on F.A major criticism of such work is that the plant is usually
well watered until the stress is applied, and the stress is applied
quickly, a situation unlikely to be found in the field. Field grown
2 8.
••••a
L W P ( b a r s )
L e a f w a t e r s t a t u s
Fig. L2. The relationship between relative net photosynthetic rate (F)
and water status of soybean leaves from Laing (1966,#), Chen et al.
(1971,0), Boyer (1970, □), and Ghorashy et al. (1971, ■). The first two
[image:28.544.63.523.48.600.2]29.
which the stomata close gradually decreases e.g. in water stressed
sunflower grown in the field the stomata closed at a LWP between -21
and -27 bars (Turner pers. comm.) compared to -12 bars suggested by
Boyer (1970a).
However, it is clear that water deficits increase primarily rg
and reduce leaf expansion, with subsequent reductions in photosynthesis
and probably yield.
These aspects of soybean physiology which appear to limit or
reduce photosynthesis and yield will be examined in the remaining sections
of the Thesis. More specific Literature Reviews are presented in the
appropriate sections.
Turner, N.C., Experiments on adaptation of sunflower and sorghum to
31.
Abstract
Soybean plants of cv. Lee were grown in soil in large bins in
a glasshouse and a water deficit was imposed by withholding water at the
pre-flowering, flowering, or pod filling stages of growth. Stomatal
diffusive resistances and net photosynthetic rates were measured on
individual leaflets of stressed and well watered plants. Dry matter
accumulation and bean yields were determined.
The responses of the adaxial and abaxial stomata to irradiance
levels and plant water deficits were similar to those of other species.
The adaxial stomata were more sensitive to environmentally imposed
stresses than the abaxial stomata. Increased stomatal resistance in
older leaves was associated with a decline in rates of photosynthesis.
Leaf photosynthesis was variable and this may have been an effect of
leaf age or leaf position on the plant.
Bean yields were not significantly affected by any of the
stress treatments compared to the yields of well-watered plants. Excess
ive water in the root zone at early pod-set and high relative humidities
may have limited the bean yield in all treatments by encouraging vege
tative growth at the expense of reproductive growth. Possible reasons
for this are presented. The methodology of the experiment and some
32.
INTRODUCTION
This first experiment was to provide information on specific
aspects of soybean physiology on which to base later work. It was used
to develop techniques for growing soybean in controlled environments and
for obtaining data on the relationship between leaf photosynthesis and
yield under a range of droughting regimes.
Water stress is a common and important factor influencing
soybean production in the Australian environment, even when the crop is
grown with irrigation (Carter 1975). The resistance to water transport
in whole soybean plants is twice that of sunflower or bean, as a result
of a high radial resistance in the root (Boyer 1971). Thus leaf water
potential has to drop twice as low in soybean to maintain a given rate
of water transport to the leaf. (Barrs (1973) tentatively suggested
that the root resistance in cotton and tomato may decrease under high
transpiration rates, thus helping to prevent the onset of stress assoc
iated with plant resistance, although Boyer (1974) claimed that the
change in resistance is predominantly a leaf phenomenon in sunflower.)
Thus, a high atmospheric demand and/or low soil moisture availability
will result in soybean crops experiencing water deficits more rapidly
and more often than other crops.
A short-term water deficit during pod filling reduces yields
by a greater amount than water deficits at other growth stages of soy
bean, as a result of reduced pod numbers and reduced bean weight (Laing
1966; Dusek et ail. 1971; Doss et at. 1974 and cf. Thompson 1970).
This period is more critical than others because no compensation for
poor bean filling can occur since the plant is approaching maturity.
33. pods per plant, but compensation may occur in other yield parameters
(e.g. more beans develop per pod or bean weight is increased). The
lower yields are generally associated with reduced assimilate production, as a result of high stomatal resistances and low leaf water potentials
(Denmead and Shaw 1960; Laing 1966; Boyer 1970b). The absolute reduct ion in photosynthetic rate as a result of a water deficit can be greater during pod filling than during flowering (Ghorashy
et al.
1971), althoughthe relationship between reduced rates of photosynthesis and reduced bean yield requires elucidating.
The aim of the experiment was to determine the effect of a water deficit applied during the pre-flowering, flowering or pod filling
stages of growth on stomatal behaviour, photosynthesis and yield, and to determine the extent to which these factors are interrelated.
MATERIALS AND METHODS
Plant Culture
Graded (220-230 mg), pre-germinated seed of soybean cv. Lee was sown without
Rhizob'ium
inoculant into a fertile sandy-loam soil in3
34.
Application of Water Deficits and Plant Harvests
One plant in each block was water stressed at one of three stages of growth - pre-flowering, flowering, or pod filling - by with
holding water from the bin until leaves wilted. The rest of the plants
were always well watered.
Pre-flowering Stress
Water was withheld from three plants from December 15 (28 days after emergence, when the plants had seven nodes on the mainstem) and
wilting was first evident on December 20. On December 23 there was
little overnight recovery of leaf turgor or stomatal resistances so the
stressed plants were rewatered. One non-stressed plant from each block
was selected at random and harvested for dry weights of stems and leaves (after drying at 85°C for 24 h) and total leaf area (measured with an electronic planimeter).
Flowering Stress
Plants commenced to flower about December 30. Water was
withheld from three plants from January 8, 1973 (52 days from emergence) when flowers were present on all nodes except the second from the top. Leaves were wilting on the afternoon of the following day and as recovery overnight was partial and temporary the plants were rewatered at 1800 h
on January 10. One non-stressed plant was harvested from each block on
January 11. The same parameters were measured as previously and the
number of inflorescences was counted. Pod formation commenced about
35.
Pod-filling Stress
The pod-filling stress was imposed by slowly lowering the water table in the bottom of the bins from February 23 (98 days after
emergence). This was to prevent the stress developing too rapidly
because of the large leaf area. The plants started to wilt on March 5
and since the symptoms were evident the following morning, the plants
were rewatered at 1200 h. Two well-watered plants were harvested (the
third had previously been rejected because of a bacterial stem infection) and the dry weights of plant parts and leaf areas were determined.
Final Yield Harvest
Pods had matured by May 2 (166 days from emergence) but the leaves remained light green and had not senesced by June 4 when watering
ceased. Three well-watered (control) plants and all stressed plants
were harvested on June 20 and the dry weights of plant parts and the yield components were determined.
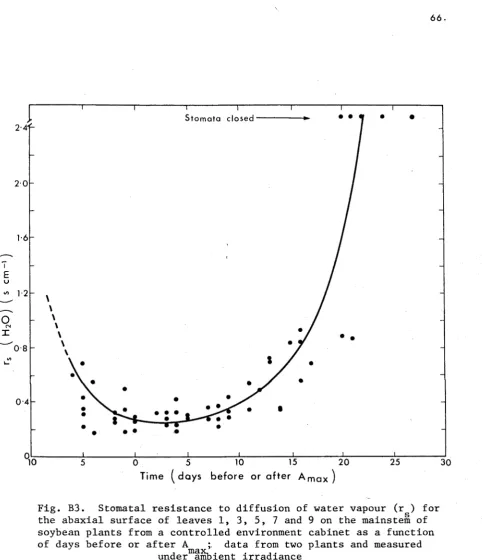
Measurement of Stomatal Resistance
Stomatal resistances to water vapour diffusion (r ) were measured with an aspirated diffusion porometer (Byrne et a l . 1970). Both surfaces of two recently expanded terminal leaflets were measured on each control plant and each stressed plant usually on three occasions
each day during the periods when the water deficits were applied. The
3 6. Measurement of Net Photosynthesis
Net photosynthetic rates of recently expanded terminal leaf
lets were measured during flowering and pod filling in the glasshouse
using infra-red gas analysis in an open system with a single-leaf assimil
ation chamber. The apparatus is described in detail in Appendix 1. A
north-facing leaflet was chosen each day for measurement. Mean leaflet
temperature at daily maximum photosynthetic rates was 30.1 + 0.2°C and
mean vapour pressure deficit was 16 mb. Measurements usually commenced
about 0900 h and ended before 1600 h, but as the season progressed this
period decreased because of the altitude of the sun.
Daily total short-wave irradiation (400-1100 nm) in the glass
house was measured with an integrating silicon cell pyranometer (accuracy
+ 10%) - Fig. Al.
2000
' 1500
E 1000
Pod filling Pod senescence Flowering
Emergence
Time (D a y s fr o m p l a n t e m e rg e n c e )
Fig. Al. Mean total daily shortwave (400-1100 nm) irradiance (I) in the glasshouse for seven day periods and plant phenology
[image:36.544.53.534.366.810.2]37. RESULTS
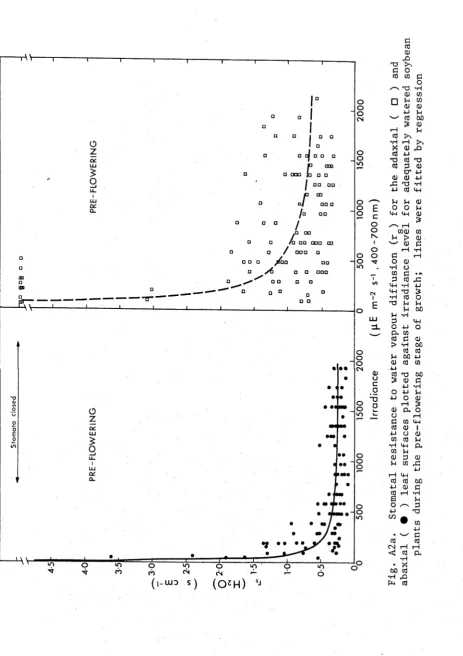
Stomatal Response to Irradiance Level
The irradiance level as well as the water status of the leaf
may influence rg , therefore it is necessary to first examine the response
of the stomata to changes in irradiance in order to separate the influ
ence of these factors. The stomatal resistances for both surfaces of
leaves from well watered plants at three growth stages is shown in Figs
A2a and A2b. The regressions were fitted to the data using the model
Ir = Ir . + I r . s mxn m m m
where r . is the minimum resistance and I is the irradiance at 2r .
m m m m m
(and see Turner and Begg (1973) for use of this model with tobacco and
grass leaves). The irradiance levels were measured on the adaxial leaf
surface so the abaxial stomata would actually have been under a lower
irradiance than that quoted. Thus, the abaxial stomata opened at much
lower irradiance levels than the adaxial stomata at all stages of growth.
The resistance of the adaxial stomata was generally from two to three
times greater and was more variable than that of abaxial stomata during
the pre-flowering and flowering stages at all irradiance levels. Stom
atal resistances were similar during the pre-flowering and flowering
stages but were considerably higher during the pod-filling stage.
During pod filling the adaxial stomata remained closed, in well watered
3 9.
o E
o o
9 o
p o P *H
p CO
CD CO
^ 0)
X X
C O M
ct3 CO 0 )
X /-N x
cu
□ 5-1 ^ U <D
4-J X
W Cd 0) 3 X
X 4-1
cd Ph X
• H i — I *4-4
X cd
P 4-> CD
XI 0) X P P CD
c r £
CD CD
rC X CO
4-» 03 CD
P X X *H
O O X M—I CM
1--1 • »
cocd X
V4 > 4J
w (U ^
X o
£ O CD 00 H
•H CJ CO p X P P O X X X X CO X P CD X X 00 X P M X 4-1
p CO
O 4-i CU CO 00 P P P t> *H *H
P X
V4 M X
CD P X 4-1 X
P X £ CD X
4-1 O O 4-1 CU 4-1 O
X X CD CM P
O P
p CO p CD 00 4-1 O P
CO P X
x x H
CO X CD CD P £ X CO O
I—I
X X X p p 4-1 CD CD
P X rC
& X
O /—N
4-1 00
t n Ä p
• x X
• p
rQ X
CN1 1— I
P-40. Points of Clarification
Two points of clarification are required. First, the porometer
measured the combined effect of the stomatal and cuticular resistances
to water vapour diffusion. Leaves with completely closed stomata pro
duced no readings on the porometer (even after hundreds of seconds) and
this is taken to indicate the cuticular resistance of these soybean
leaves was large enough to be neglected and thus the porometer was
effectively measuring r .
Second, the rg values are low when compared to those from an
assimilation chamber (Section C) from or other workers e.g. Dornhoff and
Shibles (1970), Stevenson and Shaw (1971) and Teare and Kanemasu (1972).
However, calibration of the porometer was by the method recommended by
Byrne et al. (1970) and was checked several times and agreed with their
calculations. The diffusive resistance of slit-shaped stomata can be
calculated using theory proposed by Jarvis et al. (1967, equation 11a)
and from data on stomatal frequency and dimensions obtained on December
-2 -4
23 (stomatal frequency 28100 cm , depth 12 x 10 cm, length 11 x
-4 -4
10 cm, width 5 x 10 cm for the abaxial stomata; and frequency 11700
-2 -4
cm and length 12 x 10 cm for the adaxial stomata). The calculated r s
values (to H^O at 30°C) were 0.28 and 0.63 s cm ^ for abaxial and adax
ial stomata and are similar to those measured with the porometer. There
would appear to be some factor associated with the porometer which
under-estimates rg relative to an assimilation chamber. Positioning the
porometer away from leaf margins or large veins and midway down the leaf
may be part of the cause. However, since all stomatal measurements
derived with the porometer for this Thesis (Sections A, B and D) are
used for comparative purposes only, the interpretation of the results is
41.
Stomatal Response to Water Deficits
The resistance of the adaxial and abaxial stomata for leaves on well-watered and stressed plants during the three periods of water
deficit is shown in Fig. A3. The measurements were made between 0900
and 1000 h except those during pod filling which were taken at 1100 h. Each point is a mean of five or six measurements on three plants at
-2 -1
irradiance levels greater than 500 yE m s (except where indicated on
the figure during pod filling). Standard errors were very small.
The pre-flowering stress developed slowly because of the small
leaf area of the plants. The resistance of the adaxial stomata increased
48 h before that of the abaxial stomata. The plants were re-watered
after all stomata had closed and leaves had lost turgidity, no recovery data are available.
During the flowering stress the resistance of the adaxial stomata again increased before that of the abaxial stomata but this is
obscured because only the 0900 h readings are presented. This stress
developed more rapidly than the previous one because the larger leaf areas transpired the limited amount of water at a faster rate. The abaxial stomata were first to respond to re-watering whereas the adaxial stomata had not fully recovered four days later despite the leaves
appearing turgid 16 h after re-watering.
The adaxial stomata on stressed and well-watered plants remain
ed closed or nearly so during pod filling. The resistance of the abaxial
stomata increased as the stress developed; on re-watering the plants
the resistance did not start to decline for about seven days and did not
reach the lower values of well-watered plants. This appeared to be a
PRE - FLOWERI NG • Abaxial control
o Abaxial stressed ■ Adaxial control a Adaxial stressed
S t o m a t a cl o s e d * -
p--D e c e m b e r
FLOWER I NG
,<cx S t o m a t a closed
J a n u a r y
POD FI LLI NG
-« S t o m a t a cl o s e d
Low l ig h t
M a r c h
Fig. A3. Stomatal resistance to water vapour diffusion (r ) for abaxial and adaxial surfaces of stressed (open symbols) anl well hydrated (closed symbols) soybean leaves at 0900 h or 1100 h during the periods of water deficits. Mean^of_£hree plants;
[image:42.544.69.545.36.705.2]A3. between March 28 and April 3 with a pressure chamber showed no signific ant difference in the water potentials of leaves from well-watered and stressed plants (7.9 + 1.4 bars and 12.1 + 2.9 bars respectively).
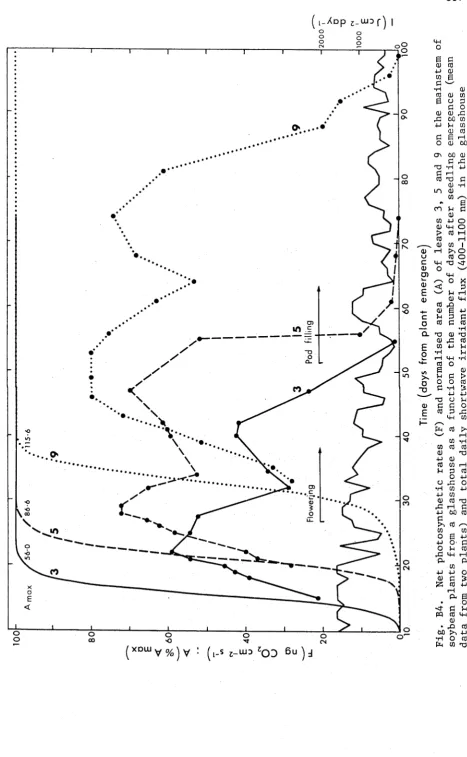
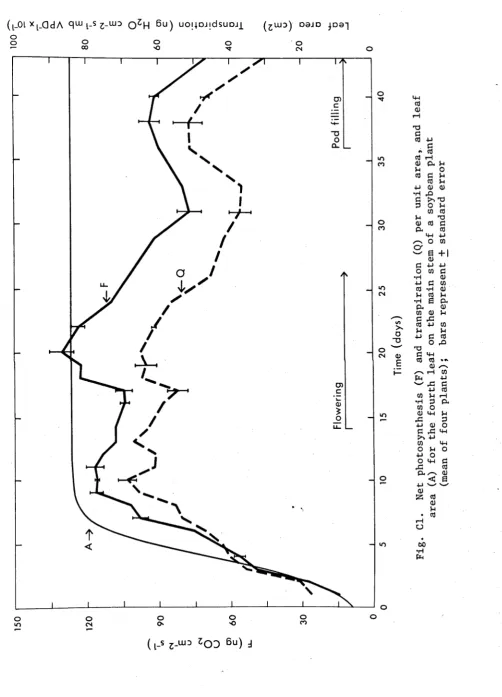
Net Photosynthesis during Flowering and Pod Filling
The maximum net photosynthetic rate per unit leaf area (F) recorded on each day of measurement on well-watered and stressed plants is shown in Fig. A4. Photosynthetic rates were maintained until during pod filling and then declined, although the data are variable. Since the leaves remained green for about two months after measurements ceased, F probably remained low during this period (cf. the similar behaviour of leaves on partially depodded plants, Section C ) .
The photosynthetic rates of leaves on plants in the well- watered and stress treatments were comparable prior to the application
of stress. Stress developed to the point where there was no net flux of
CC>2 from the leaf which indicates complete stomatal closure (supported
by the measurements of r ).
Leaf resistance (r^) to water vapour diffusion was calculated from 1/r.. = 1/r, + 1/r, , where r, and r, are the stomatal resistances of
l a b a b
the adaxial and abaxial leaf surfaces. The decline in leaf photo synthesis of control plants from about day 100 was associated with an increase in r^ - Fig. A4. Each r^ value is a mean of measurements on two leaves on each of three plants on three occasions during the day
4 4 .
LUD S
O O
Q) t—I
4-1 0)
O £
54 P
-Cfl w
rt o rt
H K l Ö l)
0 4-4 5-4
O P •H 1)
P O
O 0)
4-1 U
O P
4_) »H
•H P
4 5.
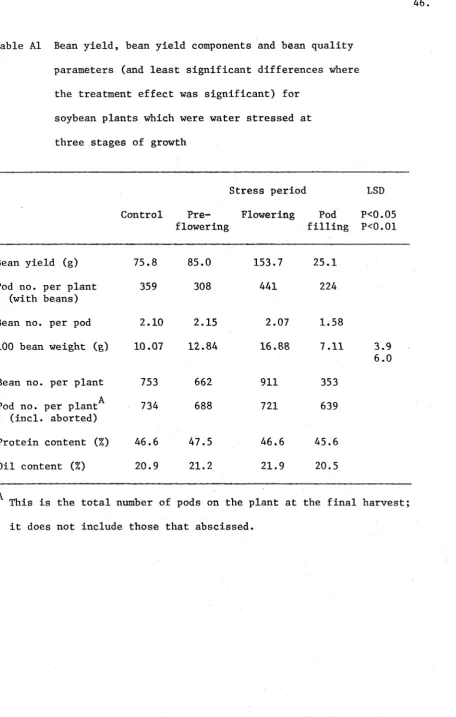
Bean Yield and its Components
The bean yields of the plants were low and there was no signific ant effect of treatment on bean yields (at the 0.05 level of probability) Table Al. The ’harvest index' of the control plants was less than 6%. The plants which were stressed during flowering produced the highest bean yield while those stressed during pod filling yielded the least.
This latter stress completely stopped pod filling (cf. Fig. A5, day 109) and caused the death of about 70% of the leaves.
The only yield component significantly affected by the treat
ments was the 100 bean weight. Bean weight was highly correlated to
2 * *
bean yield (r = 0.96 ). The number of pods per plant from the four
treatments was similar at maturity (although many pods could have been shed before the harvest) and only about half the pods on all plants contained beans.
Bean Quality
The mean oil and protein content of the beans over all treat
ments were 21.1% and 46.6% respectively (Table Al). Neither parameter
differed significantly between treatments. The high oil content may be
associated with the relatively high temperatures in the glasshouse (Howell 1960).
dry Matter Accumulation
The well-watered plants produced high leaf areas and branched heavily (Fig. A5). The most notable feature of this data is the 34% increase in the dry weight of tops from three weeks after pod filling
commenced (day 109) until senescence; 83% of which was stem and leaf
46.
Table AI Bean yield, bean yield components and bean quality
parameters (and least significant differences where
the treatment effect was significant) for
soybean plants which were water stressed at
three stages of growth
Stress period LSD
Control Pre- Flowering flowering
Pod filling
P<0.05 P<0.01
Bean yield (g) 75.8 85.0 153.7 25.1
Pod no. per plant 359 308 441 224
(with beans)
Bean no. per pod 2.10 2.15 2.07 1.58
100 bean weight (g) 10.07 12.84 16.88 7.11 3.9 6.0
Bean no. per plant 753 662 911 353
A
Pod no. per plant 734 688 721 639
(incl. aborted)
Protein content (%) 46.6 47.5 46.6 45.6
Oil content (%) 20.9 21.2 21.9 20.5
A
This is the total number of pods on the plant at the final harvest;
[image:46.544.70.527.83.801.2]1 3 3 5 4 7 to
D 9 J D j D 0 ")
c cu CD P-<D E <U >~~ O o r H r H a) p o 4 4 co cu > cO 0) I— I M-l o CO P CU ' i p p T3 p cO W) cO CU p cO >4-1 cO (U CO 4-1 p CO p. 4 4 p CO r H P . 44 o p O •H 4-1 CO r H P E P u o cO T3 cu 4-1 cO
• »> c j
4-J H 3
cO T3 CU u p cu 00 )4 cu e cu 0 o p
£ 5 >44
o
w CO 4-1 4-> P , P cO
OO r H
•H P<
<U £ P
CO
^ CU
P X*
Q O
co
m C <u
P . 0)
00 44
• H cO