Int. J. Electrochem. Sci., 12 (2017) 9829 – 9843, doi: 10.20964/2017.10.30
International Journal of
ELECTROCHEMICAL
SCIENCE
www.electrochemsci.org
A Composite Anodic Coating Containing Graphene on AZ31
Magnesium Alloy
Baojun Han1,2,*, Yang Yang1,2, Zhijuan Huang1,2, Li You 2, Huan Huang2, Kejun Wang2
1
Jiangxi Provincial Engineering Research Center for Magnesium alloys, Gannan Normal University, Ganzhou 341000, P. R. China
2
Schoolof Chemistry and Chemical Engineering, Gannan Normal University, Ganzhou 341000, P.R. China
*
E-mail: [email protected]
Received: 14 June 2017 / Accepted: 31 July 2017 / Published: 12 September 2017
Graphene was added to the electrolyte during the preparation of an anodic oxidation coating on an AZ31 magnesium alloy, and the effects of graphene on the surface morphology, chemical composition and phase composition of the coatings were investigated by scanning electron microscopy (SEM), energy dispersive spectroscopy (EDS), X-ray diffraction (XRD) and X-ray photoelectron spectroscopy (XPS). The corrosion resistance of the coatings was evaluated via electrochemical measurements, including dynamic polarization curves and electrochemical impendence spectroscopy (EIS). The results indicated that graphene was successfully incorporated into the anodic oxidation coating, and the number of micro-pores and cracks on the coating dramatically decreased. Moreover, the electrochemical measurements demonstrated that the corrosion resistance of the coating improved because the corrosion potential increased 470 mV and the corrosion current density decreased approximately three orders of magnitude when 0.5 g L-1 of graphene was added to the electrolyte.
Keywords: AZ31 magnesium alloy; anodic oxidation coating; graphene; corrosion resistance
1. INTRODUCTION
seriously limit their applications. Surface treatment is one of the most effective and direct methods to improve the corrosion resistance of magnesium alloys. Various surface treatments have been proposed to improve the corrosion resistance of magnesium alloys, such as chemical conversion coatings, anodic oxidation, vapor phase deposition, electroplating and electro-less plating, and plasma electrolytic oxidation [5-10]. Among these methods, anodic oxidation is considered as one of the easiest processes to protect magnesium alloy substrates due to its low cost, simple operation and excellent bond strength between the coating and the substrate [11]. Unfortunately, the surface morphology of the anodic coating is porous, which reduces the surface quality and facilitates the corrosion velocity of the magnesium alloy substrate. Therefore, the coating cannot be used for long-term protection of magnesium alloy substrates.
Consequently, an anodic oxidation treatment to seal the porosity embedded in the coatings is important. The chemical composition of the electrolyte is a main factor in determining the morphology and performance of the coatings. In recent years, the researchers [12-18] have proposed and added certain particles, such as ZrO2, TiO2, SiC, clay and PTFE, into the electrolytes, and these particles can
be incorporated into the coatings and produce less defective and cracked coatings. Zhang et al. [11] investigated the effect of superfine Al2O3 particle additives in the electrolyte on the corrosion
resistance and anti-wear properties of an anodic coating on AZ31 magnesium alloy. The corrosion resistance, micro-hardness and anti-wear property of the coating with the Al2O3 particle additives all
improved compared to that of the coating without the additive. Lv et al. [19] investigated the effect of graphite additives in the electrolytes on the microstructure and corrosion resistance of plasma electrolytic coatings on aluminum alloy and found that the morphology and corrosion resistance of the PEO coatings were significantly affected by the graphite size. Finer graphite grains are involved in the coating and make the coating more compact. Rapheal et al. [20] investigated the effect of the current density on the microstructure and corrosion resistance of PEO coatings on AM50 Mg alloy produced in an electrolyte containing clay additives. They found that the clay additives melted and were incorporated into the coating, and the coating exhibited the best corrosion resistance at a 30 mAcm-2 current density. Liu et al. [21] successfully fabricated hard anodic oxidation coatings containing micro-PTFE particles on the surface of an aluminum alloy via the addition of micro-micro-PTFE particles into the traditional anodizing electrolyte. Consequently, the fabrication of composite coatings with additives in the electrolyte is an effective and new method to further improve the performance of anodic oxidation coatings [22].
2. EXPERIMENTAL PROCEDURE
2.1 Materials and experimental process
[image:3.596.201.395.227.384.2]A commercial AZ31 magnesium alloy, nominal composition (in wt.%) 3.29% Al, 0.53% Zn, 0.15% Mn and balance Mg, was utilized as the substrate material in the present investigation. The samples were cut with dimensions of 10 mm × 10 mm × 10 mm. The samples were ground to 1500 grits with silicon carbide abrasive papers. Subsequently, the samples were ultrasonically rinsed with acetone and distilled water and dried in air at room temperature prior to the anodizing oxidation.
Figure 1. SEM morphology of the graphene utilized in the current investigation
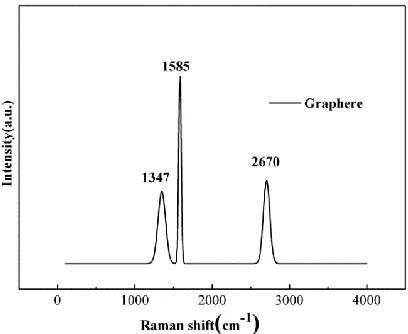
Figure 2. Raman spectrum of the graphene utilized in the current investigation
The anodizing oxidation processes were executed using a DC power source. The AZ31 samples were utilized as the anode, and 316 L stainless steel was utilized as the cathode. First, the alkaline electrolytes containing 10 g L-1 of sodium hydroxide (NaOH), 18 g L-1 of sodium silicate (Na2SiO3·9H2O), and 0, 0.1 g L-1, 0.5 g L-1 and 1.0 g L-1 of graphene were prepared. Then, the
electrolytes were ultrasonically dispersed for 30 min to ensure the graphene was homogeneously dispersed prior to the anodic oxidation processing. All the chemical reagents in the present
[image:3.596.196.400.440.607.2]investigation were of the analytical reagent (AR) grade. The graphene additive utilized in the present investigation was supplied by the MORSH Technology Co. Ltd. of Ningbo City, China. The SEM morphology of the graphene is presented in Fig. 1, and the corresponding Raman spectrum is presented in Fig. 2. The Raman peaks at 1347 cm-1, 1585 cm-1 and 2670 cm-1 corresponded to the D, G and 2D characteristic peaks of graphene [25]. The anodizing processing was executed with a constant current density of 0.3 A cm-2,and the electrolyte temperature was maintained at 25 °C for 30 min. During the anodizing, the electrolyte was persistently stirred by a magnetic stirrer in the electrolytic bank. After the anodic oxidation processing, the samples were washed in ethanol and distilled water and dried in air at room temperature.
2.2 Coating characterization
The micro-morphology and cross-section of the coatings were examined using scanning electron microscopy (SEM, Quanta, FEI 450). The chemical compositions of the coatings were analyzed via the energy dispersive spectrum (EDS, Oxford) attached to the SEM and X-ray photoelectron spectroscopy (XPS, Physical Electronics, Thermo ESCALAB 250Xi) with an Al Kα (hν=1486.6 eV) monochromatic source. The X-ray diffraction (XRD) experiments were performed on a Bruker D8 diffractometer with Cu Kα radiation (λ=0.154060 nm) over an angle range of 10~90º (2θ values).
The corrosion resistance of the coatings was evaluated via the dynamic polarization curves. The electrochemical impedance spectroscopy (EIS) measurements were taken in a 3.5 wt.% NaCl solution using a PGSTA302A AutoLab electrochemical workstation with a three-electrode cell system, and the system contained a reference electrode (a saturated calomel electrode), a counter electrode (a platinum foil) and a working electrode (samples). The area of the working electrode was 1.0 cm2. All the electrochemical tests were conducted following a 30 min immersion in the 3.5 wt.% NaCl solution at room temperature to attain a steady state of the open circuit potential, and three independent measurements were performed for each experimental condition. The EIS measurements were executed at a certain corrosion potential within a frequency range of 10-2 Hz to 105 Hz. The dynamic polarization curves were performed at a scanning rate of 1 mV s-1 from - 0.2 to 0.3V with respect to the open circuit potential. The corrosion potential (Ecorr) and the corrosion current density (icorr) were
determined using the Tafel extrapolation method according to the achieved dynamic polarization curves.
3. RESULTS AND DISCUSSION
3.1 Voltage behavior
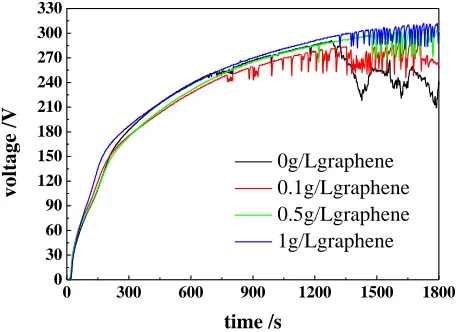
stage characteristic. Compared to the sample without graphene, the voltage increased faster with time. In particular, the sample with the graphene addition of 1.0 g L-1 had a faster voltage increase than the other samples, indicating that graphene might result in a thicker coating [29].
0g/Lgraphene 0.1g/Lgraphene 0.5g/Lgraphene 1g/Lgraphene
0 300 600 900 1200 1500 1800
0 30 60 90 120 150 180 210 240 270 300 330
v
o
lt
a
g
e
/
V
[image:5.596.184.413.138.304.2]time /s
Figure 3. Voltage vs. time plots of the anodic oxidation process with a constant current density of 0.3 A cm-2 for 30 min in electrolytes containing 10 g L-1 of NaOH, 18 g L-1 of NaSiO3·9H2O and
different concentrations of graphene
3.2 Surface morphology and phase composition
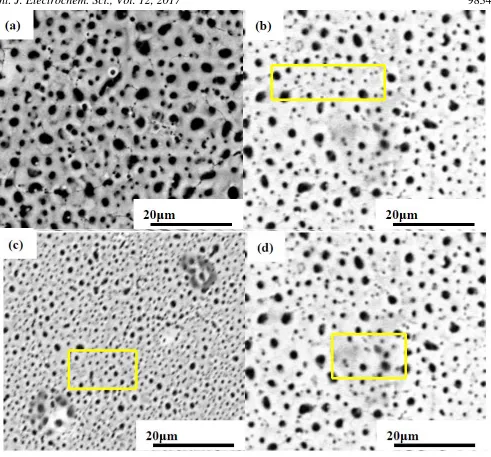
Figure 4. SEM surface morphology of the anodic oxidation coatings processed with a constant current density of 0.3 A cm-2 for 30 min in electrolytes containing 10 g L-1 of NaOH, 18 g L-1 of Na2SiO3·9H2O with graphene additions of (a) 0, (b) 0.1 g L-1, (c) 0.5 g L-1 and (d) 1.0 g L-1
Table 1. EDS chemical composition indicated by the box in Fig. 4
Elements (wt.%) Mg O Si Na C
0.1 g/L graphene 32.48 37.89 15.63 1.68 12.42
0.5 g/L graphene 22.19 32.83 9.54 0.83 34.11
1.0 g/L graphene 19.73 18.40 7.17 0.95 53.40
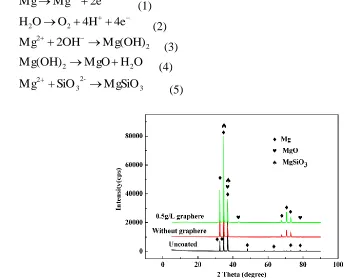
[image:6.596.85.515.618.676.2]oxidation coating was composed of Mg, MgO and Mg2SiO4 phases. Based on Daroonparvar’s
research results on the phase formation process of plasma electrolytic oxidation coatings on a Mg-1%Ca alloy in aluminate electrolytes [32], it was assumed that the new phases, MgO and Mg2SiO3, in
the present investigation formed through the following processes during the anodic oxidation processing:
Mg 2e
Mg 2 (1)
O 4H 4e O
H2 2 (2)
2 2 ) OH ( Mg OH 2
Mg (3)
O H MgO ) OH (
Mg 2 2 (4)
3 -2 3 + 2 MgSiO SiO + Mg (5)
Figure 5. XRD patterns of the substrate and the anodic oxidation samples processed with a constant current density of 0.3 A cm-2 for 30 min in electrolytes containing 10 g L-1 of NaOH, 18 g L-1 of Na2SiO3·9H2O and 0.5 g L-1 of graphene
-200 0 200 400 600 800 1000 1200 1400 0 1x10⁵ 2x10⁵ 3x10⁵ 4x10⁵ 5x10⁵ In te n si ty (a .u .) Binding Energy(eV)
Name pos At% C 1s 284.79 7.98 O 1s 532.43 60.77 Si 2p 103.33 30.24 Mg 1s 1311.12 1.01
Mg1s
O1s
[image:7.596.69.418.150.428.2]C1s Si2p
Figure 6. XPS spectra of coatings processed with a constant current density of 0.3 A cm-2 for 30 min in electrolytes containing 10 g L-1 of NaOH, 18 g L-1 of Na2SiO3·9H2O and (a) 0 (b) 0.5 g L-1
graphene
Although a C signal was not detected in the XRD patterns in Fig. 5, the XPS survey spectra detected Si, O, Mg, and C peaks. The signal of C 1s was present in the coating in Fig. 6a, and this is
-200 0 200 400 600 800 1000 1200 1400
0 1x10⁵ 2x10⁵ 3x10⁵ In te n si ty (a .u .) Binding Energy(eV)
Name pos At% C 1s 284.81 19.93 O 1s 532.1 53.99 Si 2p 103.06 17.72 Mg 1s 1303.97 8.36
Mg1s O1s
[image:7.596.90.510.520.668.2]common in XPS surface scanning from hydrocarbons in the environment. In contrast, the intensity of the C 1s peak in Fig. 6b was significantly stronger than that of the C 1s peak in Fig. 6a, which was evidence of graphene incorporation in the anodic oxidation coating [19].
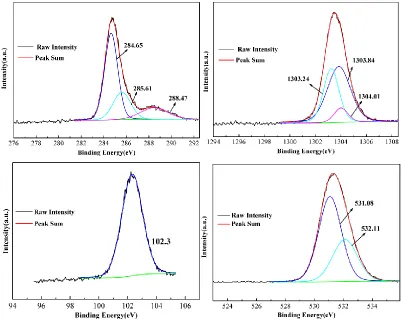
Fig. 7 presents the high solution spectra of the elements detected in Fig. 6b. The C 1s peaks at 284.65 eV, 285.6 eV and 288.47 eV in Fig. 7a corresponded to C=C, C sp3 and O-C=O chemical bonding, which indicated the incorporation of graphene into the coating [33], and the appearance of O-C=O bonding might be due to the oxidation of graphene during the anodic oxidation processing. The Mg 1s peaks at 1303.24 eV, 1303.84 eV and 1304.41 eV in Fig. 7b indicated that the Mg existed in the forms of Mg, MgO and MgSiO3. The Si 1s peaks at 102.2.24 eV in Fig. 7c indicated that the Si existed
in the form of MgSiO3. The O 1s peaks at 531.08 eV, and 532.11 eV in Fig. 7d indicated that the O
existed in the forms of MgO and MgSiO3. All the results in Fig. 7 were acceptable because all the
[image:8.596.98.500.298.618.2]detected peaks in Fig. 7 were derived from standard peaks below 1 eV.
Figure 7. XPS high resolution spectra of elements detected in Fig. 6b (a) C, (b) Mg (c) Si and (d) O
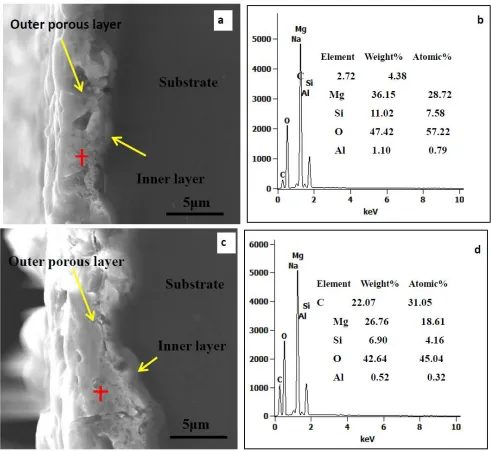
coating with the 0.5 g L-1 of graphene. Especially, the inner layer of the coating with the 0.5 g L-1 of graphene was also significantly more compact than the coating without graphene. The result was consistent with the voltage variation over time curves (Fig. 3). The EDS results indicated that although C could be detected in both coatings, the amount in Fig. 8b was almost 6 times higher than the amount in Fig. 8a, and this is additional evidence of graphene incorporation into the anodic oxidation coating.
Figure 8. SEM cross-sectional morphology and EDS chemical composition analysis of the coatings processed with a constant current density of 0.3 A cm-2 for 30 min in electrolytes containing 10 g L-1 of NaOH, 18 g L-1 of Na2SiO3·9H2O and graphene additions of (a), (b) 0 and (c), (d) 0.5 g
L-1
3.3 Corrosion resistance measurements
It is well known that the corrosion current density (icorr), corrosion potential (Ecorr) and Tafel
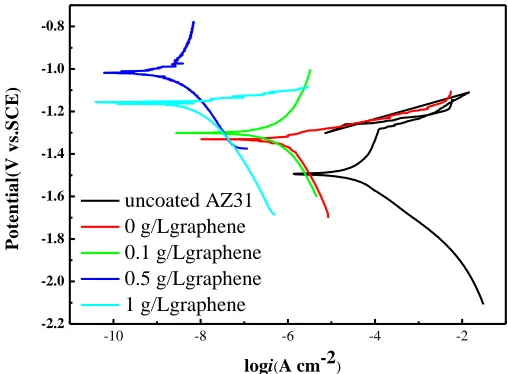
[image:9.596.54.545.155.606.2]anodic curve is an important feature related to the corrosion resistance, while the cathodic reaction corresponds to the evolution of hydrogen [34, 35]. The potentiodynamic polarization curves of the uncoated AZ31 magnesium alloy and the anodic oxidation samples with and without graphene exposed to a 3.5 wt.% NaCl solution for 30 min versus the open circuit potential are presented in Fig. 9. The corrosion potential (Ecorr), corrosion current density (icorr) and the Tafel slope ((bc) were derived
using the Tafel fitting method from the curves listed in Table 2. It can be observed that the corrosion potential, corrosion current density and Tafel slope of the uncoated sample were -1.49 V, 23.4 μA and 175.3 mV/dec, respectively, whereas the corrosion potential, corrosion current density and Tafel slope of the anodic oxidation sample were 1.33 V, 0.90 μA and 230.8 mV/dec, respectively, which indicated that the anodic oxidation improved the corrosion resistance of the AZ31 magnesium alloy. The results in Fig. 8 and Table 2 also show that the anodic oxidation coatings with graphene displayed higher corrosion potentials, lower corrosion current densities and lower Tafel slopes than those of the samples without graphene. In particular, for the coating with 0.5 g L-1 of graphene, the corrosion potential increased by 0.47 V, the corrosion current density decreased by approximately 3 orders of magnitude, and the Tafel slope increased 73.4 mV/dec compared to those values for the coating without graphene. These improvements were attributed to the uniform structure of the coating and the presence of fewer and smaller micro-pores.
uncoated AZ31 0 g/Lgraphene 0.1 g/Lgraphene 0.5 g/Lgraphene 1 g/Lgraphene
-10 -8 -6 -4 -2
-2.2 -2.0 -1.8 -1.6 -1.4 -1.2 -1.0 -0.8 P o te n ti a l( V v s. S C E )
logi(A cm-2)
Figure 9. Dynamic potential polarization curves of the coating processed with a constant current density of 0.3 A cm-2 for 30 min in electrolytes containing 10 g L-1 of NaOH, 18 g L-1 Na2SiO3·9H2O and various graphene addition amounts
[image:10.596.169.423.366.553.2]to the increased compactness, homogeneity and thickness of the coatings compared to that of the formed oxide films on the AZ31 magnesium alloy. These oxide coatings do not have enough stability in solution and cannot adequately protect the alloy against corrosion because the coating is porous. However, the incorporation of graphene into the anodic oxidation coating can remarkably reduce the anodic current density of the AZ31 magnesium alloy during corrosion The reason for this phenomenon can be attributed to the presence of graphene in the coating, which has a high chemical stability, and the dense structure of the anodic coating, which provides a good barrier to prevent the penetration of corrosion substances.
Table 2. Tafel fitting results of the curves in Fig. 9
Sample Ecorr (V) icorr (μA cm2) -bc (mV/dec)
uncoated AZ31 -1.49 23.4 175.3
0 g/L graphene -1.33 0.90 230.8
0.1 g/L graphene -1.30 0.35 242.6
0.5 g/L graphene -1.02 0.012 258.7
1.0 g/L graphene -1.15 0.052 232.9
EIS measurements were also executed to further investigate the performance of the coatings, and the Nyquist plots of the uncoated AZ31 magnesium alloy and the coated samples are presented in Fig. 10. It can be observed that all the Nyquist plots demonstrated capacitive depressed semicircles in the high frequency region, whereas the capacitive loops of the samples coated by anodic oxidation were significantly higher than that of the uncoated sample. The anodic oxidation samples with the 0.5 g L-1 of graphene in the electrolyte had the highest capacitive loops, which indicated that the sample displayed the best corrosion resistance [15].
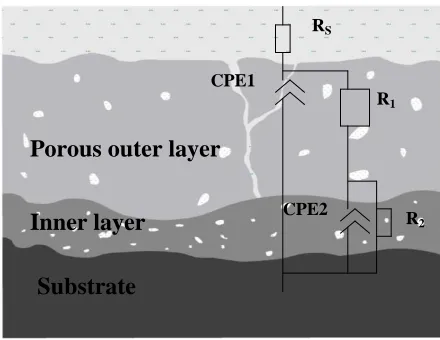
Using the SEM morphology observations and the EIS measurements, Fig. 11 presents the model microstructures of the anodic oxidation coatings with equivalent circuits, indicating that the anodic coatings were composed of two layers, i.e., a porous outer layer and more dense inner layer, that were similar, as demonstrated in reference [38]. The equivalent circuits in Fig. 11 were utilized to model the impedance data and deduce the parameters of the circuit elements, and Rs, R1 and R2 refer to
the impedance of the solution, the outer layer and the inner layer, respectively. The CPE2 was parallel to R2, and CPE1 was parallel to R1. The variation in the parameters of the circuit elements can be
utilized to assess the corrosion resistance of the coatings [12], and Table 3 provides the calculated parameters of the various samples. It can be observed that the impedances of the coated samples were significantly higher compared to those of the uncoated samples, especially for the sample with 0.5 g L
-1
of graphene. The R1 and R2 impedances were approximately 10 times higher than those of the
Figure 10. Nyquist plots of anodic coatings: (a) uncoated AZ31 magnesium alloy and (b) coatings processed with a constant current density of 0.3 A cm-2 for 30 min in electrolytes containing 10 g L-1 of NaOH, 18 g L-1 of Na2SiO3·9H2O and various graphene additions
Figure 11. Model microstructure of the anodic oxidation coating with an equivalent circuit diagram The present experimental results demonstrated that the addition of graphene into the anodic oxidation electrolyte of the AZ31 magnesium alloy can improve the corrosion resistance of the anodic coatings. Zhao et al. [33] deduced the mechanism by which a graphene oxide addition into the electrolyte improved the corrosion resistance of the plasma electrolytic oxidation coating on an AZ31 magnesium alloy, and they concluded that the graphene oxide addition can block corrosion electrolyte diffusion into the substrate. Referenrce [32] reported similar results. Therefore, the mechanism by which a graphene addition improves the anodic oxidation coating surface performance can be deduced as the following: during the anodic oxidation coating formation, the graphene is embedded into the outer layer and inner layer of the coating, leading the coating to become compact (Fig. 8b). This occurs because graphene preferentially locates at the micro-pores and cracks in the coating. Additionally, when the coated samples are immersed in a corrosion medium, graphene prevents the corrosion medium from penetrating the substrate and improves the magnesium alloy corrosion resistance.
CPE2 CPE1
RS
R1
R2
Porous outer layer
Inner layer
[image:12.596.184.404.296.466.2]Table 3. Impedance values of samples with various graphene additions Graphene
(g L-1)
Rs
(Ω.cm2)
CPE-T (SnΩ-1.cm-2)
CPE-P (SnΩ-1.cm-2)
R1
(KΩ.cm2)
CPE-T (SnΩ-1.cm-2)
CPE-P (SnΩ-1.cm-2)
R2
(KΩ.cm2)
0 13.13 3.68×10⁻⁶ 0.71 1.74 5.37×10⁻⁶ 0.95 146.90
0.1 13.74 3.79×10⁻⁷ 0.83 14.86 5.05×10⁻⁶ 0.70 302.46
0.5 11.06 4.47×10⁻⁷ 0.75 79.25 1.84×10⁻⁶ 0.91 2108.60
1 12.32 6.72×10⁻⁶ 0.54 4.86 5.04×10⁻⁶ 0.68 421.13
4. CONCLUSIONS
In the present investigation, a novel approach for decreasing the number of micro-pores in the anodic oxidation coating of an AZ31 magnesium alloy to improve the corresponding corrosion resistance was developed by adding graphene into the electrolyte during the anodic oxidation processing. The microstructure and phase composition investigations indicated that the graphene was successfully incorporated into the anodic oxidation coatings, and the graphene additive dramatically decreased the number of micro-pores in the anodic oxidation coatings. The electrochemical investigations demonstrated that the corrosion resistance of the anodic oxidation coatings improved upon the incorporation of graphene into the coatings. Moreover, the corrosion potential increased by approximately 470 mV and the corrosion current decreased by approximately three orders of magnitude for the coating with a graphene addition of 0.5 g L-1 compared to those of the coating without graphene. Higher concentrations of graphene in the electrolyte caused an increase in the number of micro-pores and a decrease in the uniformity of the coating structures, which resulted in a decrease in the corrosion resistance.
ACKNOWLEDGEMENTS
The authors acknowledge the support of the Ground Plan of Science and Technology Projects of Jiangxi Province (Grant No. KJLD2013078), the Open Project of Jiangxi Provincial Engineering Research Center for Magnesium Alloys 2016 and Innovation and the Entrepreneurship Training Program for College Students of Gannan Normal University 2016. The authors also acknowledge Dr. Zhaoping Liu for his assistance in supplying free graphene.
References
1. M. Laleh, A. SabourRouhaghdam and T. Sharabi, J. Alloys Compd., 496 (2010) 548. 2. B.L. Mordike and T. Ebert, Mater. Sci. Eng. A, 302 (2001) 37.
3. M. Daroonparvar, M.A. Mat Yajid, N.M. Yusof, H.R. Bakhsheshi-Rad, E. Hamzah and H. A. Kamali, J. Alloys Compd., 615 (2014) 657.
4. H. Friedrich and S. Schumann, J. Mater. Process. Technol., 117 (2001) 276.
6. B. Han, D. D. Gu, Y. Yang, L. Fang, G. H. Peng and C. B. Yang, Int. J. Electrochem. Sci, 12 (2017) 374.
7. Y. Song, D.Y. Shan and E.H. Han, Electrochim.Acta. 53 (2007) 2009.
8. F. Fracassi, R. d’Agostino, F. Palumbo, E. Angelini, S. Grassini and F. Rosalbino, Surf. Coat. Technol,. 174-175 (2003) 107.
9. X. Chen, M.A. Easton, N. Birbilis, H.Y. Yang and T.B. Abbott, 11-Corrosionresistant
electrochemical plating of magnesium (Mg) alloys, in: G.-L. Song (Ed.), Corrosion Prevention of Magnesium Alloys, Woodhead Publishing, 2013, pp. 315–346.
10.H.H. Elsentriecy, K. Azumi and H. Konno, Electrochim. Acta, 53 (2007) 1006. 11.D. Zhang, Y. Gou, Y. Liu and X. Guo, Surf. Coat. Technol., 236 (2013) 52.
12.G. Rapheal, S. Kumar, N. Scharnagl and C. Blawert, Surf. Coat. Technol., 289 (2016) 150. 13.H. NasiriVatan, R. Ebrahimi-kahrizsangi and M. Kasiri-asgarani, J. Alloys Compd, .663 (2016)
241.
14.X. Lu, M. Schieda, C. Blawert, K. U. Kainer and M. L. Zheludkevich, Surf.Coat. Technol, 307 (2016) 287.
15.X. Cui, R. Yang, C. Liu, Z. Yu and X. Lin, Trans. Nonfer. Metal. Sci. China., 26 (2016) 814. 16.S. Stojadinovic, N. Tadic, N. Radic, B. Grbic and R. Vasilic, Surf.Coat. Technol., 310 (2017) 98. 17.X. Lu, C. Bawert, M. L. Zheludkevich and K. U. Kainer, Corros. Sci,. 101 (2015) 201.
18.D. V. Mashtalyar, K. V. Nadaraia, S. L. Sinebryukhov and S. V. Gnedenkov, J. Mater. Sci. Technol., doi: 10.1016/j.jmst.2016.09.006
19.G. Lv, H. Chen, W. Gu, W. Feng, L. Li, E. Niu, X. Zhang and S. Yang, Curr. Appl. Phys,. 9 (2009) 324.
20.G. Rapheal, S. Kumar, N. Scharnagl and C. Blawert, Surf. Coat. Technol,. 289 (2016) 150. 21.S. Liu, H.C. Chang, X.M. Gao, W. Liu and Y.Q. Shi, Light Alloy Fabrication Technol. 32 (2004)
42.
22.G. B. Darband, M. Aliofkhazraei, P. Hamghalma and N. Valizade, J. Magne.Alloys, (2017) doi:10.1016/j.jma.201702.004
23.K. S. Novoselov, A. K. Geim, S. V. Morozov, D. Jiang, Y. Zhang and S. V. Dubonos, Sci. 306 (2004) 666.
24.Y.Tong, S.a Bohm and M. Song, Autin. J Nanomed Nanotechnol, 1 (2013) 100.
25.S. Chen, L. Brown, M. Levendorf, W. Cai, S. Y. Ju and J. Edgeworth, ACS Nano., 5 (2011) 1321. 26. F. Wei, W. Zhang, T. Zhang and F. Wang, J. Alloys Compd., 690 (2017) 195.
27. O. khaselev, D. Weiss and J. Yahalom, J. Electrochem. Soc., 146 (1999) 175.
28. L.O. Snizhko, A.L. Yerokhin, A. Pilkington, N.L. Gurevina, D.O. Misnyankina, A. Leyl and A. Matthews, Electrochim. Acta, 49 (2004) 2085.
29. M. Selvam, K. Saminathan, P. Siva, P. Saha and V. Rajendran, Mater. Chem. Phys., 172 (2016) 19. 30. X. Lu, C. Blawert, Y. Huang, H. Ovri and M. L. Zheludkevich, Electrochim.Acta, 187 (2016) 20. 31. X. Fan, Y. Wng, L. Liu and N. Si, Appl. Surf. Sci,. 277 (2013) 272.
32. M. Daroonparvar, M. A. M. Yajid, N. M. Yusof, H. R. Bakhsheshi-Rad, J. Alloys Compd., 688 (2016) 841.
33.J. Zhao, X. Xie and C. Zhang, Corros. Sci., 114 (2017) 146.
34.C. Gu, J. Lian, J. He, Z. Jiang and Q. Jiang, Surf. Coat. Technol., 200 (2006) 5413. 35.Z. Rajabalizadeh and D. Seifzadeh, Prot. Met. Phys. Chem., 50 (2014) 516.
36.M. Khorasanian, A. Dehghan, M. H. Shariat, M. E. Bahrololoom and S. Javadpour, Surf. Coat. Techno. 206 (2011) 1495.
37.H. Guo and M. An, Thin Solid Films, 500 (2006) 186.
38.X. Lu, S.P. Sah, N. Scharnagl, M. Stormer, M. Starykevich, M. Mohedano and C. Blawert, Surf. Coat. Technol. 269 (2015) 155-169.
39.C. M. A. Brett, L. Dias, B. Trindade, R. Fischer and S. Mies, Electrochimica Acta, 51(2006) 1752. 40.S. Hou, R. R. Zhang, S. K. Guan, C. X. Ren, J. H. Gao, Q. B. Lu and X. Z. Cui, Appl. Surf. Sci.,
41.M. Ren, S. Cai, T. Liu, K. Huang, X. Wang, H. Zhao, S. Niu, R. Zhang and X. Wu, J. Alloys Compd., 591(2014) 34.