Elliott, M.A. The attitudes and behaviour of adolescent road users: An application of the theory of
planned behaviour. [Report]
http://
strathprints
.strath.ac.uk/
20272
/
Strathprints is designed to allow users to access the research output of the University
of Strathclyde. Copyright © and Moral Rights for the papers on this site are retained
by the individual authors and/or other copyright owners. You may not engage in
further distribution of the material for any profitmaking activities or any commercial
gain. You may freely distribute both the url (
http://
strathprints
.strath.ac.uk
) and the
content of this paper for research or study, educational, or not-for-profit purposes
without prior permission or charge. You may freely distribute the url
(
http://
strathprints
.strath.ac.uk
) of the Strathprints website.
The attitudes and behaviour of adolescent
road users: An application of the theory of
planned behaviour
Prepared for Road Safety Division, Department for Transport
M A Elliott
This report has been produced by TRL Limited, under/as part of a contract placed by the Department for Transport. Any views expressed in it are not necessarily those of the Department.
CONTENTS
Page
Executive Summary 1
1 Introduction 3
2 Study aims 5
3 Method 5
3.1 Pilot research 5
3.1.1 Eliciting salient behavioural, normative and
control beliefs 5
3.1.2 Question testing 5
3.2 Questionnaires and measures 6
3.2.1 Attitude towards the behaviour 6
3.2.2 Behavioural beliefs 6
3.2.3 Subjective norm 6
3.2.4 Normative beliefs 7
3.2.5 Perceived behavioural control 7
3.2.6 Control beliefs 8
3.2.7 Behavioural intention 8
3.2.8 Reported behaviour 8
3.2.9 General Exposure items 8
3.2.10 Demographics 8
3.2.11 Additional cycle helmet questions 8
3.3 Main study 8
4 Results 10
4.1 Analyses 10
4.2 Producing TPB scales 10
4.3 Descriptive statistics and demographic effects on the
TPB and behaviour variables 11
4.4 Associations between TPB variables and behaviour:
Correlation coefficients 13
4.5 Predictors of behavioural intentions and reported
behaviour 13
4.5.1 Cycle helmet use 13
4.5.2 Using crossings 14
4.5.3 Crossing between parked cars 15
4.5.4 Challenging traffic 16
4.6 Identifying belief targets for road safety interventions:
Assessing the belief-TPB relationships 17
4.6.1 Cycle helmet use 18
Page
4.6.3 Crossing between parked cars 21
4.6.4 Challenging traffic 22
4.6.5 Additional cycle helmet questions 24
5 Summary of results, discussion and conclusions 24
5.1 Demographic effects on adolescents attitudes, subjective norms, perceptions of control, intentions and self-reported
road using behaviour 24
5.2 Support for the TPB relationships 24
5.3 Changing adolescent road user behaviour: Implications for
road safety interventions 25
5.4 Limitations of the present study 26
5.5 Conclusions 26
6 Acknowledgements 26
7 References 26
Notes 29
Appendix A: ‘Cycle helmet use’ questionnaire 31
Appendix B: ‘Using crossings’ questionnaire 39
Appendix C: ‘Crossing between parked cars’ questionnaire 47
Appendix D: ‘Challenging traffic’ questionnaire 55
Appendix E: Instructions and procedure for administering
questionnaires 63
Appendix F: Age, sex and area distributions by target
behaviour 65
Appendix G: Results of factor analyses 66
Appendix H: Means and standard deviations for all
TPB items 68
Appendix I: Means and standard deviations for all belief
items by age, sex and area 69
Abstract 81
Executive Summary
1 To investigate how TPB variables (attitudes, subjective norms, perceptions of control, and behavioural
intentions) and reported behaviour (with respect to each target behaviour) vary as a function of demographic variables.
2 To determine the variables (exposure variables and demographic variables as well as TPB variables) that are the independent predictors of behavioural intentions and reported behaviour in order to identify, for each target behaviour, which variables may require changing to bring about desirable corresponding changes in behavioural intentions and behaviour.
3 To identify specific beliefs underlying attitudes, subjective norms and perceived behavioural control that might be useful targets for road safety countermeasures that aim to encourage desirable behaviour and
discourage undesirable behaviour.
Four questionnaires (one for each target behaviour) were designed, based on pilot work. Each questionnaire contained items to measure TPB variables, self-reported behaviour, and general exposure and demographic variables. The main part of the study involved a large-scale survey in which a total of 2,457 children aged 11-16 completed the questionnaires. 564 respondents completed the ‘cycle helmet use’ questionnaire, 657 respondents completed the ‘using nearby crossings’ questionnaire, 619 respondents completed the ‘crossing from between parked cars’ questionnaire, and 617 completed the ‘challenging traffic’ questionnaire.
Multivariate analysis of variance showed that, for each target behaviour, adolescents’ attitudes, subjective norms, perceived control, behavioural intentions and reported behaviour differed as a function of demographic characteristics. Generally, male adolescents and older adolescents reported attitudes and behaviour that were more undesirable from a road safety perspective than did female and younger adolescents (e.g. they reported more negative attitudes towards the commission of the more safe behaviours and more positive attitudes towards the less safe behaviours). There were also marked differences between respondents sampled from urban and rural schools with respect to cycle helmet use attitudes and behaviour. Respondents from rural schools reported more positive attitudes and intentions to use cycle helmets when riding a bike than did respondents from urban schools, and they also perceived more social pressure to wear a cycle helmet, perceived that they had more control over their performance of the behaviour and reported wearing a cycle helmet more often.
The results also provided strong support for the relationships posited by the TPB, with respect to each target behaviour. In each case, hierarchical multiple regression analysis showed that adolescents’ attitudes, subjective norms and perceptions of control led to large increments to explained variance in behavioural intentions, over and above demographic and exposure variables. Intentions and perceived control led to large increments to explained variance in reported behaviour, again, over and In 2002 in Britain, there were over 11,700 child pedestrian
and cyclist casualties (between the ages of 11-16) and over 2,000 of those children were killed or seriously injured. A better understanding of what makes children and
adolescent road users particularly vulnerable is required to develop countermeasures to improve their safety.
Interventions may need to be targeted at drivers and riders of motor vehicles in an attempt to change their behaviour (e.g. to make them more aware of child pedestrians and to adopt appropriate behaviour). However, it could also be argued that children in this age group have a large role to play with respect to their own road safety, and desirable improvements may also require changing their behaviour.
TRL was commissioned by the Department for
Transport’s (DfT) Road Safety Division (RSD) to carry out research into the attitudes and behaviour of adolescent road users (11-16 years old). The project was carried out in two stages. The purpose of stage 1 was to study the road using behaviour that may contribute towards the safety of adolescent road users. In stage 2 (reported here), the theory of planned behaviour (TPB) was used to study adolescents’ attitudes towards a selection of specific behaviours identified as being important in terms of road safety.
The TPB is a theoretical account of how a number of variables combine to determine behaviour. The theory posits that people’s attitudes (global positive or negative evaluations about performing the behaviour), subjective norms (perceived social pressure to perform the behaviour) and perceptions of control (the perceived ease or difficulty of performing the behaviour) determine intentions to behave. Behavioural intention is then seen, along with perceived control, as the proximal determinant of behaviour. The theory views attitudes, subjective norms and perceived control as each being determined by two interacting sets of beliefs. Attitudes are determined by perceptions about the likelihood of particular outcomes occurring (outcome beliefs) and the evaluation of those outcomes (outcome evaluations). Subjective norm is determined by perceived social pressure from different groups of people (referent beliefs) and motivation to comply with those groups of people. Finally, perceived behavioural control is determined by beliefs about the frequency of encountering factors that may make performing the behaviour easier or more difficult (control frequency beliefs) and beliefs about the power of those factors to inhibit or facilitate the behaviour (control power beliefs). The inherent usefulness of the model is that it can be used to inform the development of remedial measures that aim to alter behaviour through changing beliefs, attitudes, subjective norms, perceived control and intentions.
above the demographic and exposure variables. The effects of the demographic/exposure variables on intentions and behaviour were mostly mediated by the TPB, suggesting that age differences in intentions and behaviour, for example, were due to differences in attitudes, subjective norms, perceived control and intentions. The TPB variables were much more strongly associated with intentions and with reported behaviour than were the demographic/exposure variables. Attitudes, subjective norms and perceived control were consistently strong and statistically significant independent predictors of
intentions, and intentions were consistently strong and statistically significant predictors of behaviour.
Multiple regression analyses were also conducted to identify specific beliefs predictive of adolescents’
attitudes, subjective norms and perceptions of control (e.g. to investigate what beliefs underpin adolescents’ attitudes towards cycle helmet use, using crossings, crossing between parked cars and challenging traffic). Across all four behaviours investigated in this study, outcome beliefs and outcome evaluations offered a reasonably good and statistically significant prediction of attitude. Similarly, beliefs about pressure from social referents and motivation to comply with those referents predicted subjective norm;
Beliefs important in the prediction attitude
Cycle helmet use Using crossings Crossing between parked cars Challenging traffic
If I wore a cycle helmet If I walked to a nearby If I crossed between If I crossed the road and made
when riding a bike… crossing… parked cars… the car driver slow down it would…
It will protect my head. It will make it easier It will increase my chances Make the car driver angry. to cross the road. of getting run over.
It would make me look childish. It will make me feel safer I will not have to go too far Make me feel good. while crossing the road. out of my way.
It would make me feel safer It will take me too far out I will not be able to see cars Increase the chances of
when riding. of my way. coming very well. an accident.
It would be annoying because I – Drivers would not be able _
will have to carry it around with to see me.
me when I get off my bike.
– – Parked cars might start to –
move and hit me.
Beliefs important in the prediction of perceived control
Cycle helmet use Using crossings Crossing between parked cars Challenging traffic
Factors believed to make wearing Factors believed to make using Factors believed to make Factors believed to make a cycle helmet more or less likely? crossings more or less likely? crossing between parked cars challenging traffic more or
more or less likely? less likely?
Busy traffic conditions. Fast moving traffic. The place where you are going is directly opposite you on the other
side of the road. Being late/in a hurry. Going on long bike rides. It being dark. Busy traffic conditions. Your friends crossing the road.
Going on short bike rides. – It being dark. Being on a busy road.
Riding to school. – You can see a gap in traffic. –
and control frequency and power beliefs significantly predicted perceived control.
Summary tables below show, for each target behaviour, which beliefs were the main predictors of attitudes and perceived control, respectively. The social referents that were consistently predictive of subjective norms across all behaviours were ‘friends’ and ‘parents’. Thus, the more social pressure adolescents perceived from these referents, the more social pressure to perform the target behaviours they perceived overall. The implication of these findings was that parental and peer delivery of road safety interventions might be an effective method for promoting desirable road safety behaviour.
So long as the relationships posited by the TPB are causal, then the results of the study suggested that
changing the beliefs underlying adolescents’ attitudes (and subjective norms and perceptions of control) should lead to corresponding changes in attitudes, intentions and
behaviour. Persuasive messages or other types of
1 Introduction
In Britain, pedestrian and pedal cycle accidents represent the biggest cause of accidental injury death to children and adolescents (e.g. Accidental Injury Task Force, 2002; Avery and Jackson, 1993). Despite a decline in casualty rates for children aged 0-15 over the last ten years, the absolute numbers of casualties remains high and in the 11-16 year old adolescent age group casualty rates have changed little. In 2002, within the 11-16 year old age group there were over 11,700 pedestrian and cyclist casualties in which over 2,000 children were killed or seriously injured (DfT, 2003). Involvement in pedestrian accidents peaked at 12 years of age and for cyclist accidents it peaked at age 13. These ages approximately coincide with moving from primary to secondary school education, when children often start to have greater levels of exposure (Lynam and Harland, 1992).
In March 2000 the Government issued its road safety and casualty reduction strategy for the next 10 years –
‘Tomorrow’s Roads - Safer for Everyone’ (DETR, 2000). This document set a target for halving the number of children killed and injured on Britain’s roads by the year 2010.
A better understanding of what makes adolescent road users particularly vulnerable is required to develop remedial action and help achieve this target. Remedial action may need to take place within a legislation, enforcement or engineering context (e.g. more 20mph speed limits in areas where there are often children playing, or the development of vehicles that are more ‘pedestrian friendly’). However, changing behaviour via training, education and publicity may also have highly beneficial results. To improve the safety of adolescent road users these interventions may need to be targeted at drivers and riders of motor vehicles in an attempt to change their behaviour (e.g. to make them more aware of child
pedestrians and to adopt appropriate behaviour). However, it could also be argued that children in this age group have a large role to play with respect to their own road safety, and desirable improvements may also require changing their behaviour.
Research indicates that, by adolescence, the necessary skills to function safely in the road environment have been acquired (e.g. Whitebread and Neilson, 1996). This has led researchers to suggest that it is not the failure to acquire adequate skills but the failure to employ these skills that may be the major determinant of accident involvement (Evans and Norman, 2002). Tight, Carsten, Kirby, Southwell and Leake (1990) identified three main reasons for the failure of adolescents to employ their ‘road’ skills: being distracted, being in a hurry and being thoughtless. Previous research studies have also demonstrated that adolescent road users do engage in a number of behaviours relating to deliberate ‘risk taking’, errors of perception and general deviation from what is considered a ‘safe’ course of action (e.g. Elliott and Baughan, 2003a, 2003b; System Three, 1998; West, Train, Junger, Pickering, Taylor, and West, 1998). Such behaviour may contribute to
adolescents’ accidents as road users and it is likely that changing these behaviours would improve safety.
The question then arises, ‘How can adolescents’ road user behaviour be modified?’ To address this question, there is a need to identify behaviours carried out by adolescent road users that represent concerns from a road safety point of view. Once these examples of behaviour have been identified there is then a need to understand why they are carried out so ways can be found to encourage ‘safer’ behaviour. Research has shown that demographic and exposure variables are related to adolescent road user behaviour (e.g. Elliott and Baughan, 2003). However, this knowledge is of limited use from a practical road safety point of view given variables such as age and sex are not amenable to change via road safety interventions.
Therefore, there is a need to identify variables that (a) can explain the relationships between demographic/exposure variables and behaviour, (b) are strongly associated with behaviour - i.e. variables that have good predictive validity and (c) are amenable to being changed. Social cognition models offer useful theoretical approaches to
understanding why people carry out (or do not carry out) certain behaviours. One approach that is well suited to understanding behaviour is provided by the theory of planned behaviour (TPB; Ajzen, 1985).
In the TPB (see Figure 1) peoples intentions to pursue a course of action are the main determinants of their behaviour. Behavioural intentions are then determined independently by three variables. First, attitude towards the behaviour is an individual’s global positive or negative evaluations about performing the behaviour in question (e.g. the extent to which people think that it is good or bad
to perform a behaviour). Second, subjectivenorm is an
individual’s perception about the amount of social pressure that they are likely to receive to engage in the target behaviour. Finally, perceived behavioural control is an individual’s perception regarding the ease or difficulty of performing the target behaviour. As well as being a determinant of intention, perceived control is, along with intention, held to be a direct predictor of behaviour. The direct relationship between perceived control and behaviour is dependent on perceptions of control being accurate (Ajzen, 1991).
In the TPB, attitudes, subjective norms and perceived control are each, in turn, determined by two interacting sets of beliefs. This is consistent with the literature on expectancy-value theory (e.g. Peak, 1955; Schoemaker, 1982). Attitudes are determined by behavioural beliefs -the product of -the perceived likelihood of particular outcomes occurring (outcome beliefs) and the evaluation of those outcomes (outcome evaluations). Normative beliefs are posited as antecedents of subjective norm and are the product of perceived social pressure from different groups of people, or referents, (referent beliefs) and motivation to comply with those referents. Finally, perceived behavioural control is posited to be determined by control beliefs - the product of the perceived frequency of encountering salient inhibiting or facilitating factors (control belief frequency) and the perceived power of those factors to inhibit or facilitate behaviour (control
The effects on behaviour of variables external to the TPB (e.g. demographics and exposure) are thought to be mediated through the components of the model. In other words, people of different ages, for example, are thought to behave differently because of differences in their attitudes, subjective norms, perceptions of control, and intentions.
From an applied perspective, the inherent usefulness of the TPB to road safety is that it can be used to inform interventions that aim to change behaviour. By applying the model to a given behaviour it is possible to identify specific beliefs associated with attitudes, subjective norms and perceived control, which can then be targeted in road safety interventions that aim to bring about desirable changes in these variables. Assuming that reasonably strong support for the model’s relationships can be found, changing these variables may then have desirable impacts
on intentions and corresponding behaviour2.
Many studies conducted across a variety of behavioural domains have provided strong support for the TPB (for reviews see Ajzen, 1988, 1991; Armitage and Conner, 2001; Eagly and Chaiken, 1993). Within the domain of traffic psychology support has also been provided for the model with respect to a number of car driving behaviours (e.g. Elliott, Armitage and Baughan, 2003; Manstead and Parker, 1996; Parker, Manstead, Stradling, Reason, and Baxter, 1992; Parker, Manstead, and Stradling, 1995), motorcycle riding behaviours (e.g. Rutter, Quine, and Chesham, 1995), and modal choices (e.g. Verplanken, Aarts, van Knippenberg, and Moonen, 1998; Verplanken, Aarts, van Knippenberg, and van Knippenberg, 1994). However, there are only few examples in the published literature of research studies applying the TPB and other social cognition models to adolescents’ behaviour as road users (e.g., Quine, Rutter, and Arnold, 1998; Evans and Norman, 2002). When one considers the potentially large number of safety-related road using behaviours this group of road users carries out (see Elliott and Baughan, 2003a, 2003b), it is reasonable to argue that further research is
needed using the TPB to develop road safety countermeasures in this area.
TRL was commissioned by the Department for
Transport’s (DfT) Road Safety Division (RSD) to carry out a programme of research into adolescent road users. This research formed part of the DfT’s ‘Child Development and Road Safety Education Research Programme - Phase III’. The programme of research conducted by TRL
encompassed three related projects. One project was concerned with the analysis of police fatal road accident files to explore the factors relating to young adolescent road fatalities (see Sentinella and Keigan, in press). Another was concerned with the behaviour of adolescent children in groups (see Chinn, Elliott, Sentinella and Williams, 2004). The final project involved the study of the attitudes and behaviour of adolescent road users and was carried out in two stages. Stage 1 involved a study adolescents’ road using behaviour. The aims of stage 1 were to identify behaviours that may contribute towards the safety of adolescent road users and to investigate how the performance of these behaviours vary as a function of demographic characteristics (see Elliott and Baughan, 2003a for full details). In stage 2, the TPB was used to study a selection of specific behaviours identified as being important in terms of road safety, in an attempt to
understand why they are carried out and to identify specific beliefs which can be targeted by remedial measures to to encourage ‘safer’ behaviour.
This report describes the research carried out in stage 2 of the ‘Adolescent Attitudes’ project. The report is presented in five main sections. The next section (2) outlines the aims of the survey. Section 3 outlines the method. Section 4 describes the analyses of the data and the results obtained. Finally Section 5 presents the summary and conclusions of the study.
Variables External to the Model Behavioural Beliefs (Outcome Beliefs X Outcome Evaluations) Normative Beliefs (Referent Beliefs X Motivation to Comply) Control Beliefs (Control Frequency X Control Power) Attitude towards the Behaviour Subjective Norm Behavioural Intention Behaviour Perceived Behavioural Control
2 Study aims
The main aim of this study was to use the TPB to investigate adolescents’ (aged 11-16 years) attitudes towards four specific examples of road using behaviour which were identified as being important in terms of road
safety3. The four behaviours, described in detail below (see
Section 3.2), were:
Cycle helmet use.
Using nearby crossings to cross the road.
Crossing from between parked cars.
Challenging traffic.
Specific aims of the study were as follows:
1 To investigate the effects of demographic variables on adolescents’ attitudes, subjective norms, perceived control, behavioural intentions and reported behaviour with respect to each target behaviour.
2 To determine the variables (exposure variables and demographic variables as well as TPB variables) that are the independent predictors of behavioural intentions and reported behaviour in order to identify, for each target behaviour, which variables may require changing to bring about desirable changes in behavioural intentions and behaviour.
3 To identify specific beliefs underlying attitudes, subjective norms and perceived behavioural control that might be useful targets for road safety countermeasures that aim to encourage desirable behaviour and
discourage undesirable behaviour.
3 Method
3.1 Pilot research
Four questionnaires were designed in this study - one for each of the target behaviours: cycle helmet use, using nearby crossings, crossing from between parked cars and challenging traffic. Each questionnaire contained items designed to measure TPB variables, reported frequency of engaging in the behaviour, and demographic variables. Full details of questionnaire measures are provided below (see Section 3.2). The following two sections of this report briefly describe the pilot work that was conducted to develop the four questionnaires.
3.1.1 Eliciting salient behavioural, normative and control beliefs
Following standard procedure for conducting TPB research (see Ajzen, 2000), semi-structured pilot
interviews were carried out with a sample of children from the target population (N=20) to elicit the behavioural, normative and control beliefs held by 11-16 year old children with respect to each of the four target behaviours. The interview sample comprised eight 11-12 year olds (4 males and 4 females), eight 13-14 year olds (4 males and 4 females) and four 15-16 year olds (2 males and 2 females). Each interview lasted approximately 50 minutes.
Children taking part in the pilot interviews were sampled from a local secondary school in Crowthorne, near TRL.
In the interviews, each of the target behaviours were described to the participants in turn. Then, in line with standard procedures used in TPB research, the behavioural beliefs, normative and control beliefs associated with these behaviours were elicited. Behavioural beliefs for each target behaviour were elicited by asking participants the following questions:
What advantages are there (or would there be) for you in
[performing the target behaviour]?
What disadvantages are there (or would there be) for
you in [performing the target behaviour]?
Is there anything else you think is good or bad about
[performing the target behaviour]?
Normative beliefs for each target behaviour were elicited by asking these questions:
Is there anyone who would approve of you [performing
the target behaviour]?
Is there anyone who would disapprove of you
[performing the target behaviour]?
Is there anyone else who would approve or disapprove
of you [performing the target behaviour]?
Finally, control beliefs for each target behaviour were elicited by asking the following questions:
What would make you [perform the target behaviour]
more often?
What would make you [perform the target behaviour]
less often?
Are there any other things you can think of that would
make you [perform the target behaviour] more often/less often?
The elicited beliefs were incorporated into the questionnaires used in the main part of this study (see -Section 3.2).
3.1.2 Question testing
Following the design of the four questionnaires, a small question testing study was carried out to determine whether children in the target population could easily and meaningfully interpret and respond to the questionnaire items. The question testing exercise was carried out in three focus groups with children aged 11-16. One focus group was carried out with 11-12 year olds (N=10; 6 males and 4 females), one was carried out with 13-14 year olds (N=7; 3 males and 4 females), and one was carried out with 15-16 year olds (N=8; 4 males and 4 females). Each focus group lasted approximately 50 minutes. Participants for this question testing exercise were sampled from a local secondary school in Wokingham, near TRL.
completion of the questionnaires, participants were asked the following questions:
Were there any questions that you could not understand,
could not answer or found difficult to answer?
If so, what were the questions?
Why could you not understand/answer the questions?
How could the problems be solved? (participants were
asked for their opinions on how the items that were difficult to understand should be worded).
To understand how the questionnaire items were being interpreted, participants were also asked, for each, question:
What do you think the question meant?
What information did you base your answer on? / How
did you decide what answer to give?
Overall, children had no problems understanding the questionnaire items and seemed to be interpreting the items appropriately. Minor problems that children raised with understanding and responding to the questionnaire items were addressed by making a small number of amendments to the questionnaires.
3.2 Questionnaires and measures
As described above, four questionnaires were designed for this study, one for each of the target behaviours. The four questionnaires are presented in Appendix A, B, C and D. Each questionnaire was similar in content. For the using crossings, crossing from between parked cars and challenging traffic questionnaires, respondents in the main part of this study were required to answer the TPB and behaviour items in relation to a hypothetical scenario - i.e. when answering the questions,
respondents had to imagine themselves in the situation that was described to them. For cycle helmet use, no hypothetical scenario was used. The scenarios used for using crossings, crossing from between parked cars and challenging traffic were as follows:
Using crossings
Imagine it is term time in the summer. You are out walking and you need to cross a road. You are at a place on the road where there is no crossing. There is a crossing further up the road, but it would take you a minute or so to walk to it. You could either walk to the crossing to cross the road or you could cross where you are. This
questionnaire asks you what you think about walking to the crossing to cross the road.
Crossing from between parked cars
Imagine it is term time in summer. You are out walking and you need to cross a road. You are at a place where there are parked cars. If you cross here you will need to step out from between the parked cars to cross. There is a place to cross a little further up where there are no parked cars, but it would take you a minute or so to walk there. You could either cross from between the parked cars or
you could walk up the road to where there are none and cross there. This questionnaire asks you what you think about crossing from between the parked cars.
Challenging traffic
Imagine it is term time in summer. You are out walking with a group of your friends and you need to cross a road. You can see there is a car coming further down the road. If you cross there and then you will be able to cross but you would make the car driver slow down. You could either cross the road making the car driver slow down or you could wait for the car to pass and then cross. This questionnaire asks you what you think about crossing the road and making the car driver slow down.
The following items were included in all four
questionnaires unless specified otherwise. All TPB items used in the questionnaires were standard items used widely in TPB research.
3.2.1 Attitude towards the behaviour
Eight items designed to measure attitude towards the behaviour were used. Respondents were presented with the following statement: ‘For me, if I [performed the target behaviour] it would be…’ They were then presented with eight pairs of adjectives on semantic differential scales which they used to complete the sentence. Each item was rated on 7-point bipolar scales, scored from -3 to +3. The eight pairs of adjectives were:
‘Bad / Good’,
‘Harmful / Beneficial’,
‘Negative / Positive’
‘Unnecessary / Necessary’
‘Unsafe / Safe’
‘Worthless / Valuable’
‘Stupid / Sensible’
‘Unenjoyable / Enjoyable’’
3.2.2 Behavioural beliefs
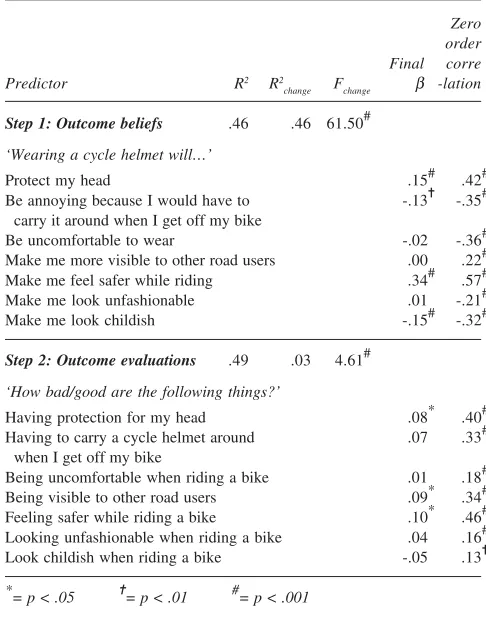
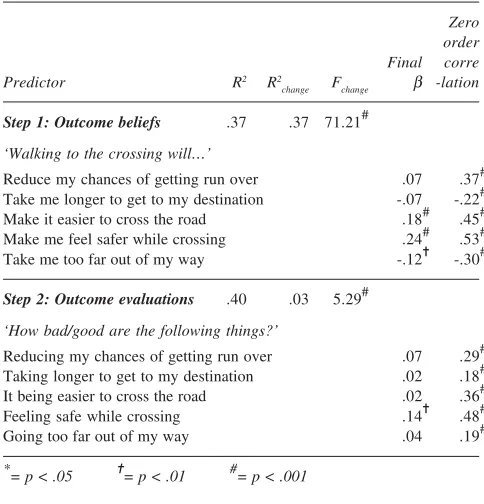
Outcome beliefs were measured by asking respondents to rate the extent to which they agreed or disagreed with a number of statements about whether certain outcomes would arise from performing the target behaviours. Outcome evaluations were measured by asking respondents to rate how good or bad these various outcomes would be for them. All outcome beliefs and outcome evaluations were measured using 7-point bipolar
scales (-3 to +3), anchored ‘Strongly disagree/Strongly
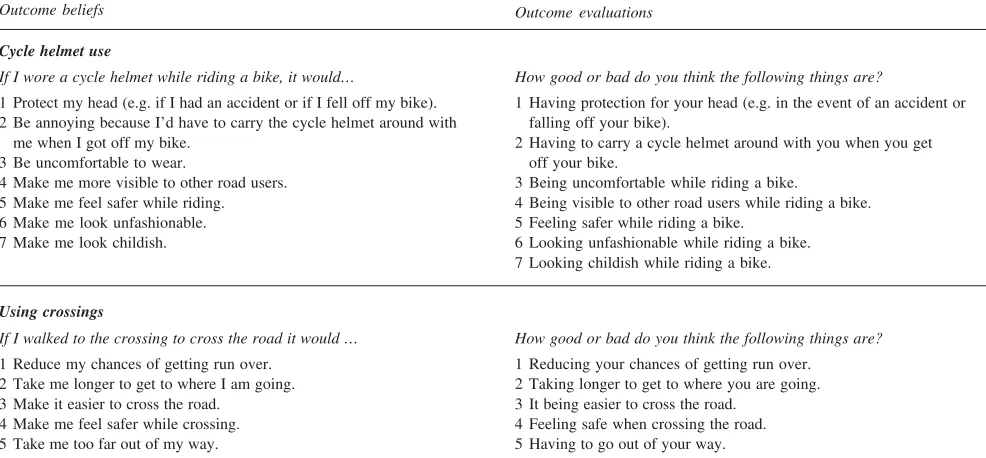
agree’ and ‘Bad/Good’, respectively. The outcome belief and outcome evaluation items were different across the four types of questionnaires. All the outcome belief and evaluation items used in each of the questionnaires are presented in Table 1.
3.2.3 Subjective norm
‘I would feel under social pressure to [perform the target
behaviour]’ (‘Strongly disagree/Strongly agree’).
‘How much would the people who are important to you
want you to [perform the target behaviour]?’ (‘Not at
all/Very much’).
‘How often do you think the people who are important
to you would [perform the target behaviour]?’ (‘Never/
Always’).
‘Would the people who are important to you approve or
disapprove of you [performing the target behaviour]?’ (‘Disapprove/Approve’).
3.2.4 Normative beliefs
Referent beliefs were measured by asking respondents to
rate how much different groups of people (or referents)
would want them to perform the target behaviours.
Motivation to comply was measured by asking respondents to rate how much they wanted to go along with the views of these people. Referent belief and motivation to comply items were both measured using
7-point scales ranging from +1 (‘Not at all’) to +7 (‘Very
much so’). The same referent belief and motivation to comply items were used in each of the four questionnaires and they are presented in Table 2.
3.2.5 Perceived behavioural control
Four items, which were designed to measure perceived control, were used in each questionnaire. Each item was rated by respondents on 7-point unipolar scales (+1 to +7). The items were:
‘If I [performed the target behaviour] it would be…’
[image:12.595.50.543.74.303.2](’Difficult/Easy’);
Table 1 Outcome belief and outcome evaluation items used in the questionnaires
Outcome beliefs
Cycle helmet use
Using crossings
How good or bad do you think the following things are?
1 Having protection for your head (e.g. in the event of an accident or falling off your bike).
2 Having to carry a cycle helmet around with you when you get off your bike.
3 Being uncomfortable while riding a bike.
4 Being visible to other road users while riding a bike. 5 Feeling safer while riding a bike.
6 Looking unfashionable while riding a bike. 7 Looking childish while riding a bike. If I wore a cycle helmet while riding a bike, it would…
1 Protect my head (e.g. if I had an accident or if I fell off my bike). 2 Be annoying because I’d have to carry the cycle helmet around with
me when I got off my bike. 3 Be uncomfortable to wear.
4 Make me more visible to other road users. 5 Make me feel safer while riding. 6 Make me look unfashionable. 7 Make me look childish.
If I crossed the road making the car driver slow down …
1 It would make the car driver angry.
2 It would make me feel good to make the driver have to slow down. 3 My friends and I would get to where we were going quicker than
if we waited for the car to pass. 4 The car driver would have a go at us.
5 It would increase the chances of my friends and I being involved in an accident.
6 I would enjoy making the car driver slow down.
How good or bad do you think the following things are?
1 Increasing your chances of getting run over. 2 Not having to go out of your way.
3 Not being able to see cars coming very well. 4 Taking less time to get to where you are going. 5 Drivers not being able to see you.
6 Parked cars starting to move when I am stood between them waiting to cross the road.
7 Having to step out into the road from between parked cars to see clearly before crossing.
If I walked to the crossing to cross the road it would …
1 Reduce my chances of getting run over. 2 Take me longer to get to where I am going. 3 Make it easier to cross the road.
4 Make me feel safer while crossing. 5 Take me too far out of my way.
How good or bad do you think the following things are?
1 Reducing your chances of getting run over. 2 Taking longer to get to where you are going. 3 It being easier to cross the road.
4 Feeling safe when crossing the road. 5 Having to go out of your way.
Crossing between parked cars
If I crossed the road from between the parked cars …
1 It would increase my chances of getting run over. 2 I would not have to go out of my way to cross the road. 3 I would not be able to see cars coming very well. 4 It would take me less time to get to where I am going. 5 Drivers would not be able to see me.
6 The parked cars might start to move and hit me. 7 I would have to step out into the road to see clearly.
Challenging traffic
How good or bad do you think the following things are?
1 Making the car driver angry.
2 Making myself feel good by making the driver have to slow down. 3 My friends and I getting to where we are going quicker.
4 The car driver having a go at us.
5 Increase the chances of my friends and I being involved in an accident.
‘It would be entirely up to me whether or not I
[performed the target behaviour]’ (‘Strongly disagree/
Strongly agree’);
‘I would be able to [perform the target behaviour]’
(‘Strongly disagree/Strongly agree’); and
‘If you wanted to, could you easily [perform the target
behaviour]’ (‘Definitely no/Definitely yes’).
3.2.6 Control beliefs
Control frequency beliefs were measured by asking respondents to rate how often they thought they would encounter various facilitating and inhibiting factors in future. Control power was assessed by asking respondents to rate how much more or less likely their performance of the target behaviours would be if these factors were encountered. Both the control frequency and control power items were measured using 7-point scales (+1 to +7) and
they were anchored ‘Never/Very often’ and ‘Less likely/
More likely’, respectively. The control frequency and control power items were different across the four types of questionnaires. All the control frequency and control power items used in each of the questionnaires are presented in Table 3.
3.2.7 Behavioural intention
In each questionnaire, four items were used to measure intention to perform the target behaviours. Each item was rated on a 7-point bipolar scale (-3 to +3). The four items were:
‘Do you intend to [perform the target behaviour]?’
(‘Definitely no/Definitely yes’);
‘Will you try to [perform the target behaviour]?’
(‘Definitely no/Definitely yes’);
‘How likely or unlikely is it that you will [perform the
target behaviour]?’ (‘Unlikely/Likely’); and
‘I want to [perform the target behaviour]?’ (‘Strongly
disagree/Strongly agree’).
3.2.8 Reported behaviour
In each questionnaire, one item was used to measure respondents reported behaviour. This item was measured on a 7-point unipolar scale (+1 to +7) and was:
‘How often do you [perform the target behaviour]?’
(‘Never/Nearly all the time’).
3.2.9 General Exposure items
One item, which was used in the stage 1 study to measure overall exposure, was included in each questionnaire in this study. This item was measured on a 5-point Likert scale. For cycle helmet use, the item was:
‘How often do you go out and ride a bike’ (‘Never/
Every day’).
For the remaining three road-crossing behaviours, the item was worded as:
‘How often do you go out on foot (e.g. go out walking,
going for a walk, just hanging around?)’ (‘Never/Every
day’).
A further three items, also used in the stage 1 research, to elicit information about how often respondents are accompanied by different types of people when they go out on foot or on a bike were included in the
questionnaires. These items were measured on 5-point Likert scales and were:
‘When you go out on a bike/on foot, how often are you:
1 With adults’ (‘Never/Every day’).
2 With friends’ (‘Never/Every day’).
3 On your own’ (‘Never/Every day’).
3.2.10 Demographics
Measures of the following demographic variables were included in each of the questionnaires: age (coded as 1 = 11-12 years old, 2 = 13-14 years old, and 3 = 15-16 years
old) and sex (coded as 1 = Male and 2 = Female).
3.2.11 Additional cycle helmet questions
Respondents answering the cycle helmet questionnaire were asked, in addition to the above mentioned questions:
‘Do you own a cycle helmet?’ (‘Yes/No’); and
‘If you do not own a cycle helmet is it because:
1 You don’t want one’ (‘Yes/No’).
2 You can’t afford one’ (‘Yes/No’).
3 You haven’t got around to buying one’ (‘Yes/No’).
3.3 Main study
Pupils from six secondary schools, all located within England, completed the questionnaires. The sample of
Table 2 Referent belief and motivation to comply items used in the questionnaires
How much do you want to go along with what these people want you to do?
1 School teachers. 2 Your friends. 3 Other people at school. 4 The police.
5 Car drivers. 6 Your parents.
7 Other people in your family. How much do you think the following people want you to [perform the
target behaviour]?
1 School teachers. 2 Your friends. 3 Other people at school. 4 The police.
5 Car drivers. 6 Your parents.
7 Other people in your family.
schools comprised three schools from urban areas and three schools from rural areas. The three ‘urban schools’ were selected from three different areas in the country: Manchester, Bristol, and Birmingham. The three ‘rural schools’ were also selected from three areas: rural areas in Lancashire, Berkshire and Hampshire. Schools received a £250 gratuity payment for their participation in the study.
Within each school participating in the study, pupils from Year 7 (11-12 year olds), Year 9 (13-14 year olds) and Year 11 (15-16 year olds) self-completed
questionnaires under pseudo exam conditions. TRL staff visited the schools and administered the questionnaires in lesson time to pupils. Children completed one
questionnaire only. Thus approximately a quarter of the sample were given the ‘cycle helmet use’ questionnaire to
complete, approximately a quarter were given the ‘using crossings’ questionnaire, approximately a quarter were given the ‘crossing between parked cars’ questionnaire and approximately a quarter were given the ‘challenging traffic’ questionnaire. Instructions on how to complete the questionnaires were contained on the first page of each questionnaire (see Appendices A-D). In addition teachers gave verbal instructions to pupils. The main parts of these verbal instructions are summarised below (see Appendix E for the full protocol used in the main survey):
We want you all to complete a questionnaire about your road safety attitudes and behaviour. IT IS NOT A TEST ABOUT ROAD SAFETY. Researchers from the Transport Research Laboratory just want to find out what pupils of your age honestly think about a number
Table 3 Control frequency belief and control power belief items used in the questionnaires
Control frequency beliefs Control power beliefs
Cycle helmet use
Challenging traffic
Would the following things make you more likely or less likely to walk to cross the road from between the parked cars if you were in a similar situation to that described in the example?
1 If the traffic was moving fast (e.g. the road had a fast speed limit). 2 If the place you were going to was just on the other side of the road
-directly opposite you.
3 If you were in a hurry or late for something. 4 If there was a lot of traffic.
5 If it was dark.
6 If people were waiting for you on the other side of the road. 7 If you could see a gap in the traffic.
In future, how often do you expect to be in a similar situation to that described in the example when:
1 Traffic is moving fast (e.g. the road has a fast speed limit).
2 The place you are going to (e.g. a shop) is just on the other side of the road - directly opposite you.
3 You are in a hurry or late for something. 4 There is a lot of traffic around. 5 It is dark.
6 People are waiting for you on the other side of the road. 7 You will be able to see there is a gap in traffic.
Crossing between parked cars
Would the following things make you more likely or less likely to walk to the crossing to cross the road if you were in a similar situation to that described in the example?
1 If the traffic was moving fast (e.g. the road had a fast speed limit). 2 If the place you were going to was just on the other side of the road
-directly opposite you.
3 If you were in a hurry or late for something. 4 If it was dark.
5 If people were waiting for you on the other side of the road. 6 If there was a lot of traffic.
In future, how often do you expect to be in a similar situation to that described in the example when:
1 Traffic is moving fast (e.g. the road has a fast speed limit).
2 The place you are going to (e.g. a shop) is just on the other side of the road - directly opposite you.
3 You are in a hurry or late for something. 4 It is dark.
5 People are waiting for you on the other side of the road. 6 There is a lot of traffic around.
Using crossings
Would the following things make you more likely or less likely to wear a cycle helmet while riding a bike?
1 If you were riding in busy traffic conditions. 2 If you were riding around roads close to home. 3 If you were going on long bike rides. 4 If you were going on short bike rides.
5 If you were about to go out on your bike and you were in a hurry. 6 If you were riding to school.
7 If you did not have or could not find your cycle helmet.
Would the following things make you more likely or less likely to walk to cross the road and make the car driver slow down if you were in a similar situation to that described in the example?
1 If my friends and I were in a hurry or late for something. 2 If my friends crossed.
3 If the car was going really fast.
4 If I was dared to cross by one of my friends. 5 If we were on a busy road.
In future, how often do you expect to be in a similar situation to that described in the example when:
1 You and your friends are in a hurry or late for something. 2 Your friends cross the road and make the car driver slow down. 3 The car is going really fast.
4 You are dared to cross by one of your friends. 5 You and your friends are on a busy road. In future, how often do you expect to:
1 Ride a bike in busy traffic conditions. 2 Ride a bike around roads close to home. 3 Go on long bike rides.
4 Go on short bike rides.
5 Go out on you bike when you are in a hurry. 6 Ride a bike to school.
of issues. It is therefore very important that you are honest when answering the questions. This is
completely confidential - You are not required to give your name on the questionnaire.
Please complete the questionnaire on your own. Do not talk to other people when completing the questionnaire. You need to answer the questions by ticking boxes to show your answers.
To help you complete your questionnaires, there is an example question on the first page along with
instructions on how to answer it. You, therefore, need to read the instructions on the first page of the
questionnaire carefully before completing it. [Note: pupils completing the using crossings, crossing between parked cars and challenging traffic questionnaires were also instructed to read the hypothetical scenario on the first page of the questionnaire which they had to imagine themselves in].
A target was set to achieve 2,000 questionnaire responses from the present survey, with at least 500 questionnaires being completed for each of the four target behaviours. This target was exceeded with data being collected for a total of 2,457 respondents. 23% of the total sample (n=564)
completed the ‘cycle helmet use’ questionnaire, 27% (n=657) completed the ‘using crossings’ questionnaire, 25% (n=619) completed the ‘crossing between parked cars’ questionnaire and 25% (n=617) completed the ‘challenging traffic’ questionnaire. Tables 4 and 5 respectively show the age and sex distribution of the total sample, and the distribution of the total sample across area type (rural versus urban).
Distributions across age, sex and area type for the four target behaviours individually are presented in Appendix F.
factor analysis was used to inform the computation of TPB variables for use in the data analysis (see below) and multivariate analysis of variance (MANOVA) was used to investigate the demographic effects on TPB and behaviour variables.
4.2 Producing TPB scales
Standard procedures were used to produce composite TPB scales for use in subsequent data analyses. First, it was necessary to test whether the sets of items used to measure the independent variables within the TPB (i.e. attitude, subjective norm and perceived control) were independent from one another. Therefore, for each target behaviour, the items used to measure attitude, subjective norm and perceived control were subjected to a principal components factor analysis with varimax rotation. As expected, in each of the four analyses, three factors emerged from the data. However, across the four analyses, one attitude item did not consistently load onto the same factor as the other attitude items (‘If I [performed the
target behaviour] it would be Unenjoyable/Enjoyable’).
Similarly, one subjective norm item did not consistently load onto the same factor as the other subjective norm items (‘I would feel under social pressure to [perform the target behaviour]’) and two perceived control items did not consistently load onto the same factor as the other
perceived control items (‘It would be entirely up to me whether or not I [performed the target behaviour]’ and ‘For me, [performing the target behaviour] would be Difficult/Easy’). The analyses were therefore re-run with these items removed, and the results provided strong evidence for the independence of the measures of attitude, subjective norm and perceived control. In each analysis, the remaining attitude items loaded onto one factor, the remaining subjective norm items loaded onto a second factor and the remaining perceived control items loaded onto the third factor. In each case, the three rotated factors accounted for reasonably large proportions of the variance (62.91% for cycle helmet use, 62.04% for using crossings, 64.67% for crossing between parked cars and 69.34% for challenging traffic). The results of the factor analyses conducted are presented in Appendix G.
The second step in producing TPB variables for use in subsequent analyses was to calculate global measures of attitude, subjective norm and perceived control. For each target behaviour, the mean of the attitude items that consistently loaded together in the factor analyses reported above was calculated to produce the global measure of attitude towards the behaviour. Similarly, for each target behaviour, the means of the subjective norm items that loaded together and the means of the perceived control items that loaded together were calculated to produce composite scales. The mean of the items used to measure respondents’ intention to perform each target behaviour was also calculated to produce measures of behavioural intention. Cronbach’s Alpha statistics were calculated to determine the internal reliability of each composite scale. These statistics are presented in Table 6 and show that each scale had acceptable to good internal reliability.
Table 4 Distribution across age and sex (%)
Sex
Male Female Total
Age group (years)
11-12 17.3 17.1 34.4
13-14 16.7 17.7 34.4
15-16 15.1 16.1 31.2
Total 49.1 50.9 100
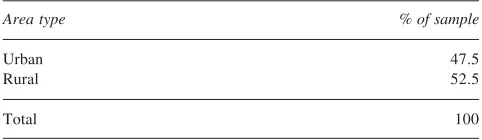
Table 5 Distribution across area type (%)
Area type % of sample
Urban 46.7
Rural 53.3
Total 100
4 Results
4.1 Analyses
4.3 Descriptive statistics and demographic effects on the TPB and behaviour variables
Table 7 shows the mean scores for each component of the TPB across each target behaviour. It can be seen that, for cycle helmet use and using crossings, the samples of respondents generally had positive attitudes towards performing the behaviours, perceived social pressure to perform the behaviours and perceived that they had considerable control over whether they themselves performed the behaviours (i.e. scores on these composite scales were above the midpoints). Intentions towards cycle helmet use and using crossings were relatively neutral (i.e. the overall mean scores were close to the midpoints of the intention scales). The mean behaviour score for respondents in the cycle helmet sample was below the midpoint of the scale (indicating that, overall, respondents reported wearing a cycle helmet relatively infrequently when riding a bike) and the mean behaviour score for respondents in the using crossings sample was close to the mid-point.
‘challenge traffic’. For both these behaviours, scores on the perceived control and reported behaviour scales fell close to the midpoints (although for crossing between parked cars, intention and behaviour scores fell slightly above the midpoints and for challenging traffic they fell slightly below). Means and standard deviations for each individual questionnaire item designed to measure TPB and behaviour variables are presented in Appendix H.
MANOVA analyses were conducted to address the first main aim of the study – to investigate the effects of the demographic variables on the TPB scales and the reported behaviour variables. One MANOVA was conducted for each target behaviour and in each analysis five dependent variables were used – attitude, subjective norm, perceived control, intention and reported behaviour – and three between-subjects factors were used – age (11-12 years old, 13-14 years old, 15-16 years old), sex (males, females) and area (urban, rural). The statistically significant univariate effects were examined only when the relevant multivariate effect was significant (thus avoiding inflating the Type I error).
[image:16.595.50.289.69.187.2]Table 8 shows the univariate effects due to age and the associated F ratios. It can be seen that, with one or two exceptions, age had a statistically significant effect on each component of the TPB across all four target behaviours. From a road safety perspective, younger adolescents had more desirable attitudes and behaviour than did older adolescents. Their attitudes and intentions towards using a cycle helmet
Table 6 Internal reliabilities of the TPB scales
Cronbach’s Alpha
Crossing
Cycle between
Chall-No. of helmet Using parked enging
Measure items use crossings cars traffic
Attitude 7 0.87 0.87 0.87 0.90
Subjective norm 3 0.72 0.70 0.76 0.84
Perceived control 2 0.64 0.64 0.77 0.73
Intention 4 0.92 0.88 0.85 0.86
[image:16.595.306.546.418.793.2]Attitudes towards crossing between parked cars and challenging traffic were slightly negative, indicating that overall, respondents perceived these behaviours to be ‘bad’, ‘harmful’, ‘unsafe’ and so on. Scores on the subjective norm scale fell below the mid-point for both these behaviours. This indicated that, overall, respondents did not perceive much social pressure to cross between parked cars and
Table 8 Age effects: Means (standard deviations) and F ratios
Crossing
Cycle between
helmet Using parked Challenging
use crossings cars traffic
Attitude (Scored –3 to +3)
F ratios 8.25# 9.77# 5.12✝ 6.21✝
11-12 years 1.51 (1.29) 1.80 (1.19) -1.12 (1.35) -0.81 (1.52) 13-14 years 1.01 (1.44) 1.40 (1.12) -0.87 (1.29) -0.75 (1.38) 15-16 years 1.05 (1.38) 1.23 (1.24) -0.73 (1.30) -0.39 (1.43)
Subjective norm (Scored +1 to +7)
F ratios 4.44* 11.60# 4.02* 2.89
11-12 years 5.05 (1.47) 5.86 (1.14) 3.03 (1.46) 2.95 (1.64) 13-14 years 4.75 (1.54) 5.49 (1.16) 3.34 (1.33) 3.06 (1.50) 15-16 years 4.60 (1.44) 5.36 (1.08) 3.30 (1.31) 3.27 (1.48)
Perceived control (Scored +1 to +7)
F ratios 0.35 0.02 16.28# 13.96#
11-12 years 5.43 (1.73) 5.90 (1.34) 4.50 (1.74) 4.11 (1.72) 13-14 years 5.35 (1.63) 5.90 (1.13) 4.92 (1.47) 4.68 (1.49) 15-16 years 5.25 (1.54) 5.86 (1.26) 5.31 (1.37) 4.98 (1.51)
Intention (Scored –3 to +3)
F ratios 12.48# 18.50# 15.08# 6.92#
11-12 years 0.20 (1.76) 1.01 (1.53) -0.23 (1.56) -0.62 (1.64) 13-14 years -0.41 (1.94) 0.41 (1.47) 0.14 (1.44) -0.14 (1.53) 15-16 years -0.76 (1.75) 0.09 (1.47) 0.53 (1.33) -0.01 (1.49)
Reported behaviour (Scored +1 to +7)
F ratios 7.82# 6.61✝ 12.06# 9.99#
11-12 years 3.37 (2.12) 4.64 (1.85) 3.89 (1.73) 3.59 (1.82) 13-14 years 2.93 (2.22) 4.12 (1.71) 4.62 (1.63) 4.05 (1.70) 15-16 years 2.42 (1.93) 4.10 (1.55) 4.49 (1.44) 4.28 (1.64) *
[image:16.595.48.289.479.694.2]= p < .05 ✝ = p < .01 # = p < .001
Table 7 TPB variables and reported behaviour: means and standard deviations
Subjective Perceived Reported
Attitude norm control Intention behaviour
(Scored (Scored (Scored (Scored (Scored -3 to +3) +1 to +7) +1 to +7) -3 to +3) +1 to +7)
Cycle helmet use
M 1.22 4.83 5.35 -0.26 2.96
SD 1.39 1.50 1.65 1.86 2.13
Using crossings
M 1.47 5.57 5.88 0.50 4.28
SD 1.24 1.15 1.24 1.54 1.72
Crossing between parked cars
M -0.90 3.22 4.90 0.15 4.34
SD 1.32 1.37 1.57 1.47 1.64
Challenging traffic
M -0.65 3.09 4.59 -0.25 3.97
and towards using crossings were more positive than were older adolescents’ attitudes and intentions. Compared with older adolescents, they perceived more social pressure to wear a cycle helmet and use crossings and they reported carrying out these behaviours more often than older children did. For the crossing between parked cars and challenging traffic behaviours, older respondents had less negative attitudes than younger respondents did. They also perceived more social pressure to perform these behaviours and perceived that they had more control over their performance of these behaviours than did the younger respondents. Older adolescents reported that they crossed between parked cars and ‘challenged traffic’ more often than did younger adolescents.
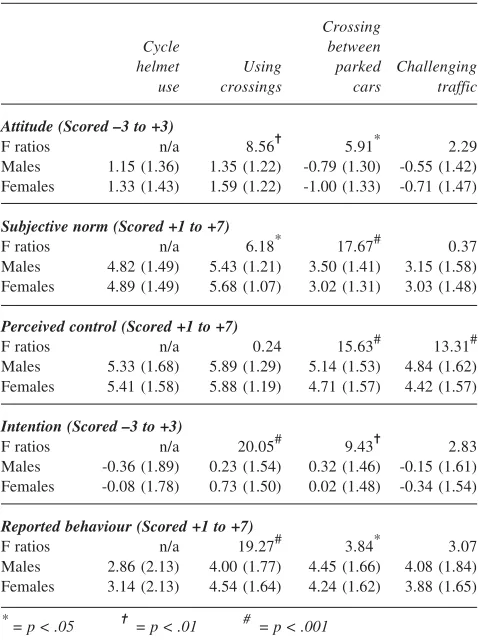
As can be seen from Table 9, females had slightly more positive attitudes and intentions towards cycle helmet use than males. They also perceived more social pressure to wear a cycle helmet, had greater perceptions of control over wearing a cycle helmet and reported wearing a cycle helmet more often than male respondents did. However, the MANOVA analysis showed that, overall, these differences between males and females in the ‘cycle helmet use’ sample were not statistically significant. There were statistically significant effects of sex for the
remaining three target behaviours, however. The univariate effects relating to these results are also presented in Table 9. The results showed that, compared with males, females had significantly more positive attitudes and intentions towards using crossings, perceived significantly more social pressure to use crossings and reported using
crossings significantly more often. Males had significantly more positive attitudes and intentions towards crossing between parked cars than did females. Also, compared with females, they perceived significantly more social pressure to cross between parked cars, perceived that they themselves had greater control over their performance of the behaviour and reported carrying out the behaviour more often. For the challenging traffic behaviour the only statistically significant univariate effect due to sex was that males perceived significantly more control over their performance of the behaviour than did females.
MANOVA results indicated that there were no statistically significant area effects on the using crossings and crossing between parked cars behaviours. However, adolescents sampled from schools in rural areas had more positive attitudes and intentions towards using cycle helmets when riding a bike than did adolescents sampled from schools in urban areas. Adolescents from rural schools also perceived significantly more social pressure to use a cycle helmet, had greater perceptions of control over wearing a cycle helmet and reported using cycle helmets more often when riding a bike than did adolescents from urban schools. For the challenging traffic behaviour the only statistically significant univariate effect of area was on the attitude scores. Adolescents from rural schools had a less negative attitude towards challenging traffic (as described in the scenario that was used) than did
[image:17.595.49.288.449.769.2]adolescents from urban schools. The significant univariate effects due to area are shown in Table 10.
Table 10 Area effects: Means (standard deviations) and F ratios
Crossing
Cycle between
helmet Using parked Challenging
use crossings cars traffic
Attitude (Scored –3 to +3)
F ratios 22.47# n/a n/a 4.42*
Urban 0.92 (1.38) 1.39 (1.24) -0.79 (1.32) -0.55 (1.50) Rural 1.46 (1.34) 1.55 (1.24) -0.99 (1.31) -0.74 (1.40)
Subjective norm (Scored +1 to +7)
F ratios 12.64# n/a n/a 0.98
Urban 4.56 (1.53) 5.57 (1.13) 3.22 (1.33) 3.00 (1.55) Rural 5.06 (1.43) 5.57 (1.16) 3.22 (1.41) 3.17 (1.53)
Perceived control (Scored +1 to +7)
F ratios 13.86# n/a n/a 0.06
Urban 5.05 (1.74) 5.89 (1.23) 5.04 (1.51) 4.56 (1.56) Rural 5.60 (1.53) 5.88 (1.25) 4.79 (1.61) 4.62 (1.66)
Intention (Scored –3 to +3)
F ratios 20.65# n/a n/a 2.72
Urban -0.70 (1.79) 0.46 (1.50) 0.32 (1.47) -0.15 (1.57) Rural 0.11 (1.83) 0.53 (1.57) .01 (1.47) -0.34 (1.57)
Reported behaviour (Scored +1 to +7)
F ratios 19.38# n/a n/a 2.92
Urban 2.46 (1.92) 4.33 (1.70) 4.43 (1.57) 4.07 (1.74) Rural 3.38 (2.21) 4.25 (1.75) 4.25 (1.69) 3.88 (1.74) *
= p < .05 ✝ = p < .01 # = p < .001
[image:17.595.306.547.449.770.2]n/a = Univariate effects not examined because multivariate effect was not statistically significant.
Table 9 Sex effects: Means (standard deviations) and F ratios
Crossing
Cycle between
helmet Using parked Challenging
use crossings cars traffic
Attitude (Scored –3 to +3)
F ratios n/a 8.56✝ 5.91* 2.29
Males 1.15 (1.36) 1.35 (1.22) -0.79 (1.30) -0.55 (1.42) Females 1.33 (1.43) 1.59 (1.22) -1.00 (1.33) -0.71 (1.47)
Subjective norm (Scored +1 to +7)
F ratios n/a 6.18* 17.67# 0.37
Males 4.82 (1.49) 5.43 (1.21) 3.50 (1.41) 3.15 (1.58) Females 4.89 (1.49) 5.68 (1.07) 3.02 (1.31) 3.03 (1.48)
Perceived control (Scored +1 to +7)
F ratios n/a 0.24 15.63# 13.31#
Males 5.33 (1.68) 5.89 (1.29) 5.14 (1.53) 4.84 (1.62) Females 5.41 (1.58) 5.88 (1.19) 4.71 (1.57) 4.42 (1.57)
Intention (Scored –3 to +3)
F ratios n/a 20.05# 9.43✝ 2.83
Males -0.36 (1.89) 0.23 (1.54) 0.32 (1.46) -0.15 (1.61) Females -0.08 (1.78) 0.73 (1.50) 0.02 (1.48) -0.34 (1.54)
Reported behaviour (Scored +1 to +7)
F ratios n/a 19.27# 3.84* 3.07
Males 2.86 (2.13) 4.00 (1.77) 4.45 (1.66) 4.08 (1.84) Females 3.14 (2.13) 4.54 (1.64) 4.24 (1.62) 3.88 (1.65) *
= p < .05 ✝ = p < .01 # = p < .001
Although these effects of demographic variables on TPB and behaviour variables are of interest, it is of more applied value to investigate the strength of the relationships between TPB variables and behaviour, and to investigate the extent to which the demographic-behaviour relationships are mediated by the TPB. This is because the variables within the TPB are potentially amenable to being changed via road safety countermeasures. This was the second aim of the study and it is dealt with in the following sections of this report.
4.4 Associations between TPB variables and behaviour: Correlation coefficients
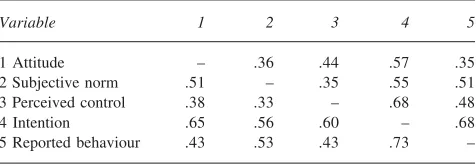
As a first step in investigating the relationships between TPB variables and reported behaviour, correlation matrices for each target behaviour were calculated. Table 11 shows the zero order correlation coefficients for cycle helmet use and using crossings and Table 12 shows the correlations for crossing between parked cars and challenging traffic. Across the four target behaviours it can be seen that, in line with the theoretical predictions of the TPB, attitude, subjective norm and perceived control were all positively and statistically significantly associated with intentions, and intentions and perceived control were significantly associated with reported behaviour. There were also significant attitude-behaviour and subjective norm-behaviour relationships. Thus, the more positive
respondents’ attitudes were to performing the behaviours, the more social pressure they perceived to perform the behaviours and the more perceived control over the behaviours they had, the more likely they were to have positive intentions and the more likely they were to report performing the target behaviours. Also, the more positive respondents’ intentions were, the more likely respondents were to report performing the target behaviours.
4.5 Predictors of behavioural intentions and reported behaviour
The next step in investigating the relationships posited by the TPB was to use hierarchical multiple regression (see Baron and Kenny, 1986; Cohen and Cohen, 1975) to identify the independent contributors towards behavioural intentions and reported behaviour. To identify the (demographic, exposure and TPB) variables predictive of behavioural intentions four regression analyses were conducted, one for each target behaviour. In each analysis, intention was regressed on the demographic and exposure variables in the first step. The TPB predictors were added to each regression equation in step 2. A similar procedure was used to identify the predictors of reported behaviour. For each target behaviour, the reported behaviour variable was regressed on the demographic and exposure variables (in step 1 of each analysis) and on the TPB variables (in step 2 of each analysis).
Step 1 of these analyses allowed the independent effects of the demographic and exposure variables on intentions and on reported behaviour to be assessed. Step 2 allowed the effects of the TPB variables to be assessed, having taken the effects of the demographic and exposure variables into account. In addition, this analysis procedure allowed the strength of the relationships between the demographic/exposure predictors and intentions/reported behaviour to be assessed before the addition of the TPB variables to the analyses and after their addition. This was necessary to establish the extent to which the demographic and exposure effects on intentions and reported behaviour were mediated by the TPB variables (e.g. the extent to which age differences in intentions and behaviour occurred because of age differences in TPB variables). To
demonstrate mediation, the effects of the demographic/ exposure predictors in step 1 should not be statistically significant in step 2 (i.e. after having taken the TPB variables into account). If the step 1 demographic/exposure predictors were still statistically significant predictors of intentions or reported behaviour in step 2, then the decrease in their predictive validity was tested for
statistical significance in an attempt to demonstrate that the TPB variables significantly mediated their impact on intentions and reported behaviour. The standard procedure recommended by Edwards (1984) was used to test this effect. Briefly, this involved testing the differences between the unstandardised beta weights for each demographic/exposure variable before and after the addition of the TPB variables to the regression analyses.
4.5.1 Cycle helmet use
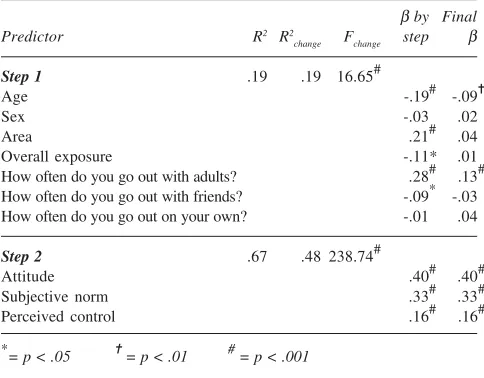
[image:18.595.48.287.511.592.2]4.5.1.1 Predicting intentions: Cycle helmet use Table 13 shows the analysis conducted to identify the independent predictors of intention to use a cycle helmet. The demographic and exposure variables accounted for 19% of the variance. An inspection of the step 1 standardised beta weights showed that the statistically significant independent predictors of intentions were age, area, overall exposure, ‘how often do you go out with adults’ and ‘how often do you go out with friends’. The
Table 12 Zero order correlation coefficients: Crossing between parked cars and challenging traffic
Variable 1 2 3 4 5
1 Attitude – .36 .44 .57 .35
2 Subjective norm .51 – .35 .55 .51
3 Perceived control .38 .33 – .68 .48
4 Intention .65 .56 .60 – .68
5 Reported behaviour .43 .53 .43 .73 –
Correlation coefficients above the diagonal relate to crossing between parked cars and coefficients below the diagonal relate to challenging traffic. p < .001 for all correlation coefficients.
Table 11 Zero order correlation coefficients: Cycle helmet use and using crossings
Variable 1 2 3 4 5
1 Attitude – .59 .46 .72 .54
2 Subjective norm .47 – .44 .68 .61
3 Perceived control .48 .36 – .52 .44
4 Intention .58 .49 .37 – .83
5 Reported behaviour .37 .41 .27 .70 –
[image:18.595.50.288.671.754.2]