Performance and Configuration of Link Adaptation Algorithms with Mobile
Speed
Javier Gozalvez* and John Dunlop**
*Now with the Signal Theory and Communications Division at the University Miguel Hernández of Elche (Spain), previously at the University of Strathclyde
**Mobile Communications Group, EEE Dept, University of Strathclyde 204 George St, Glasgow G11XW, Scotland
[email protected], [email protected]
Abstract: Link Adaptation is an adaptive radio link technique that selects a transport mode, from a set of predefined modes of varying robustness, depending on the channel quality conditions and dynamics. Previous work has shown the need to adapt the configuration of the Link Adaptation algorithm to certain operating conditions such as the system load. Since the channel quality dynamics are also influenced by the user speed, this paper investigates the impact of the mobile speed on the performance and configuration of Link Adaptation algorithms.
1. Introduction
The steady increase in demand for traditional voice services and the introduction of new bandwidth-consuming data services is creating new challenges for mobile operators that need to implement the means to efficiently use the scarce available radio resources. The efficient and dynamic use of the radio resources, which is a key aspect of research conducted for 3G and future mobile systems [1], is the main aim of Radio Resource Management (RRM) techniques. One of these RRM techniques is Link Adaptation.
Link Adaptation (LA), initially developed as a 3G technique, has been identified as a key technology for evolved GSM systems such as the Adaptive Multi-Rate codec (AMR), General Packet Radio Services (GPRS) and Enhanced Data rates for GSM Evolution (EDGE). The potential and benefits of LA are such that it is being considered for the High-Speed Downlink Packet Access (HSDPA) system, which represents the future evolution of 3G systems. The basis of LA is to assess the channel conditions and then use a transport mode, from a set of predefined options, that is optimised for these conditions according to a predefined criteria. The benefits obtained by applying a LA algorithm compared to the case where a fixed transport mode has been used include: improved speech quality [2], improved coverage [3] and increased throughput [4].
The LA performance depends on the accuracy of the channel quality measurements and the ability of the system to adapt to channel quality variations. This ability is determined by the LA updating period, which
defines how regularly a decision is made on the most suitable mode. The adjustment of the LA updating period presents a trade off between number of mode changes and ability to quickly adapt to sudden channel quality variations. A LA updating period could then be considered as optimum if it maximises the performance while minimising the number of mode changes. The duration of the LA updating period should be established according to the channel quality dynamics. Since these dynamics are dependent on various parameters of a mobile system, e.g. load, [5] studied the LA performance for various LA updating periods under different loads. The investigation conducted in [5] highlighted the need to adapt the configuration of the LA algorithm to the operating conditions and to the targeted QoS strategy since various configurations affect differently the performance measures.
[5] analysed the configuration of LA algorithms under high mobile speeds (50km/h). Mobile speeds can also influence differently the dynamics of the link quality. While rapid variations of the link quality conditions are expected at high speeds, low speeds can produce correlated link quality conditions over longer periods of time. An initial analysis of the performance of a LA algorithm with mobile speed was presented in [6]. This first study considered the configuration of LA at the link level for a GSM system. On the other hand, the aim of this paper is to analyse the dynamics of the LA updating periods for low speeds at the system level and compare the observations obtained to those presented in [5] to determine whether the configuration of the LA algorithm should also be adapted to the mobile speed.
been considered here so that results are not conditioned by GPRS limitations.
Scheme Code rate Payload Data rate (kbits/s)
CS1 1/2 181 9.05
CS2 ≈2/3 268 13.4
CS3 ≈3/4 312 15.6
[image:2.595.59.287.94.184.2]CS4 1 428 21.4
Table 1: GPRS channel coding parameters
2. Simulation models
In order to ensure high accuracy and to account for sudden channel quality variations, an event-driven simulator working at the burst level has been implemented. The simulator models the dynamic behaviour of the channel quality in terms of the Carrier to Interference Ratio (CIR).
2.1. System Modelling
A cellular network of equally sized 3-sector macro cells, with a cluster size equal to four, has been considered. Within the network, interference produced by first and second tier of co-channel interferers is considered. Each cell has a radius of 1km and each sector has been assigned two carriers. Although mobility has been implemented, handover between sectors has not been considered. The boundary effects have been removed by using a wrap-around technique.
The simulator concentrates on the downlink performance. The system load is varied by changing the number of users in the system, with each user operating for the complete duration of the simulation. Following the study presented in [7], a single slot allocation strategy has been implemented by means of a random allocation scheme. Users are assigned channels in a first-come-first-served basis and the channel is kept until all its data has been correctly transmitted. An ARQ protocol, following the GPRS specifications, has been implemented to request the retransmission of erroneous blocks. A perfect feedback of the ARQ report with no RLC block loses has been assumed [5].
Pathloss is predicted using the Okumura-Hata model. Although the Okumura-Hata model was based on measurements done for distances greater than 1km, the model can be extended for distances below 1km [8]. The shadowing has a log normal distribution with a standard deviation of 6dB and a decorrelation distance of 20 meters. Fast fading has also been included in the system level simulations as explained in Section 2.3. Power Control (PC) or Slow Frequency Hopping (SFH) mechanisms have not been implemented in the results reported. PC and SFH directly affect the operation of LA and therefore the use of both techniques together with LA would require the definition of an algorithm describing how they
should interact. Since the definition of such algorithm is out of scope of this work, PC and SFH have not been considered here.
2.2. Traffic Modelling
Two different traffic sources have been considered for this study, WWW browsing and email, with the traffic type evenly distributed among users at 50%. No channel partition has been applied between the two services and results are collected individually for each type of traffic from the central cell. Both traffic sources have been implemented as an ON/OFF model. For both traffic models, the transmission of a new packet cannot start until the previous transmission has finished, i.e. all the data has been correctly received. The active transmission time will hence depend on the channel quality conditions. More detail on the traffic sources implemented can be found in [5].
Burst Frame
CIR1 CIR2 CIR4 CIR1
LUT-1
BER1
LUT-1
BER1 LUT-1
BER4 LUT-1
BER2
LUT-2
BLER
µBER sBER
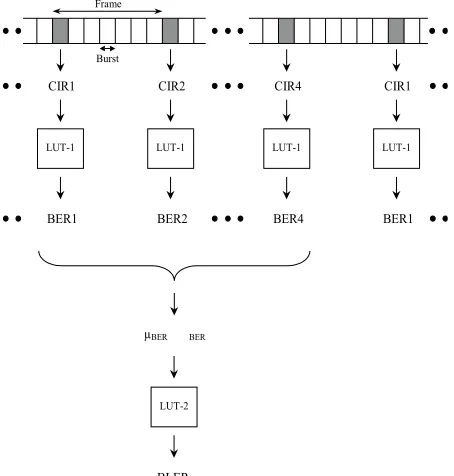
Figure 1: Link-to-sytem level interface
2.3. Link-to-System Level Interface
[image:2.595.311.538.290.528.2]measured CIR. The burst quality is represented by means of the Bit Error Rate (BER). LUT-1 represents a cumulative distribution function (cdf) of the BER for a given CIR. A random process is then used to generate the actual BER from the corresponding cdf. The purpose of this procedure is to model the effect of fast fading on the BER through a random process thereby including the fast fading at the system level. The BER is then estimated for the four bursts used to transmit a RLC block and LUT-2 maps the mean BER and the standard deviation of the BER over the four bursts to a corresponding Block Error Rate (BLER) value. Graphical examples of LUT-1 and LUT-2 can be found in [5].
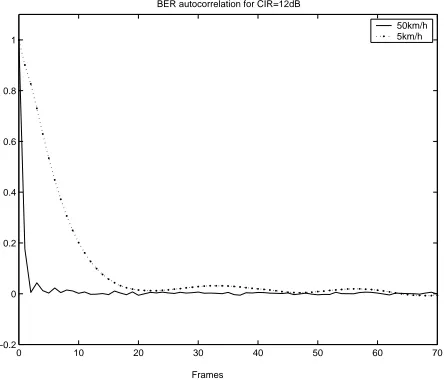
The system level simulator used for this work considers correlation between CIR values [10]. However, the BER correlation that the sequence of CIR could generate is not explicitly modelled. As shown in Figure 2, this correlation between BER values is only expected at low speeds. It must also be taken into account that Figure 2 illustrates the BER autocorrelation for a fixed CIR value; the level of correlation should be smaller under a variable CIR environment. Moreover, it is worth noting though that the modelling of the CIR correlation infers an implicit characterisation of the BER behaviour, since the BER is related to the particular CIR experienced.
0 10 20 30 40 50 60 70
−0.2 0 0.2 0.4 0.6 0.8 1
BER autocorrelation for CIR=12dB
50km/h 5km/h
[image:3.595.66.288.381.571.2]Frames
Figure 2: BER autocorrelation for CIR=12dB
3. Link Adaptation Algorithm
The GPRS coding schemes vary the payload size transmitted in a RLC block but not the gross rate. As a result, this work considers the application of a net rate LA algorithm.
As already discussed, the basis of LA is to assess the channel conditions and then use a CS that is optimised for these conditions. Different approaches can be taken to decide which coding scheme is considered as optimum based on, for example, the targeted QoS for a given service. Since this work is based on non-real time data services, a CS is considered to be optimum if it maximises the throughput. The criterion here considered for selecting
a particular coding scheme was also proposed in [11] for the study of the EDGE performance. The throughput is defined as follows:
Throughput = RCS × (1 – BLERCS) (1)
with RCS and BLERCS being the data rate and BLER for
a given CS.
The LA switching thresholds define the boundaries between the regions where each CS maximises the throughput. Considering the link-to-system level interface used for this work, the boundaries are defined as a collection of points, each representing a combination of mean and standard deviation of burst quality values. An example of the throughput performance used to define the LA switching thresholds is illustrated in Figure 3. No hysteresis thresholds have been implemented.
The LA algorithm uses the quality measurements over the previous LA updating period to decide on the optimum CS. The mean BER and the standard deviation of the BER over a block for each transmitted block during the last updating period are filtered to get the channel quality estimation necessary for the LA algorithm. A filter with a rectangular shape has been applied throughout and a fixed initial coding scheme, CS4, has been selected at the start of each new data transmission.
0 0.2 0.4
0 0.1 0.2 0.3 0.4 0.5 0.6 0.7 0 2 4 6 8 10 12 14 16 18 20
22 Throughput at 50km/h (noFH)
CS1 CS2 CS3 CS4
Throughput (kbits/s)
Mean BER Stdv
[image:3.595.313.547.393.580.2]BER
Figure 3: Throughput performance and LA switching thresholds
4. Simulation Results
4.1. Performance Metrics and Evaluation Scenarios
95% of the samples, which is a general performance metric employed to analyse packet switched systems. The throughput is measured per user and is defined as the total number of bits successfully transmitted over the air interface divided by the radio transmission time. As a result, the throughput does not take into account the time a user has been waiting to get access to a channel. In this case, the throughput is measured over intervals of four seconds whenever the user is active. The throughput is collected for all users in the centre cell and the cdf of the throughput is therefore used to provide an indication of the system performance. The average throughput is averaged over all users in the centre cell. Another useful parameter to understand the functioning of an LA algorithm is the proportion of RLC blocks received with an optimal CS.
This study considers loads of 8, 16, 24 and 36 users per sector. These loads represent an average bandwidth occupancy of 20%, 45%, 67% and 93% respectively. The results presented in this section correspond to only users receiving WWW traffic and mobile speeds of 5 and 50km/h. Four different LA updating periods have been considered: 20ms, 60ms, 100ms and 200ms. 20ms is the shortest possible LA updating period since it corresponds to the transmission time of a single RLC block.
In order to ensure results with good statistical accuracy, each simulation scenario (i.e. considering a different load, LA updating period and mobile speed) simulates the transmission of more than 30 × 106 RLC blocks in the central cell.
4.2. Results obtained for high speeds
In order to analyse whether the configuration of LA algorithms should be adapted to the mobile speed, this section summarises some of the results obtained in [5] for high speeds (50km/h).
The study conducted in [5] highlighted that under the loads considered, a LA updating period of 20ms increased the number of samples with low bit rates but it also provided the best throughput to a considerable percentage of samples, with this percentage varying with the load. The performance with updating periods of 60ms, 100ms and 200ms was very similar for users experiencing low throughputs. Only for higher throughputs there was an advantage for using shorter LA updating periods. For these throughputs, the performance decreased as the updating period increased. However, longer LA updating periods decreased the number of CS changes, which proved that the selection of the LA updating period offers a trade-off between performance and signalling load.
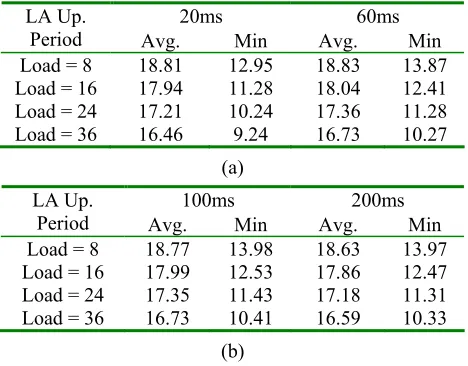
In terms of the average throughput, a LA updating period of 20ms provided a poorer performance than a LA updating period of 60ms for all loads considered; see Table 2. The performance obtained was very similar, under the operating conditions considered, for LA updating periods of 60 and 100ms, but it decreased for the 200ms case. In case the aim of a particular LA algorithm implementation was to guarantee that 95% of the samples experienced the highest possible
minimum throughput, the study showed that a LA updating period of 20ms clearly underperformed the other LA updating periods for all the considered loads; see Table 2.
To summarise, the analysis reported in [5] suggested that, for high loads, the benefit of using a LA updating period of 20ms is questionable. For low and medium loads, this updating period provides the best throughput for a significant number of samples but decreases the average throughput and minimum throughput for 95% of samples and increases the number of samples with low bit rates. Shorter updating periods also producde a higher number of CS changes. According to these observations, it was concluded that the decision on which updating period to use should take into account the load and should be based on the QoS strategy targeted; that is, for example, whether the aim is to decrease the number of users with low bit rates while also decreasing the number of CS changes or increase the throughput to a considerable number of users.
20ms 60ms LA Up.
Period Avg. Min Avg. Min
Load = 8 18.81 12.95 18.83 13.87 Load = 16 17.94 11.28 18.04 12.41 Load = 24 17.21 10.24 17.36 11.28 Load = 36 16.46 9.24 16.73 10.27
(a)
100ms 200ms LA Up.
Period Avg. Min Avg. Min
Load = 8 18.77 13.98 18.63 13.97 Load = 16 17.99 12.53 17.86 12.47 Load = 24 17.35 11.43 17.18 11.31 Load = 36 16.73 10.41 16.59 10.33
[image:4.595.306.540.309.492.2](b)
Table 2: Average throughput and minimum throughput for 95% of the samples in kbits/s for different LA updating periods and loads
(50km/h)
4.3. Effect of Mobile Speed
In terms of load variation, similar trends to the 50kmh results described in [5] have been observed for low speeds (5km/h). However, the results obtained have shown that the benefits of a 20ms LA updating period are reduced for low speeds as the performance for high throughput transmissions under different LA updating periods gets closer.
compared to 50km/h. Under low speeds, the 60ms, 100ms and 200ms updating periods also give better throughput for 95% of the samples than a 20ms updating period, following the trend observed at 50km/h. However, the main difference between high and low speeds is the performance for longer LA updating periods. Table 2 shows that, at high speeds, the throughput performance decreases for the 200ms LA updating period. As shown in Table 3, the decrease in throughput performance for longer LA updating periods is reduced at lower speeds. More importantly, Table 3 shows that, at low speeds, a LA updating period of 200ms even provides the highest minimum throughput for 95% of the samples for low and medium loads, which was not the case at high speeds. These observations demonstrate that the configuration of the LA algorithm should also take into account the mobile speed.
20ms 60ms LA Up.
Period Avg. Min Avg. Min
Load = 8 18.22 9.71 18.43 11.24 Load = 16 17.09 7.89 17.33 8.99 Load = 24 16.04 6.66 16.34 7.37 Load = 36 15.12 5.59 15.50 6.18
(a)
100ms 200ms LA Up.
Period Avg. Min Avg. Min
Load = 8 18.38 11.39 18.39 11.65 Load = 16 17.21 8.97 17.27 9.19 Load = 24 16.35 7.48 16.31 7.48 Load = 36 15.52 6.20 15.46 6.19
(b)
Table 3: Average throughput and minimum throughput for 95% of the samples in kbits/s for different LA updating periods and loads
(5km/h)
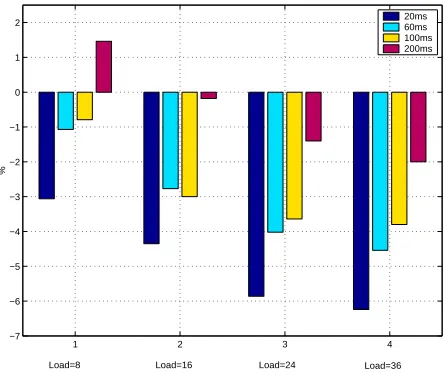
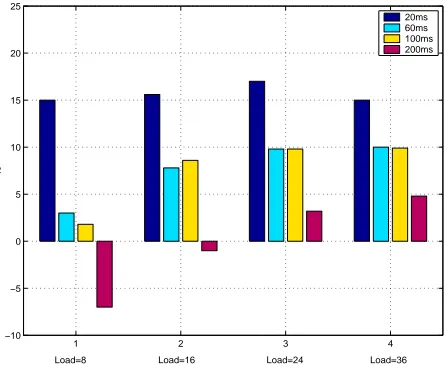
Another illustration of the different effect that the use of long LA updating periods has, for low and high speeds, is shown in Figure 4. This figure depicts the difference in the proportion of blocks received with the optimal CS when mobiles move at a speed of 5km/h compared to 50km/h. It can be observed that for low loads and a 20ms LA updating period there is a decrease of approximately 3% in the proportion of blocks received with the optimal CS for low speeds compared to high speeds. On the other hand, a 200ms LA updating period results in an actual increase of about 1.5% in the proportion of blocks received with the optimal CS for low speeds compared to higher speeds. This observation further highlights the beneficial effect of using a longer LA updating period at low speeds and under certain operating conditions. Although this increase is not sustained at higher loads, Figure 4 clearly shows that the decrease in the proportion of blocks received with the optimal CS for low speeds is much smaller for the longer LA updating periods than the shorter ones. This effect influences also the throughput performance. The simulations that have been conducted have shown that, considering a load of 8 users per sector and a 200ms LA updating
period, over 63% of the samples measured experience a higher throughput performance under low speeds compared to high speeds. This percentage is reduced to around 48% with a 20ms LA updating period. Also, the improvement that was obtained at low speeds for these percentage of samples was reduced with a 20ms LA updating period compared to a 200ms LA updating period.
1 2 3 4
−7 −6 −5 −4 −3 −2 −1 0 1 2
%
20ms 60ms 100ms 200ms
Load=8 Load=16 Load=24 Load=36
Figure 4: Difference in the proportion of blocks received with the optimal coding scheme for 5km/h compared to 50km/h
[image:5.595.56.289.274.457.2]1 2 3 4 −10
−5 0 5 10 15 20 25
%
20ms 60ms 100ms 200ms
[image:6.595.68.292.58.244.2]Load=8 Load=16 Load=24 Load=36
Figure 5: Difference in the average number of coding scheme changes per second for 5km/h compared to 50km/h
5. Conclusions
Previous research showed that the configuration of Link Adaptation algorithms should take into account operating conditions such as the system load. This paper has studied the dynamics of the LA updating periods at low speeds and under various system loads. These dynamics have been compared to those experienced at higher speeds. The research conducted has shown that, contrary to that observed at high speeds, the use of long LA updating periods can improve, at low speeds, the performance and operation of the LA algorithm under certain operating conditions. Taking into account that the use of long LA updating periods also decreases the signalling load associated with the use of LA, there appears a clear benefit to using long LA updating periods at low speeds.
The results obtained from this study demonstrate that the configuration of the LA algorithm should also take into account the mobile speed. This conclusion further highlights the need to adapt the configuration.
REFERENCES
[1] R. Agusti, O. Sallent, J. Pérez-Romero, J. Ruela and C. Guerrini, "ARROWS Strategies for RRM", in Proceedings of the IST Summit, September 2001.
[2] J. Dunlop, J. Pons, J. Gozalvez and P. Atherton," Real-time GSM Link Adaptation Hardware Demonstrator", in Proceedings of the IEEE Vehicular Technology Conference, VTC-Spring 2000, May 2000, pp 590-594.
[3] J. Dunlop and J. Pons, "Range Extension Based on Link Adaptation", in Proceedings of the International Workshop on Wireless Communications, June 1999, pp 58-65.
[4] O. Queseth, F. Gessler, and M. Frodigh, "Algorithms for Link Adaptation in GPRS", in Proceedings of the IEEE Vehicular Technology
Conference, VTC-Spring 1999, May 1999, pp 943-947.
[5] J. Gozalvez and J. Dunlop, "On the Dynamics of Link Adaptation Updating Periods for Packet Switched Systems", in Proceedings of the Fourth International Symposium on Wireless Personal Multimedia Communications, WPMC2001, September 2001, pp 609-614.
[6] J. Pons and J. Dunlop, "Bit Error Rate based Link Adaptation for GSM", in Proceedings of the IEEE Global Telecommunications Conference, Globecom98, November 1998, pp 3722-3727. [7] J. Gozalvez and J. Dunlop, "Effect of Slot
Allocation Mechanisms on the Performance of Link Adaptation", in Proceedings of the 5th European Personal Mobile Communications Conference, EPMCC2003, April 2003, pp 286-290.
[8] K. Feher, "Wireless Digital Communications: Modulation and Spread Spectrum Applications", Prentice Hall, 1995.
[9] J. Gozalvez and J. Dunlop, "High-Speed Simulation of the GPRS Link Layer", in Proceedings of the IEEE International Symposium on Personal, Indoor and Mobile Radio Communications, PIMRC2000, September 2000, pp 989-993.
[10] A. Arregui, “Benefits and Feasibility of the Partial Loading Approach in Current and Future Cellular Mobile Radio Systems”, PhD thesis, University of Strathclyde, 1998.