X-RAY LINE BROADENING AIm STORED ElffiRGY IN DEFORDffiD AI-ill ANlffiALED LH:ESTONES .
BY
K. A. GROSS .
A thesis submitted for the degree of Doctor of Philosophy in the Australian National University.
The work described in this thesis is entirely my own, apart from the assistance given by:
(1) Ur. J . Easton, who performed the chemical analyses given on pages 21 and 117.
(2) Mr. E. Pedersen, who prepared the sample cores by diamond drilling.
(3) The Photographic Section in the John Curtin
School of Medical Research, Australian National University, which helped with the reproduction of the various figures used in the text .
,
CHAPTER 1.
CHAPTER 2.
CHAPTER 3.
CONTENTS .
INTRODUCTION 1.
The Deformed State in
Poly-crystalline Metals 38
The Effect of Annealing Deformed
Metals 4.
X-ray Line Broadening Studies of
Metals 7.
The Stored Energy of Deformation
of Metals 12.
Previous Work on Calcite Aggregates 15.
PREPARATION OF SPECIMENS Choice of Materials Deformation - Method
Some Results of Deformation Method of Annealing
19 . 19. 20. 23 . 28.
X-RAY DIFFRACTION OBSERVATIONS 32.
Methods 32 .
The Recording of X-ray Line Profiles 32. X-ray Diffraction Patterns 35 . Description of the X-ray Diffraction
Results 35.
The Effect of Deformation 35. The Effect of Annealing 40.
Other Observations 49 .
Interpretation of the X-ray
Diffraction Results
54
.
The Kinetics of the AnnealingProcesses
54
.
Analysis of the X-ray Line
Broadening 610
I
CHAPTER 40
CHAPTER 5.
CHAPTER 6.
u
CONTENTS.
Initial Line Broadening from
Limestones and Marbles 82.
STORED ElJERG Y T.ffiAS UREr.:ENTS . 91 0
Method 91.
The Results of Stored Energy
Measurements 103.
The Heat of Reaction of Solenhofen
Limestone after Annealing 110.
Cm.1PARISON OF STORED ENERGY
MEASURE:.LENTS WITH STRAIN ElJERGIES CALCULATED
r
ROM X-RAY LINEPROFILES . 120.
The Effect of Deformation 123. The Effect of Annealing 131.
DISCUSSION OF THE RESULTS 134. Comparisons with
r.
etals • 135. Recovery and Recrysta11isationKinetics 140.
A Possible Model for the Deformed
State in Calcite Aggregates 143. Comparison of the Annealing Data
with other Work on Calcite
CONTEN'rs .
Geological Implications
Summary
Bibliography Appendix 1 . Appendix 2.
Some Crystallographic Properties of Calcite
151.
156. 1590
iii.
End Piece.
-INTRODUCTION.
The phenomena accompanying the plastic
deformation and subseq~ent annealing of metals have been studied extensively for many years but, whilst our know -ledge is now considerable, there are many aspects which remain unexplained. It is still necessary to invent models which can best reconcile the results of the many diverse methods of examination that have been employed. Two of the methods which have been usef~ in the study of poly crystalline metals are measurements of x-ray line broadening and the stored energy of cold work. In the work now to be described these ~vo methods have been applied to the study of deformed and annealed limestones 0
In contrast to the field of metals very little effort has been devoted to the study of cold work and
2.
for this may be that elaborate equipment is required to
produce controlled deformations in such materials because
they are brittle in normal conditions of temperature and
pressure.
It seems to have been realised about the
beginning of this century (Adams and Nicolson, 1901) that
calcareous rocks become ductile and thus able to sustain
large deformations if they are enclosed in a high pressure
environment 0 Since then many investigations of the mechanical properties of rock forming minerals have been
madef both at room temperature and at elevated temperatures
and over a wide range of strain rates (Heard, 1963).
The structures produced by deformation in some
rocks have been extensively analysed by petrographic
methods which give information concerning the types of
slip or twinning system operating during plastic flowo
However, the processes which occur on a finer
scale have received little attention. Similarly, few
investigations have been made when deformation is followed
by annealing.
*
For an extensive bibliography see "Rock Deformation",Griggs and Handin, Editors, Geol. Soco America, Memoir
I~
I
Before reviewing earlier work on calcite aggregates it is desirable that we should attempt to summarise the present day state of knowledge of the behaviour of metals. A complete description of the various theories which have been advanced to explain the processes that occur during the plastic deformation and subsequent annealing of a metal is beyond the scope of this introduction. Attention must necessarily be con-fined to the current theories and to showing what contri-butions have been made by x-ray line broadening and stored
*
energy measurements.The Deformed S tate in Polycrystalline Metals 0
A currently held picture of the deformed state (Hirsch 1956, Warren 1959,) which reconciles the results of many diverse observations on polycrystalline metals,
*Many comprehensive reviews are available, e.g. Barrett (1952), Burke and Turnbull (1952), Greenough (1952),
is as
follows:-The individual grains are still extant, but
they have had developed within them, a mosaic of sub-grains.
Each sub-grain is slightly mis-oriented from its neighbour
and in the boundaries be~/een sub-grains there is a
broad region of intense deformation in which the density
of defects is very high. strain fields from the boundary
regions extend throughout the sub-grains which may also
contain some defects, but their concentration is much
lower than in the boundary regions.
The Effect of Annealing Deformed Metals.
When a deformed metal is annealed, there is
initially a reduction in the number and are-arrangement
of the defects in sub-grain boundary regions. One
consequence is that the strains in the sub-grains themselves
are reduced. This process is called recovery.
At high temperatures new grains appear and
consume old deformed material in the process of
recrystall-isation.
Relations giving the time and temperature
dependence of both the recovery and recrystallisation
Recovery.
There is evidence that there are a number of
processes occ~rring in the recovery stage of annealing
since different properties recover at different rates 5.
(Wilson and Thomassen, 1934). The most characteristic
feature of a recovery process is that the property
being measured changes very rapidly in the first few minutes of annealing to a value which is characteristic
of the temperature and thereafter subsequent changes
take place very slowly.
Some recovery processes have been found to
fit a rate equation of the form:
dx
- dt
=
C exp (.!) a.
.
.
.
. . . .
.
.
.
1.1 where x is the value of the property which is recoveringat time t, C is a temperature dependent constant and a is
a constant. The effect of temperature on recovery is
expressed by the usual Arrhenius equation for a thermally
activated process,
C
=
• • • • • • • • • • • 1.2where Q is an activation energy, R is the gas constant r
and T the temperature on the absolute scale, and Co is
LL
6.
Combining equations 101 and 1.2 gives
dx ( Q
r
-mx)
dt = Co exp - RT
where m
=
RT/aoThis equation can be integrated to give
x
=
Xo RmT . loge(1
+ t/t o ).0.
.
where Xo is the value of x in the deformed state and to
is defined by RT
-.
log (mc o to)e RT
=
mRecrystallisationo
In contrast to recovery, recrystallisation is characterised by an apparent incubation period at the end of which new grains appear and then grow by consuming the deformed matrix.- The length of the incubation period is determined by the severity of the initial deformation and
by the annealing temperature.
It has usually been considered that
recrystall-isation is a nucleation and growth process in which the rates of nucleation and growth can be described by
Arrhsnius type equations in which the activation energies are approximately equal. The isothermal rate of growth is independent of time. If the nucleation rate is also
Ii
70
growing grains then Johnson and Mehl (1939) and Avrami
(1940) show that the fraction X, which has recrystallised
at time t,is
X
=
1 - exp (- Btk) • • • • • • • • • 1.4where Band k are constants, the former being temperature
dependent 0 According to Avrami k should have a value
between 3 and 4 when recrystallisation proceeds three
dimensionally, 2 and 3 when it occurs two dimensionally
as in a thin sheet and between 1 and 2 when it occurs
linearly as in a wireo
If the activation energies for nucleation and
growth are equal then the rate of recrystallisation may
be expressed in terms of a single activation energy (Qc) o
That is
dX
dt
where A is a constanto
Qc )
RT • • 0 • 0 • • • 0
X-ray Line Broadening Studies of Metals .
1.5
The first observation that plastic deformation
caused x-ray diffraction lines to be broadened seems to
have been by Van Arkel
(1925).
It was found that asI
u
8.
eventually a limit was reached where increasing deformation
had no further effect (GoUgh and Wood 1936, Haworth 1937.)
Prior to 1950, the only parameter measured was
either the breadth of the line at half its peak height
or alternatively the integral breadth~, where
j I de
(B
=
:7i.e. the integrated intensity divided by the peak height.
It was recognised that broadening of x-ray lines could
result from a number of causes of which two could be
applicable to deformed metals.
(i) Deformation was causing the metal to be
broken up into very small fragments. A crystal particle
must have a certain minimum volume to give correlation of
the phases of the scattered radiation and therefore sharp
diffraction lines. If this critical volume exceeds the
volumes of the small fragments then broadening of the
lines will be observed. Scherrer (1918) showed that
the broadening in these circumstances was given by,
;B
=
~K_;\ _ _t cos
e
where t is the effective particle size, )\ is the wave
length of the x-radiation, K is a constant close to 1
but which depends on the particle shape.
metal, then the interplanar spacing would vary from
crystal to crystal.
represented by,
(0
-
2 € tane
where E is the strain.In this case the broadening is
Now unfortunately the behaviour of the sec 9.
and tan functions in the range of angles most amenable
to x-ray studies are very similar and as a result it
became difficult to decide whether one or the other cause
of broadening was the more important. Two schools of
thought emerged. The protagonists for small particle
size maintained that the limit in broadening was due to
a limiting particle size below which the metal could not
be broken. The strain supporters said that the elastic
strain could not exceed certain limits such as set by the
yield stress or the limit of applicability of Hookets law •.
In 1938, Brindley and Ridley obtained line breadths from filed rhodium which would have required a
very small, grain size of lO-6 cm if small particle size
broadening was the only cause. However, extinction was
observed and this could not be expected from such smalL
particles. Then in 1948, Paterson and Orowan found that
·
deformation in a similar way to the variation of the
yield stress.
10.
Experiments such as these suggested that
internal strains were the more important cause of the
line broadening effect.. Two mechanisms suggested
themselves as the source of the
strains:-(i) the strain fields associated with dislocations,
which had been invoked by Taylor (1934) to endeavour to
explain the phenomencnof work hardening,
(ii) by the presence of macro-stresses, which are
uniform over distances greater than the grain size~
Various suggestions have been postulated to account
for their occurrence (for a recent summary see Garrod
and Hawkes, 1963.) It is now believed that strains
introduced in this way do not make a substan~
con-tribution to the line broadening.
In 1948, Barrett suggested that stacking faults
could be introduced into a metal by deformation and
Paterson (1952) calculated the effect they would have on
the x-ray pattern of face-centred cubic metals.
Specifically some lines are broadened more than others
and some are shifted.
to other structures.
I-11.
Meanwhile, the development of Geiger counter
diffractometers made it possible to accurately and
conveniently determine the variation of intensity across
diffraction lines. Warren and Averbach (1950) developed
a method for analysing this complete line profileo Their procedure will be described in oome detail in
a subseQuent chapter; we need only say here that, in favourable circumstances, the effects of particle
size and strain broadening can be separated and a
distribution function for the strains determinedo If this last step cannot be made, it has
become customary to represent the strain distribution
by some assumed function. Once the strain distribution
has been determined or a satisfactory approximation made, the el astic strain energy can be calculated (Stibitz,
1937, Faulkner, 1960) and compared with the stored energy
of deformation measured by some direct method.
The x-ray line broadening method therefore can
provide the following information
:-(i) particle size - not necessarily implying
that the metal has been fragmented into discrete particles
12.
well~ ordered to coherently scatter x-rays,
(ii) the distribution of strains and hence the
strain energy,
(iii) the probability of the presence of stacking
faults.
However, the results cannot always be analysed
unequiv-ocally.
The Stored Energy of Deformation of Metals 0
The principles and methods involved in
measuring the stored energy of deformation have been
thoroughly discussed in a comprehensive review paper
by Titchener and Bever (1958). Only the more salient
features will be given here.
The energy stored in a body, which has
suffered plastic deformation can be expressed as
=
w
Q, • • • • • • • • 1.6where U is the stored energy, W is the work done on s
the body and Q is the heat energy liberated during
the deformation process. Measurements of Us may
therefore be based on one of two
principles:-(i) by direct measurement of Us and
defor-T
)
130
mation process.
Many of the early measurements of stored
energy employed this second principle, but since it
cannot be used for following the release of stored
energy during annealing it has tended to be displaced
by methods based on (i).
Methods for measuring Us directly falh into two distinct groups . In the first, the deformed
sample is annealed, usually by increasing the temperature
at a constant rate and measuring at the same time the power required to maintain the given rate of temperature
rise (e.g,. Clareborough, Hargreaves, Michelh and West, 1952.)
In the second method, the heats of reaction
of deformed and annealed samples with some suitable reagent are determined. The difference between the two
represents the stored energy. By also measuring the heat of reaction of partially annealed samples the
energy release pattern can be followed.
The results of stored energy measurements can
be summarised as
follows:-1. As deformation proceeds the stored energy
increases but the fraction of the work expended during
2 •. Stored energy is dependent on the particular
metal and its initial grain size.
3. Stored energy depends on the nature of the
deformation process.
14.
4. Stored energy depends on the temperature of
deformation, being higher for low temperatures, in
agreement with the behaviour of the mechanical properties.
5. The relative amo~ts of stored energy released
in recovery and recrystallisation are very variable.
The Mechanism of Energy Storage.
It is believed that significant energy is
stored by the elastic strain fields associated with
defects introduced by deformation. If this is so, then
there should be a correlation between stored energy
measurements and the strain energy deduced from x-ray
line broadening measurements. Unfortunately, there
have been very few investigations in which both quantities have been measured on the same set of samples, so that it
is difficult to draw any reliable conclusion. The
correlation of these two types of measurements will be
discussed in Chapter 5.
If the defect concentration can be found by
15.
calc~late the stored energy from a knowledge of the energy of dislocations and s~b-grain boundaries.
S~ch meas~res can be obtained from thin film electron
microscopy, b~t this reveals that defects are concentrated in s~b-grain boundary regions and unfortunately the
theoretical calc~lations of the energies of such bound-aries are difficult to make beca~se
,
so far,
no ade~uatetreatment of dislocation interactions has been developed. In some recent observations, the stored energy in deformed copper and silver has been satisfactorily predicted from meas~rements of dislocation densities and the energies of the dislocations calc~lated from the flow stress (Bailey and Hirsch 1960, Bailey 1963.)
Previo~s Work on Calcite Aggregates.
1. Mechanical Properties.
flow is usually smooth i.e. there is no sharp yield
point.
16.
Marble and limestones have been found to have
strengths comparable with those of the high strength
steels.
It has been found that if deformation of
Solenhofen limestone is carried out at elevated
temper-atures, the brittle to ductile transition occurs at
lower confining pressures and that the rate of work
hardening is decreased (Heard 1960.)
Heard (1963) has also investigated the effect
of varying the strain rate. In a series of experiments
with Yule marble he found that reduction of strain rate
lowered the rate of work hardeningo The effect was not
very great at room temperature but at temperatures of a
few hundred degrees centigrade it became very significant
and a region of steady state flow was entered.
It should be emphasised that the lowest strain
rates used in the laboratory are still many orders of
magnitude greater than those encountered in geological
conditions.
2.. X-ray Line Broadening.
17.
broadening in calcite aggregates. Rosenthal and Kaufman (1952) took advantage of the room pressure brittleness by crushing Yule Marble which had already been deformed. They reasoned that if the line
broaden-ing which they observed initially was due to internal
strains then, as the particles became finer, the internal
strains should be relieved whereas particle size broaden-ing would be unaffected or increased. They were able to
observe pronounced sharpening of the diffraction lines
when the particle size was reduced below 1 micron and
concluded that internal strains were the principle cause
of the original broadeningo
Paterson (1958a) examined Solenhofen limestone,
which had been compressed 15.5%. He measured broadening
for four different x-ray lines and concluded that
inter-nal strains were the most prominent source of broadening.
He also made various assumptions concerning the nature of
the strain distribution and calculated, for each, the
elastic strain energy stored in the material. He
-1
concluded that it could be as much as 5 cal gm ,which
is nearly two orders of magnitude higher than for similarly
deformed metals.
30 Annealing.
Griggs, Paterson, Heard and Turner (1960) found
18.
aggregates could be recrystallised by appropriate
annealing. Most of their experiments were with deformed
Yule marble and annealing was carried out in an atmos -phere of carbon di-oxide at 5 k bars pressure and the
results were assessed petrographically. Their results
were not extensive but they were able to conclude that
they fell into a pattern which was typical of the be-haviour of metals during recrystallisation.
Their experiments could not be expected to
reveal the existence of a recovery stage because of the
19.
C~P~R2.
PREPARATION OF SPECIMENS.
Choice of Materials.
A lithographic limestone, believed to be from
Solenhofen (Bavaria), was selected as a suitable material
for X-ray line profile measurements. There are a.number
of reasons for this choice which may be summarised as
follows:-(i) Solenhofen limestone is a fairly pure
calcite rock (96% CaC03).
(ii) Its grain size, about 10 microns, is suitable
for examination with an x-ray diffractometer.
(iii) The grains are randomly distributed in
orientation (Higgs, Friedman and Gebhart, 1960.)
(iv) Porosity is comparatively low.
20.
A coarser grained marble from Carrara (Italy) has also been ~sed. Its grain size, of abo~t
0.5
.
mms, makes it a s~itable material for text~ral studies.Chemical analyses of the two materials ~sed
in these experiments are given in table 2.1. A chemical analysis of Solenhofen limestone from the literat~re is also incl~ded in the table to show there are good gro~ds for thinking that the lithographic stone employed is, in fact, from Solenhofen. Miller (1952) gives a spectographic analysis of Solenhofen limestone, which agrees with these analyses and, in addition, shows
the presence of a small amo~t of stronti~ (between 0.1 and 1%.)
Deformation.
Method.
For deformation,specimens were prepared in the form of cylinders, 25 mm long by 10 mm diameter, by coring
210
TABLE 201
Chemical Analyses of Limestones.
Lithographic Solenhofen Carrara.
Limestone Limestone* Marble
A B A B
Water (H2O) 0.16 0.15 0.08 0005
Total Insolubles 1.61 1.47 0.03 0.06
Si02 (in insolub- 1017 1.15
les. )
CaO 53.80 53.82 54.74 55009
-CaC0
3 96.03 96.07 96.01 97.69 98.33
MgO 0.58 0.56 0.85 0.83
MgC0
3 1.21 1.17 1.18 1.78 1.74
Loss on ignition
43.41 43040 43075 43.81
- - -
(CO2)R203 0.34 0.30 0.45 0.07 0.05
Fe 203
~
0.14-
0.01-,
~i02 ) Nil
-
Nil-)
MnO
~
Nil-
Nil-Al 203 (by diff .) ) 0020 0.06
Total 99.89 99.50 99.52 99.89
Underlined values used in arriving at totals.
A and B are duplicate analyses.
[image:26.582.96.532.118.574.2]22.
thin walled latex rubber. The jackets overlapped the
ends of the specimens by about 1/8", and tool steel end
pieces of the same diameter and 1/4" thick were fitted
in the overlapping ends. The ends of the jackets were
sealed by additional rubber rings.
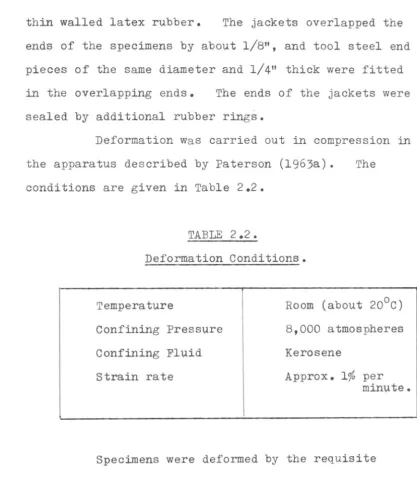
Deformation was carried out in compression in
the apparatus described by Paterson (1963a). The conditions are given in Table 2.2.
TABLE 2.2.
Deformation Conditions.
Temperature
Confining Pressure
Confining Fluid
Strain rate
Room (about 200C)
8,000 atmospheres
Kerosene
Approx. 1% per minute.
Specimens were deformed by the requisite
nominal amount, usually 20%, measured under the confining
pressure. On release of the confining pressure deformed
specimens of limestone expand by several per cent (Paterson
[image:27.586.89.507.75.553.2]screw gauge, was used to calculate the plastic strain
suffered by the specimens.
It should be noted that the conditions during
deformation viz. 8,000 atmospheres, 20oC, lie in the
aragonite field of the calcium carbonate phase diagram
(Jamieson 1953, Macdonald 1956.) It seems that the
reaction is very sluggish under these conditions and that
it does not occur at all during the short time (about
20 minutes) that the specimens are in an environment
favouring conversion to aragonite.
Some Results of Deformation.
Some typical compression stress-strain curves
are shown in figure 2.1. These curves are qualitatively
similar to curves for Solenhofen limestone obtained by
Heard (1960) and for Carrara marble)Von K~r~n (1911).
They cannot be compared quantitatively because the earlier
measurements were made at different confining pressures.
None of the materials have given a sharp
yield point but the transition from an initial steep
slope in the elastic range to the lower one, which we
associate with work hardening, is more abrupt for Carrara
marble than for Solenhofen limestone. The rate of work
hardening is greater in the fine grained Solenhofen
1
2
.2
.1
'"
[image:29.699.17.684.46.603.2]~
FIGURE 2.1
SOLENHOFEN LIMESTONE AND CARRARA MARBLE .
Stress - Strain C~rveso
Solenhofen limestone.
Solenhofen limestone, heated to 860°C
for one ho~r befqre deforming.
Carrara marble •
Carrara marble, heated to 860°C for one
--After heating, Solenhofen limestone shows a residual length increase which may be attributed to
internal stresses arising from the anisotropy of the
thermal expansion coefficients of the constituent
25.
calcite grains. After heating to 860oC, this increase
is
3.4%
and since the diameter is not measurably affectedthe density must be correspondingly reduced, which
implies that the porosity has increased. Therefore
the initial low value of the slope of the stressrstrain curve of pre-heated Solenhofen limestone may correspond
to the closing up of pores.
For reasons which will .appear later, it seems
that heating causes a change in the nature of the
impur-ities in Solenhofen limestone, which might be the reason
for the greater rate of work hardening in preheated material. It is well known that the mechanical
proper-ties of metals are very sensitive to the presence of
impurities (McLean 1962.)
Preheated Carrara. marble gives a stress-strain
curve which is not very different from the unheated
material. The residual length change, after heating to
8600
c
(1.5%), is only about half that of Solenhofen andt~ere is no evidence of impurities being changed by
Some other results of deformation
are:-(i) Specimens become fragile, which appears to
be caused by a loss of inter-granular cohesion.
(ii) Cores of Carrara marble become slightly
elliptical, the difference be~~een major and minor
diameters being about 0.02 mm after 20% deformationo 26.
This indicates that there is some preferred orientation
of the grains in the block of marble used.
(iii) It has already been noted that after
deformation and during release of the confining pressure
there is an increase (6.1.) in the length of specimens
(Paterson 1963b.) The magnitude of this effect is
shown in table 2.3 for different strains. The values
quoted are averages for the numbers of specimens shown
in the second column. Where results are comparable,
the agreement with Pa'terson's values is satisfactory.
(The result is expressed as
~
where / is the lengthat 8,000 atmospheres after deformation.)
Also shown in table 2.·3 are values of the
work done during deformation (W), which were calculated
,)
27.
TABLE 203
Expansion on Release of Confining Pressure (
6
0
)
andWork done (W) during Deformation.
Material Solenhofen Preheated Solenhofen Carrara Preheated Carrara
No. of
Specimens 9 3 51 2 19 1 19 1
Average
fj
L
Plastic Strain(%) 1
at 8,000 atmos o 507 13.1 *20.0 25.8 20.0 6.5 20.0 20.7
at 1
atmos. (%)
3.9 1.9
9.6 400
16.0 5.0
2104 5.9
16.6 4.3
6.1 0.4
1606 403
18.1 3.3
W
(cal gm-l)
2.1 7.2 13.3 18.9 12.5 ll.9
F
28.
Method of Annealingo
It was necessary to prevent decomposition of
the sample during the heat treatment of deformed limestone
samples. When heated in air the reaction,
Cao + CO 2
can be detected at 7500Co In the course of some
prelim-inary experiments, it was found that temperatures higher
than this were likely to be req~ired. Therefore, all
heat treatments were made in a heavy walled stainless
steel vessel which co~d be connected directly to a
cylinder of carbon dioxide. The carbon dioxide pressl,lr' e
was therefore of the order of 50 atmospheres. Under
these conditions the dissociation temperat~re exceeds
11000C (Smythe and Adams 1923, Harker and T~ttle 1955.)
The vessel is shown in fig~re 2.2. A is the
specimen, inside a stainless steel caps~le 2. 3 is the
stainless steel wall of the vessel
in
thick 0 4 is thethermoco~ple (chromel-al~el), which fits into an
i
n
diameter hole drilled into the wall of the vessel.
5 and 6 are respectively a n~t and a cone seal. 7 is
the connection of flexible stainless steel tubing
leading away to the CO2 cylinder and 8 is a fire-brick
1
FIGURE 2.2.
The Eq~ipment Used for Annealing Limestone Specimens.
1 is the specimen enclosed in a small stainless
steel caps~le ~;
l
is the heavy walled stainless steel vessel;1
is the thermoco~ple used for temperat~re meas~rement;
2
is a n~t and 6 a cone seal and1
the flexible stainless steel t~be leading fromthe CO2 cylinder;
8 is the firebrick which fills the opening of
[image:35.650.10.596.9.679.2]•
5
6
I ·
1"--0 1"--0' , •
..
:....
'..
:.'.,~
:.!
:,
..
: ,'
.
• " • • to' "' • •
:
..
...
" ,.. : "...
.
:..
:.1° 00';'" 0'· • ••
~ •. 0'" • , •• :
.:
..
:' ,.
-,
.'
,..
.'.: "';
...
:
.
.
" ,.
: '.
..
:::' .:.
:
,:..
• • t • • :
3
u
cut to just fit the opening of a horizontal muffle
furnace 0
In use, the specimen in its capsule was
placed at point B, the system was flushed with CO2
300
and then the pressure appliedo The vessel was placed
in the muffle furnace and brought up to the required
temperature 0 The vessel was then qUickly removed from
the furnace and tipped, so that the specimen capsule
slid to point A, and then quickly replaced in the
furnace. At the end of the heating period, the vessel
was again removed from the furnace and tipped back to
allow the specimen to slide to the cool end (B).
This process was the best that could be
devised to define the heating period. In a typical run,
for example at 8500C, about half an hour was required for
the temperature of the vessel to come to equilibrium
after insertion in the muffle furnace. At this stage
the outside of the vessel near B, could still be touched
by hand, so that it seems unlikely that the specimen
reached a very high temperature during this period.
After heating for an hour point B reached a temperature
of approximately 2000C, so that cooling of the specimen
was quite slow.
The thermocouple (4) was connected to an
310
"Elliot" indicator with range 0-12000C. This system
was calibrated against a second chromel-alumel couple
connected to a "Cambridge" potentiometer. Standard
tables of E.M.F~ versus temperature calculated from
values given in the International Critical Tables (Vol.l,
p.59) were used and a check was made against the freezing
point of pure sodium chloride.
Temperature gradients in the equipment were
troublesome, and were measured by placing a thermocouple
in a hole drilled in a piece of limestone, which was
placed in position A. Comparison of readings obtained
from this couple with those from the main couple enabled the determination of a correction factor. However, this could only be done with a pressure of 1 atmosphere in the apparatus and, as a result, it is estimated that
+ 0 temperatures are known only to an accuracy of _ 5 C.
The temperature of the muffle furnace was
controlled by a "Foster" Electronic Indicating Controller
and a thermocouple placed against the walls of the
mUffle furnace. This instrument allowed fluctuations
of the order of + 50C in the temperature of the furnace
but the large heat capacity of the stainless steel vessel
I
32.
CHAPTER 30
X-RAY DIFFRACTION OBSERVATIONS.
Methods.
After heat treatment samples were sectioned
parallel to their axes and the faces formed were ground
on successively finer abrasive papers, finishing with
600 grade. Finally, the surfaces were etched with 10%
hydrochloric acid to remove any distortion which might
have resulted from the abrasion.
The Recording of X-ray Line Profileso
The flat surfaces formed were just large
enough for examination in a "Phillip's" PW 1010 stabilised
x-ray unit and a counter diffractometer. The
diffract-ometer was operated with a proportional counter and a pulse
height analyser, the output of which was fed to a
33.
This last item together with a step scanning device
enabled line profiles to be determined semi-automatically
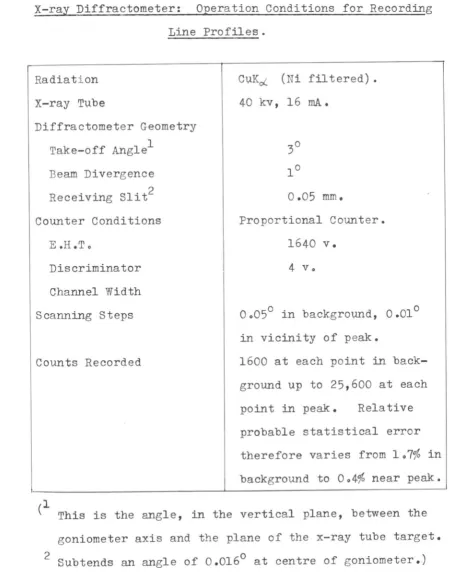
and with a known precision at each point. Full details of the operating conditions are set out in table 3.1 whilst the considerations which led to some of these
conditions are given in Appendix 1. Each diffraction line w:!a.s scanned over an angle of + 1.5 (028 ) from the
position of its main peak. Even from the most heavily deformed samples, this was ade~uate to ensure that the
intensity had fallen to the background level.
The geometrical properties of an x-ray
diff-ractometer modify the shape and position of x-ray
diffracti on lines, (Klug and Alexande~1954). To correct for this the usual practice is to compare the
broadened line with the same line from an annealed
sample of the same substance. A number of methods have
been proposed for obtaining the pure broadening from the
observed line profile and in this work, the method
described by Stokes (1948) has been employedo This
method makes use of certain relations found by Stokes, between the co-efficients of the Fourier series which
represent the three profiles involved, viz. the observed broadened profile, the observed instrumental profile
I
34. TABLE 301
X-ray Diffractometer: Operation Conditions for Recording
Line Profiles.
Radiation
X-ray Tube
Diffractometer Geometry
1
Take-off Angle
Beam Divergence
Receiving Sli t2
Counter Conditions
E.H.To
Discriminator
Channel Width
Scanning Steps
Counts Recorded
CUK~ (Ni filtered).
40 kv, 16 mAe
0.05 mm.
Proportional Counter.
1640 v.
4 vo
00050 in background, 0.010
in vicinity of peak.
1600 at each point in
back-ground up to 25,600 at each
point in peak. Relative
probable statistical error
therefore varies from 107% in
background to 004% near peak.
(l
This is the angle,in the vertical plane, between the
goniometer axis and the plane of the x-ray tube target.
[image:41.585.84.533.73.658.2]F
35.
A number of diffraction lines have been
corrected using an IBM 1620 Computer. (The programme
employed is given in detail in Fortran language in
Appendix 2.) The corrected line profiles covered a
wide range of line breadths and from them it was possible
to draw correction curves to give the integral breadths of the pure broadening from those of the observed curves. A sample, which was deformed 16 per cent and then
annealed for one hour at 8600C was used to provide data
to represent the instrumental broadening. This sample
was considered to be completely recrystallised and
therefore suitable for th~s purpose.
X-ray Diffraction Patterns.
X-ray diffraction photographs were made, usually by the "glancing angle" method, in a "Unicam' single crystal goniometer fitted with an 0.5 mm diameter collimator and a 6 cm diameter cylindrical film cassette.
The specimen was always stationary during the exposure.
Description of the X-ray Diffraction Results .
The Effect of Deformation.
The results of x-ray line broadening
36.
are given here to show the effect of deformatimn on
line broadening but a detailed discussion of the nature
of the deformed state will be left to a later chapter.
The results under the heading integral breadth are the
integral breadths of the pure broadening, corrected for
instrumental effects by the method described in the
last section.
A number of inferences may be made from this
table.
1. It is noted that prior to deformation this block
of Solenhofen limestone gives an appreciable amount of
line broadening.
2. There is the expected result that increasing
deformation leads to greater broadening. However, it
may be noted that there is a relatively larger increase
of line broadening in the early stages of deformation
(less than 10% strain) than in subsequent stages.
30 Deformation does not broaden all diffraction lines
equally nor do the breadths of the various lines follow
any simple relation to the Bragg angle,
e.
4. The integral breadth of the (1014) reflection depends
on the plastic strain and is independent of whether the
stress was compressive or tensile, despite the
'
-37. TABLE 3.2.
solenhofen Limestone: Effect of Deformation on the
Broadening of X-ray Diffraction Lines.
Residual Strain Integral Breadth (028 )
Plastic at 8,000 Sense
Strain atmos 0 (1014) (1120) (1123) (2022'
(%)
(%)
3.9 5.7 compo 0.180 0.227 0.244 0.224
9 .7 1301
"
0.24216.0 20.0
"
0.264 0.386 00441 0035021'.1 25.8
"
0.295...
5.5 ext • 0.180(1)- ""12
"
0...236(2)16 06 20.0 compo 00295 0.436 0.502 0.387
(3) 0.16
-
0.116Initial Condition 0.080 0.081 0.106 0.111
(1) Strain approximate because specimen was beginning
to neck.
(2) Preheated at 8600C for 1 houro
(3) Exposed to hydrostatic pressure of 8,000 atmospheres
[image:44.588.80.536.82.597.2])
5. Expos~re of a specimen to a hydrostatic pressure
of 8,000 atmospheres, i.e. a pressure equal to the
confining press~re in deformation experiments, has led
to a shortening of the specimen and a measurable increase
in line breadtho This can be attributed to the collapse
of pores, which is consistent with Paterson's (1963b)
observation of a small increase of density in similar
circ1,.UJlstances.
6. Preheating of Solenhofen limestone to 8600C for one
hour leads to greater broadening for a similar strain.
Perhaps this is a consequence of the larger rate of
work hardening in this material.
TIiffraction patterns of Carrara marble before
and after deformation (fig~res 3.1, 302, 3.3) show that
what were originally q~ite sharp spots are elongated into arcs lying on TIebye-Scherrer rings and asterism
streaks appear at low diffraction angles. These effects
can be attrib~ted to the development of a sub-grain
'"'
str~ct~re (Hirsch and Kellar, 1952), in whi ch there are
---small misorientations (of the order of one degree)
between individ~al s~b-grains. The lengths of the arcs,
which are broadened radially, are proportional to the
FIGURE 3.1
Carrara Marble Initial Condition.
,
(
FIGURE 3.2
Carrara Marble - Deformed 6%.
FIGURE 3.3
i
,
"
.
/
400
The Effect of Annealing.
The effect of annealing on the broadening of (1014) diffraction lines of Solenhofen limestone is
illustrated in figures 304 and 3.5. The former,figure presents values of the integral breadths of the broaden-ing of (1014) reflections from samples which were heated at constant temperatures for various times o All
specimens had been deformed to a final plastic strain of 16 per cent. Figure 3.4 suggests that two distinct processes are involved in the reduction of btoadening.
In the first stage, reduction of broadening to a value determined by the annealing temperature occurs
in the first few minutes of heating. Thereafter,
further reduction is very slow and appears to be proport
-ional to the logarithm of the heating time. If the temperature is high enough (order of 700oC) the
broadening is qUickly reduced to a constant value and prolonged heating for times up to 10 hours brings no further change. At still higher temperatures, the second process becomes important. The broadening
drops to the same constant value, remains there for a period dependent on the temperature and then falls
again until, if heating is prolonged sufficiently, it
[image:48.592.108.511.98.666.2]<::
~
FIGURE
3.
4
Solenhofen Limestone, deformed 16%.
Variation,of the Broadening of
(1014)
reflections,FIGURE 3.5
Solenhofen Limestone.
Variation of the Broadening of (10I4) Reflections with
Annealing Temperature. Heating time one ho~r.
1. Deformed 16%.
2. Heated at 8600C for one hour then deformed
3. Deformed 309%.
with
ur.
0·1, 0/5o
2 ... ""- "'-~ ~ ~ •-
-
-
/
3
--V ...
'" 1
-(/
-I ~\
\
\,
" " -j \ . ,
.-
-.~ " '\Z I "-'\\ _. '.
" I ~_ \
~-. - ._ . .s::fl
\" '\
•
•42.
(
4-
i
~
.
-... -. -.-.
--
--
...
--
..
-
-
-.
.
.
-.-
.
.
..
:-:-=--
----.
...
.
--
.. -.-.-
---.-
--~. ~·-·-t··-Xt'\\
\
\.
I \
\
\ .\
\
\-\\
W\ \
\
1>7*
O~
--~--~
J Z--~--~--~--~--=---~\I--~--
J • 5 6 7 81 943 co
The form of the curves in the first and
second stages is typical of the behaviour to be
expected from recovery and recrystallisation,
respect-ively 0 These processes were defined in Chapter 1.
Further evidence that the second stage
corresponds to recrystallisation is provided by x-ray
diffraction photographs which are reproduced in figures
In the first, which is from
the sample heated at 7750C for one hour, continuous
diffraction rings are obtained and the pattern is
v.irtually unchanged from that of an unannealed deformed
sample. As the heating time is prolonged, a progressive
splitting up of the rings into assemblages of spots
occurs, showing clearly that the material is
recrystall-ising in the second stageo
The same tendency for two stages in the
reduction of line broadening can be seen in figure
3.5
where data is presented showing the effect of heating
for periods of one hour at different temperatures on
samples with various histories.
Comparison of the temperatures at which
recrystallisation can be first detected, from the line
broadening measurements, shows that they are lower for
I ~
/ .
,
FIGURE 306
Solenhofen Limestone, deformed 16% and annealed
775
0C for one hour.FIGURE
3
.
7
Solenhofen Limestone, deformed 16~~ and anneal ed
775
0c
for two hours .The rings are starting to become spotty.
FIGURE 3.8
Solenhgfen Limestone, deformed 16% and anneal ed
775
C for 11 hours .FIGURE
3
.
9
Solenhgfen Limestone, deformed 16% and annealed 960 C for one hour .
Fully recrystallised. Note the greatly improved
(
• l :
.
,
:I
FIGURE 3..l0
Solenhofen Limestone - Initial Condition .
FIGURE 3011
Solenhofen Limestone - Heated to g600C f01' one hour .
(The different appearance at the right hand side of the
photographs is not significant. The sample used to obtain
tain
iably
o
FIGURE 3.12 .
Carrara Marble, deformed 16% and annealed at 500°C for one
hour . Compared with figure 3.3 the arcs are of similar
length but appear to be much sharper.
FIGURE 3 .. 13.
Carrara Marble, deformed 16% and annealed at 725°C for one
hour. Some sharp spots are beginning to appear.
FIGURE 3.14.
Carrara I.Iarble, deformed 16% and annealed at 890°C for one
houro The pattern is predominantly one of sharp
/
48.
not been observed and this suggests that polygonisation,
described by Guinier and Tennevin (1950), either does
not occur or is on a very fine scale.
An accurate measure of line broadening cannot
be obtained unless a sufficient number of the grains are
so oriented that they contribute to the diffraction line
being studied. Failure to meet this requirement can
be detected from the value of the integrated intensity
of the line, which will be higher than the correct value
if a few large grains are oriented to contribute to the
reflection or lower if too few grains are contributing.
For this reason, because of the large grain
size of Carrara marble, the radial broadening of the
arcs cannot be satisfactorily measured with the
diff-ractometer for the (1014) reflection. However, the
larger multiplicity factor of the (1123) reflection
made some approximate measurements possible. Integral
breadths for this reflection are given in table 3.3
together with the integrated intensities. It can be
seen that these latter values are very scattered so that
no great accuracy can be claimed for the integral breadth
measurements but they tend to confirm the visual impression
490
by anneal ing •
TABLE 3.3
Carrara Marble Integral Breadths of (1123) Reflections.
(B
Integrated Conditions (°28) Intensity (ArbitraryUnits)
Initial 0.04 383
Deformed 16.6% 0.32 281
Deformed 16.6% Annealed 5000C/l hour 0.25 281
"
"
"
695°C"
"
0.11 250\I
"
\I 730°C"
"
0.07 226"
"
"
775°C " \I 0.02 410"
"
"
860°C ""
0.09 245Other Observations.
1. Background. The background measurements made in
the course of line profile determinations are subject to
a relative probable statistical counting error of nearly
500
level between f~lly deformed and fully recrysta11ised
specimens.
To check this further, a number of measurements
over extended t imes were made at several points in the
background. The results are given in table 3.4.
TABLE 3.4
Measurements of Counting Rate in Backgroundo
Sample Angle Total Counting Counting
(029 ) Counts Time Rate
(mins.) (C/S)
IC 27.5 21,039 120 2092
DEF \I 19,946 113 2094
REC II 11,420 65 2.93
IC 33.8 23,382 134 2.91
DEF II 10,199 60 2083
IC 37.6 17,010 112 2.53
DEF II 19,660 120 2.73
REC II 8,788 51 2.87
IC
=
Solenhofen Limestone - initial conditionDEF ::: II II - deformed 16%
REC=
9600 for one hour.
16% and annealed
51.
They suggest that there is no significant
difference among the three sampleso The scatter amongst
the individual results probably arises from variations
in the natural background rate,that is the counting
rate observed when the x- ray tube window is shut.
This natural counting rate was quite appreciable and
probably averaged about
0
.
24
counts per second.2. Integrated Intensities of X- ray Diffraction Lines.
The integrated intensities of all the
x-ray diffraction lines are substantially constant
for most of the samples examined irrespective of their
history, except after recrystallisation has commenced.
The mean deviation from the mean integrated intensity
for
41
measurements on(1014)
reflections from Solen-hofen limestone is only
3
.
2
%
.
For Solenhofen limestone deformed 16% and
annealed at temperatures above 7500C the integrated
intensity increases by as much as 40%. This increase
is due, at least in part, to the development of a weak
preferred orientation of the recrystallised grains which
has been confirmed with x-ray diffraction photographs,
figure 3.15. The texture has not been observed in tbe
52.
prior to deformation. The reason for this difference
in behaviour is not knOWDo
The constancy of the integrated intensities
of all the diffraction lines suggests that extinction
does not occur even in the fully annealed specimens.
Peak Positions. It was found that the angular
displacement between the centroids of the various peaks
remained constant, within the limits of the accuracy
of the measurementso
40
Blue Colouration. When calcite crystals whichhave been deformed by slip are irradiated with x-rays
or gamma rays, they develop a bluish purple colouration
(Przibram 1927, Handin, Higgs, Lewis and Weyl, 1957,
Paterson 1958b.) Handin et ale also observed that
when discoloured samples were heated to 2900C the
colour disappearedo
The same effect has been observed in this
investigation in both Solenhofen limestone and Carrara
marble. It is found that immediately after i~radiation
the colour is purple but after a few days it decays to
blue, which is very persistent. After heating to 200oC,
irradiation causes the development of the blue colour
only and with a reduced saturationo After standing for
FIGURE 3015.
Solenhofen limestone, deformed 16% and annealed
at g600C for one hour, showing the weak maxima on the
(1014)
reflection which develops during recrystallisation.This photograph was obtained by transmission through
a platelet c~t so that its plane contained the long axis
of the specimen. The axial direction is indicated by
arrows"
To ens~re that a representative photograph was
obtained, the specimen was moved several times in its
ed
tiono
54.
disappears, only to reappear on further irradiationo The effect is still noted in samples heated at 200°C for 12 hours but disappears after 32 hours at this temperatureo It is still observed in a sample
heated to 260°C for one hour but has disappeared in
a sample heated to 340°C for the same time. This
temperature dependence agrees with Handin et alls observation.
It is to be noted that the effect has
disappeared before there has been any great change in
the x-ray line breadths.
Interpretation of the X-ray Diffraction Results .
The Kinetics of the Annealing Processes.
The data illustrated in f igure 3.4 can be used in a quantitative discussion of the kinetics of
the recovery and recrystallisation processes and this
will now be attempted.
Recovery. Since we are concerned with the recovery of line broadening, we may substitute.;8 for x in the equation 1.3 and obtain
where IcJ £)
0
RT
m log
55.
( mc o to)
e RT
The expression of the equation 3.1 gives a form of
dependence which is qualitatively similar to the results of the first stage of figure 3.4, but insufficient data has been accumulated to enable so many constants to be determined" The shapes of the curves of figure 3.4 do not agree with the hyperbolic time law proposed by Betteridge (1953-40)
A similar substitution of
f1
for x in equation 1,,21
tr
leads to the relation,
= Co exp _ (: ;) • • • • • • 3.2
where tr is the time to produce a given fraction, r ,
of the total recovery and T is the absolute temperature 0 The activation energy for recovery Qr is of interest because it is often found to be equal to the activ
-ation energies for self-diffusion and for steady- state creep.
Unfortunately, insufficient data has been obtained to test whether equation 302 is strictly
its val~e, which can be found from the gradient of
the straight lines obtained by plotting log JL
e tr
1
against I f 0 The limits found are Q
r (minim~)
56.
=
20 k cal mole-l and Qr (maxim~)=
35-k cal mole-loThese val~es were determined at a point where the
integral breadth of the broadening eq~alled 0.225028
which corresponds to approximately
30%
of recoveryhaving occ~rred.
These res~ts will be disc~ssed in Chapter 6.
Recrystallisationo
The c~rves for annealing temperatures of
7560C and higher in fig~re
3.4
appear to be approximatelyof the sigmoidal type generally found to be associated
with recrystallisation. Such curves us~ally obey an
eq~ation of the form,
X
=
1 - exp (_Btk) o • • 0 • • • 3.3 where X is the fraction of recrystallised material attime t; Band k are constants, the former being
temper-at~re dependento If this equation is applicable,
plots of loge log ( 1 ) vers~s loge t sho~d be straight
e ( I-X)
lines with slope k. A plot of this type has been made
1
"FIGURE 3.16.
Solenhofen Limestone Deformed 16% and annealed.
Values of log log
r
1 ]I
(It)
58.
With one exception, the experimental
points are seen to lie reasonably well on a set of
parallel straight lines, from which k is found to be
1.3
~
0.3. It has been assumed that X=
1 -~T'
where ~ is the integral breadth from material annealed
o
at 690 C, ioe. fully recoveredo
This assumption is equivalent to saying that
all the material is fully recovered before
recrystall-isation commences and that no further reduction of line
broadening occurs in the recovered material until it lli
consumed by new recrystallised grains . Whether this
assumption is justified could only be tested by
determining X by some independent method.
The temperature dependence of
recrystall-isation can usually be expressed in terms of a single
activation energy, Qc' by the equation
1
tx
=
0 0 0 • • • 0where ~ is the time at which a fraction X of the
material has recrystallised at the absolute temperature
T. R is the gas constant and A a constant. The
only assumption that is necessary when applying this
-I-590
represent constant values of X, irrespective of the
annealing treatment which has produced them.
Figure 3.17 shows the results of plotting loge (~) against 1 for several values of Xo
~
T
The
straight lines which are obtained are compatible with equation (3.4) and from their slope Qc is found to be
108 k cal mole-l + 15%.
The uncertainty in the value of Q
c
(±
15%)h~s been arrived at by considering the effects of the
uncertainty in temperature measurement and the
deter-mination of the broadeningo
A discussion of the results of this section
FIGURE 3.17
Solenhofen Limestone, Deformed 16% and Annealed.
1--t
-l--3
of
fJ·
0-071, / , ,
60.