Int. J. Electrochem. Sci., 14 (2019) 7582 – 7593, doi: 10.20964/2019.08.04
International Journal of
ELECTROCHEMICAL
SCIENCE
www.electrochemsci.org
Investigation of hydrogen evolution on electrodeposited Ni/P
coated carbon paper electrode in microbial fuel cell
Jia Li, Yu Zhao*, Ailian Wu*, Yuxue Wang
College of Chemistry and Chemical Engineering, Taiyuan University of Technology, Taiyuan Shanxi, P. R. China, 030024.
*E-mail: zhaoyu@tyut.edu.cn, wuailian@tyut.edu.cn
Received: 6 April 2019 / Accepted: 20 May 2019 / Published: 30 June 2019
Microbial electrolytic cell (MEC) is an innovative bioelectrochemical technology for hydrogen production using various organics and even wastewater. The development of a nonprecious metal hydrogen catalyst is critical to MECs. Increasing the stability and activity of such catalyst remains a key challenge. In this study, Ni/P is prepared by electrodeposition on bare carbon paper. The prepared electrode material is used as a cathode electrocatalyst in an MEC. Here, we show that the Ni/P cathode material has excellent hydrogen generation catalytic activity, that is comparable to that of Pt and superior to that of Ni or bare carbon paper. Particularly, the electrode has the best hydrogen evolution ability when the Ni2+/PO43- ratio is 50:30 and current density is 154.18 A m-2, which is 12% larger than that of Pt. The cathode hydrogen recovery rate, hydrogen production rate and energy efficiency of the electrode are 74.54%±0.89%, 0.321±0.012 m3H2m-3 d-1 and 135.11%±5.36%, respectively, which are superior to those of Pt. The Ni/P cathode has good long-term stability. Results of this study, indicate that the Ni/P cathode is an alternative to Pt and have good prospects for MEC hydrogen evolution reaction (HER) cathode.
Keywords: MEC; Ni/P; electrodeposition; HER
1. INTRODUCTION
In MEC, the main role of the cathode is to combine electrons and hydrogen ions to produce hydrogen gas, which is produced and migrated from the anode, which is the most direct location of hydrogen production [6]. Hydrogen evolution reaction (HER) requires an effective catalyst to reduce overpotential and subsequently increase the efficiency of the reaction. The common electrode materials in MEC are stainless steel, carbon material and precious metal platinum [7]. Pt has good catalytic performance but is difficult and expensive to extract [3, 8-11], Coking wastewater often contains sulfur, which easily poisons Pt and may cause secondary pollution to the environment, which has violated the production of hydrogen in the process of MEC energy saving and environmental protection. Thus, the application Pt in MEC systems is limited. Carbon materials have high hydrogen overpotential and energy consumption. Therefore, a large number of stable, cheap and efficient non-noble metal cathode catalysts must be developed vigorously [12]. At present, many catalysts such as molybdenum disulphide [1], carbides/nitrides [13-14], transition metal [15-17] and stainless steel [18], have been studied. Moreover, nickel has been a wide concern due to its low overpotential, low cost, easy accessibility and very stability. In recent studies, nickel and nickel based-alloys have been used as cathode catalysts in MECs.
Yu et al. [19] studied the optimum conditions for electrodepositing NiMo alloy on carbon cloth. The hydrogen production rate was 2.1m3H2m-3 d-1 when the external voltage was 0.6V. Cai et al. [15] prepared a 3D dual-phase Ni5P4-NiP2 nanosheet matrix, through which the hydrogen production rate was increased to 9.78±0.38 mL cm-2 d-1, which is 1.5 times faster than that of NF. Popczun et al. [20] studied the effect of Ni2P nanoparticles on hydrogen evolution in an alkaline solution. When the cathode current density was 20mA cm-2, the overpotential was 205 mV.
In the present study, a novel type of Ni/P coated carbon paper was prepared and used for the catalysis of hydrogen production in a single-chamber MEC cathode. The preparation conditions of Ni/P coating were optimised for the enhancement of hydrogen production performance. The Ni/P was used to replace the Pt in the existing technology. It has similar properties to Pt and has very high hydrogen production efficiency. Using Ni/P as the cathode of MEC to treat coking wastewater and synthesise hydrogen transforms waste into treasure and provides new ideas and perspectives for the urgent treatment of coking wastewater [18, 21-23].
2. MATERIALS AND METHODS
2.1 Preparation of cathodes
The CP electrode was prepared in 4 cm -2 (2 cm x 2 cm). An electrophilic electrode surface was obtained by initially rinsing the electrode with distilled water and then immersing it in 1 mol L-1 sulphuric acid and 1 mol L-1 sodium hydroxide for 5 h. Finally, the electrode was repeatedly washed with distilled water until pH = 7, then placed in 120 °C oven for 12 h.
material was obtained. The amount of phosphorus in the coating can be changed by modulating the composition of the plating solution.
2.2 MEC construction and operation
The single-chamber MEC was made of Plexiglass (i.e., the total capacity of the cylinder is 100 ml), The 100 ml solution was composed of 20ml of microbial mud, which is collected by the local coking wastewater plant (Taiyuan, China) and 80ml of a nutrient solution containing 1 g L-1 C6H6O6·2H2O, 6.155g L-1Na2HPO4·12H2O, 5.618 g L-1 NaH2PO4·2H2O, 0.31 g L-1 NH4Cl, 1 g L-1 CaCl2 and 1.2 g L -1 MgSO4. The domesticated carbon felt (2 × 5 × 1 cm3) with biological film was used as the anode, which was initially inoculated in steadily running double-chamber MFCs [24]. The reference electrode was Ag/AgCl electrode, and the cathode was asprepared cathode material. The external voltage applied to the MEC was 0.7V, which was supplied by the switching power supply (HB 17301 SL; Hossoni, Inc., China).
2.3 Analytical methods
X-ray diffraction (XRD) tests on all samples were performed with an XRD diffractometer (XRD-6000) for the characterisition of the crystalline phase of the material. The morphology characteristics, particle size and particle agglomeration state were studied by scanning electron microscopy (SEM) with JSM-7001F. Similarly, the energy dispersive X-ray energy spectrum (EDS) was obtained by using a JSM-7001F electron microscope. The X-ray photoelectron spectroscopy (XPS) was performed on ESCALAB 250Xi for the analysis of the chemical valence of various ions in the material.
All the electrochemical tests were performed at room temperature on an electrochemical workstation (CHI660D, Chenhua, China). The single electrode was electrochemically measured in a three-electrode system with 100 mM phosphate buffer solution (PBS PH=7) as electrolyte. The as-prepared electrode materials were used as the working electrodes, and the Ag/AgCl electrodes and Pt were respectively used as the reference electrodes and counting electrodes, respectively. Linear sweep voltammetry (LSV) tests were conducted by sweeping the potential from 0.5 V to -2 V with a scan rate of 10 mV s−1. The potential sweep of the Tafel curve was from -1.2 V
to
-0.6V at a scan rate of 10 mV s−1. The amplitude of the electrochemical impedance measurement (EIS) was 10mV, and the frequency was from 100kHz to 10mHz. The gas collected in the gas bag by drainage collection method was determined by gas chromatography (Thermo Fisher Scientific, Waltham, MA, USA) to determine the concentration of H2, N2, CO2 and CH4.
3. RESULTS AND DISCUSSION
3.1 Characterization of Ni/P mixture
1 2 3 4 5 6 7 8 9 10
O
Ni Ni
Inte
nsit
y
/ a.u.
Energy / keV
C
Ni
P
30 40 50 60 70 80 90
(a)
40 50 60 70 80 90
In
te
n
si
ty
/
a
.u
.
2-Theta / degree
(201)
C(004)
(d) (c) (b)
Inte
nsit
y/ a.u.
2-Theta / degree
(a) C-Ni (b) C-Ni-P(50:20) (c) C-Ni-P(50:30) (d) C-Ni-P(50:40)
(201)
C(004) (111)
(200)
(220)
[image:4.596.98.501.142.493.2]D
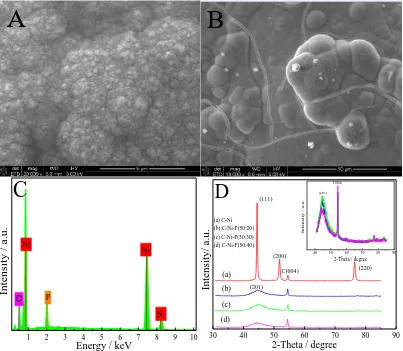
Figure 1. SEM photos of Ni (A) and Ni/P (B). EDS analysis of Ni/P electrode(C). XRD patterns of Ni and Ni/P (D).
Table 1. EDS analysis of element composition of the Ni/P catalyst
Element Weight percentage% Atomic percentage%
Ni 80.82 58.95
P 7.96 11.01
O 11.22 30.04
The surface morphology of bare Ni and Ni/P was examined with SEM (Fig. 1). Fig. 1A shows that nickel metal particles formed on the carbon paper substrate, and the particles were similar to prismatic stones and were closely arranged. When P merged with Ni, the substrate surface was completely covered by uniform continuous Ni/P coating, and the coating had a nodular structure similar
[image:4.596.84.514.593.665.2]
to a cauliflower surface (Fig. 1B) [25]. This structure greatly increased the specific surface area of the material and exposed additional hydrogen evolution sites.
The surface element composition of the prepared catalyst was analyzed by EDS. The Ni/P EDS spectrum indicated the presence of Ni, P and O (Fig. 1C). The results in Table 1 showed the percentage of each element. Evidently, the cathode catalyst was successfully synthesised.
The crystalline structure of Ni and Ni/P electrode materials are shown in Fig. 1D. The peak value of all electrode materials was approximately 54.54°, which was attributed to the graphite (004) surface of carbon support. The diffraction peaks were observed at 44.50°, 51.85° and 76.38° and assigned to the (111), (200) and (220) peaks of Ni, respectively (JCPDS File Card No. 87-0712). The Ni/P amorphous diffraction peak at 44.59° of 2-theta in the presence of phosphorus indicated that the Ni/P electrode materials had an amorphous structure [26] different from the crystalline structure with excellent physical and chemical properties. As the proportion of phosphorus increased in the plating solution, the relative intensity of the peak initially increased first and then decreased at 44.59°. Thus, the crystallinity of the electrode material initially increased and then decreased. Particularly, when the Ni2+/PO43- ratio was 50:30, the crystallinity was the highest.
1000 800 600 400 200 0
Int
en
sit
y
/
a
.u
.
Binding energy / eV
P 2p C 1s O 1s
Ni 2p
A
890 880 870 860 850 840
Ni 2p1/2
Inte
nsit
y
/ a.u.
Binding energy / eV 874.9eV
Ni 2p1/2
Ni 2p3/2856.8eV
Ni 2p3/2 853.8eV
Ni 2p
862.9eV
sat
B
145 140 135 130 125
Inte
nsit
y
/ a.u.
Binding energy / eV P 2p
P 2p1/2133.1eV
139.9eV
P 2p3/2 129.9eV
C
545 540 535 530 525
Inte
nsit
y
/ a.u.
Binding energy / eV O 1s
O 1s 531.7eV
D
The chemical state and elemental composition of Ni/P electrode materials were studied by the X-ray photoelectron spectroscopy (XPS). The XPS spectra of Ni/P in Fig. 2A showed the existence of Ni, P, C and O. In the high-resolution spectrum of Ni 2p in Fig. 2B, the peak centre at 853.8 and 862.9 eV were attributed to the metallic nickel, whereas the peaks at 856.8 and 874.9 eV and its satellite with Eb = 881.1 eV were from nickel oxide (Ni2+) [21] [27-28]. In Fig. 2C, the peaks located at approximately 129.9 and 133.1 eV corresponded to P0 and oxidised P (P5+) [29]. In Fig. 2D, the binding energy of O1s positioned at 531.7 eV was attributed to the oxygen bonded to Ni in the mixture oxide [30].
3.2 Electrochemical performance test
-2.0 -1.5 -1.0 -0.5 0.0 0.5 -250
-200 -150 -100 -50 0 50 100
Current
/ A
m
-2
Potential / V Bare C-Ni C-Ni-P(50:20) C-Ni-P(50:30) C-Ni-P(50:40) Pt
50:30 Pt
[image:6.596.196.393.211.397.2]50:40 Bare C-Ni 50:20
Figure 3. LSV curves of different cathodes over a potential range of 0.5 to -2 V at a scan rate of 1 mV s-1 in practical MEC reactors.
The electrocatalytic activity of the electrode materials in neutral (PBS) electrolytes was studied by linear sweep voltammetry (LSV) from 0.5 V to -2 V (vs. Ag/AgCl). Fig. 3 shows that the bare CP electrode had minimum current response within the scanning range, indicating that bare CP has the minimum catalytic capacity for HER. The current densities of Pt, Ni and bare CP were 137.98, 90.88 and 75.99 A m−2, respectively, at the potential of -1.5 V. The current response of the Ni/P electrode was greater than that of bare CP and or Ni, indicating that the Ni/P composite had the ability to generate hydrogen, but the catalytic ability of the composite was different with a different raw plating solution ratio. After the reduction of the Ni2+/PO43- ratio in the catalyst, the hydrogenation catalytic capacity of the catalyst initially increased and then decreased. The current density was 154.18 A m-2 when the Ni2+/PO43- ratio was 50:30, which was 12% larger than Pt, showing that Ni/P has good hydrogen production performance.
-1.2 -0.8 -0.4 0.0 0.4
-6.0 -4.5 -3.0 -1.5
logi/
i0
/ A
m
-2
E / Vvs.Ag/AgCl
Bare C-Ni-P(50:30) Pt
A
-4.50 -4.25 -4.00 -3.75 -3.50
-0.45 -0.48 -0.51 -0.54 -0.57
Potent
ia
l / V
vs
Ag/AgCl
logi / mA cm-2
Bare C-Ni-P(50:30) Pt
100.5 mV/dec
37.5 mV/dec 42.9 mV/dec
[image:7.596.101.495.113.290.2]B
Figure 4. Electrode process kinetics analysis. (A) Potentiodynamic polarisation curves were obtained by sweeping the potential from -1.2 V to 0.6 V at a scan rate of 10 mV s−1 of cathodes. (B) The linear fit for the Tafel plots.
Furthermore, Tafel polarisation curves were used in the evaluation of the catalytic kinetics and hydrogen evolution mechanism of the prepared electrode [33]. The hydrogenation rate increased when the slope of the catalyst decreased [34].
H3O+ + e- + M→MHads + H2O (StepⅠ) MHads + H2O+ + e- →H2↑+ H2O (StepⅡ)
2MHads →2M + H2↑ (StepⅢ)
Figure 5. Nyquist plots of bare CP, Ni/P and Pt from 100kHz to 10mHz vs. Ag/AgCl (A). Equivalent circuit model of different cathode materials (B).
The HER kinetics of Ni/P electrodes were further studied through Electrochemical impedance measurement (EIS). Fig. 5A shows that the equivalent circuit diagram (Fig. 5B) was obtained by fitting with Zsimpwin software [37]. The charge transfer resistance (Rct) was obtained from the semi-circular diameter of the EIS Nyquist diagram, and the charge transfer process on the electrode was evaluated.
The charge transfer performance improved when the value was decreased [38]. The charge transfer resistance of CP was 17.35 Ω by fitting when the ratios of Ni2+/PO43- were 50:20, 50:30 and 50:40, and the charge transfer resistance values were 13.21, 8.69 and 11.44, respectively, which were far lower than those of CP. When the Ni2+/PO43- ratio was 50:30, the charge transfer resistance was 49.94% smaller than CP, which has better electrocatalytic properties for HER.
3.3 hydrogen production performance of different cathodes
0 150 300 450 600 750
3.75 7.50 11.25 15.00 18.75 22.50 Current de ns ity / Am -2
Time / min
Bare C-Ni C-Ni-P(50:20) C-Ni-P(50:30) C-Ni-P(50:40) Pt
A
Bare C-Ni 50:20 50:30 50:40 Pt
0 15 30 45 60 75 90 Gas volume / mL Gas co mpo nen t / % H2 CH4 CO2
B
6 8 10 12 14 16B
CPE Rs Rct0 120 240 360 480
0 150 300 450 600 750
0 20 40 60 80 100 120 4
5 6 7 8 9 10
Current densit
y / Am
-2
Time / h C-Ni-P(50:30)
C
Figure 6. Current generation of different cathodes electrodes in the MECs (A), the MEC gas composition per cycle (B) and relationship between current density of Ni/P electrode and time(C)
Subsequently, the hydrogen production performance test was carried out. The cathode material used Pt to stabilise the MEC reactor for two months, converting the cathode to Ni, Ni/P and CP. Three tests were performed for each cathode cycle, at 12 hours per cycle, and the data were recorded every half hour. Fig. 6A shows the results of one test. The hydrogen production current of all electrode materials initially increased as the nutrient was exhausted, then the current decreased. The average hydrogen production currents of Ni, Pt and CP were 15.06, 17.97 and 12.48A m-2, respectively. All Ni/P cathodes with different phosphorus content had higher current density than Ni, Pt and CP. The Ni2+/PO43- ratio was 50:30, and the current density was 23.05 A m-2, which was 84.69% larger than CP and 28.26% larger than Pt. The higher current density suggested that more electrons can be transferred to the cathode to produce hydrogen. Therefore, the electrodeposition of Ni/P catalyst on carbon paper increased the catalytic activity to HER.
[image:10.596.85.512.194.262.2]
Subsequently, an electrode material with a Ni2+/PO43- ratio of 50:30 was continuously reacted with MEC for ten cycles. The current density increased rapidly and then tended to be stable. As the nutrient decreased, the current density decreased as well. Fig. 6C shows that the stable current density of Ni/P is 22.86 A m-2, and the Ni/P electrode has good stability after ten cycles of operation.
Table 2. Energy efficiencies and hydrogen production rates in the MEC with different cathodes Cathode rcat (%) QH2(m3H2m-3 d-1) ηW (%)
CP 58.04±1.12 0.125±0.004 72.27±3.17
C-Ni-P(50:30) 74.54±0.89 0.321±0.012 135.11±5.36
Pt 63.86±3.32 0.213±0.009 122.79±5.09
The cathode hydrogen recovery rate (rcat), hydrogen production rate (QH2) and energy efficiency
(ηW) relative to the electrical input of the three cathode MECs were calculated (Table 2). These results showed that the rcat, QH2 and ηW of the Ni/P cathode were higher than the Pt. Thus, the catalytic hydrogen
production capacity of Ni/P is better than that of Pt and, more importantly, is low cost.
4. CONCLUSION
We report a low-cost and advanced catalyst for Ni/P composite prepared by electrodeposition on bare CP. An amorphous Ni/P composite with uniform density and cauliflower shape was prepared by the electroplating method. The results showed that the electrochemical performance and hydrogen production performance of Ni/P is better than Ni, Pt and CP. Particularly, when the Ni2+/PO43- ratio is 50:30, the electrochemical performance and hydrogen production performance are optimal. Adding an appropriate amount of phosphorus can accelerate the kinetics and ultimately improve the hydrogen evolution performance. Thus, the Ni/P catalyst with low cost and high electrocatalytic performance may serve as a promising cathode catalyst for MECs.
ACKNOWLEDGEMENTS
This work was funded by the Provincial Natural Science Foundation of Shanxi Province, China (2014011014-6, 201701D121028). The authors also acknowledged the Institute of Coal Chemistry, Chinese Academy of Sciences for technical assistance.
References
1. T. Niyitanga, H. K. Jeong, Chem. Phys. Let., 685 (2017) 451.
2. D. Z. Wang, Z. Pan, Z. Z. Wu, Z. P. Wang, Z. H. Liu, J. Power Sources, 264 (2014) 229. 3. N. S. Alhajri, D. H. Anjum, K. Takanabe, J. Mater. Chem. A, 2 (2014) 10548.
4. L. Xiao, Z. H. Wen, S. Q. Ci, J. H. Chen, Z. He, Nano Energy, 1 (2012) 751.
6. A. Kundu, J. N. Sahu, G. Redzwan, M. A. Hashim, Int. J. Hydrogen Energy, 38 (2013) 1745. 7. F. J. Li, W. F. Liu, Y. Sun, W. J. Ding, S. A. Cheng, Int. J. Hydrogen Energy, 42 (2016) 3641. 8. M. Su, L. L. Wei, Z. Z. Qiu, G. W, J. Q. Shen, J. Power Sources, 301 (2016) 29.
9. M. S. Ide, D. D. Falcone, R. J. Davis, J. Catal., 311 (2014) 295.
10.N. Liu, L. C. Yang, S. N. Wang, Z. W. Zhong, S. N. He, X. Y. Yang, Q. S. Gao, Y. Tang, J. Power Sources, 275 (2015) 588.
11.J. He, L. Z. Song, J. Y. Yan, N. Kang, Y. L. Zhang, W. Wang, Metals, 7 (2017) 211.
12.X. Xiao, L. M. Tao, M. Li, X. W. Lv, D. K. Huang, X. X. Jiang, H. P. Pan, M. K. Wang, Y. Shen, Chem. Sci., 9 (2018) 1970.
13.X. D. Jia, Y. F. Zhao, G. B. Chen, L. Shang, R. Shi, X. F. Kang, G. I. N. Waterhouse, L. Z. Wu, C. H. Tung, T. R. Zhang, Adv. Energy Mater., 6 (2016) 1502585.
14.Y. Huang, Q. F. Gong, X. N. Song, K. Feng, K. Q. Nie, F. P. Zhao, Y. Y. Wang, M. Zeng, J. Zhong, Y. G. Li, ACS Nano, 10 (2016) 11337.
15.W. W. Cai, W. Z. Liu, H. S. Sun, J. Q. Li, L. M. Yang, M. J. Liu, S. L. Zhao, A. J. Wang, Appl. Energ., 209 (2018) 56.
16.D. S. Kong, H. T. Wang, Z. Y. Lu, Y. Cui, J. Am. Chem. Soc., 136 (2014) 4897.
17.Y. Y. Liu, M. Y. Fan, X. Zhang, Q. Zhang, D. Guay, J. L. Qiao, Electrochim. Acta, 248 (2017) 123. 18.H. J. Feng, L. J. Huang, M. Z. Wang, Y. F. Xu, D. S. Shen, N. Li, T. Chen, K. Guo, Int. J. Hydrogen
Energy, 43 (2018) 17556.
19.H. Q. Hu, Y. Z. Fan, H. Liu, Int. J. Hydrogen Energy, 35 (2010) 3227.
20.E. J. Popczun, J. R. McKone, C. G. Read, A. J. Biacchi, A. M. Wiltrout , N. S. Lewis, R. E. Schaak, J. Am. Chem. Soc., 135 (2013) 9267.
21.Y. X. Wang, Y. Zhao, A. L. Wu, Z. S. Dong, J. Li, J. W. Wang, Int. J. Electrochem. Sci., 13 (2018) 10848.
22.L. Gil-Carrera, A. Escapa, B. Carracedo, A. Moran, X. Gomez, Bioresource Technol., 146 (2013) 63.
23.T. Catal, K. L. Lesnik, H. Liu, Bioresource Technol., 187 (2015) 77.
24.Z. Y. Zhang, S. S. Liu, J. Xiao, S. Wang, J. Mater. Chem. A, 4 (2016) 9691.
25.H. H. Wu, F. Liu, W. B. Gong, F. Y. Ye, L. F. Hao, J. B. Jiang, S. Han, Surf. Coat. Tech., 272 (2015) 25.
26.X. Xu, C. J. Li, J. G. Lim, Y. Q. Wang, A. Ong, X. W. Li, E. Peng, J. Ding, ACS Appl. Mater. Inter., 10 (2018) 30273.
27.W. Li, D. H. Xiong, X. F. Gao, W. G. Song, F. Xia, L. F. Liu, Catal. Today, 287 (2017) 122. 28.S. Pintea, V. Rednic, P. Mărginean, N. Aldea, H. T, Z. H. Wu, M. Neumann, F. Matei, Superlattice.
Microst., 46 (2001) 130.
29.F. H. Wang, Y. J. Zhang, Y. N. Wang, Y. M. Luo, Y. N. Chen, H. Zhu, Int. J. Hydrogen Energy, 43 (2018) 8805.
30.W. W. Zhang, B. S. Li, Int. J. Electrochem. Sc., 13 (2018) 3516.
31.D. H. Duan, J. W. Liang, H. H. Liu, X. You, H. K. Wei, G. Q. Wei, S. B. Liu, Int. J. Hydrogen Energy, 40 (2015) 488.
32.L. H. Yi, L. Liu, X. Liu, X. Y. Wang, W. Yi, P. Y. He, X. Y. Wang, Int. J. Hydrogen Energy, 37 (2012) 12650.
33.G. T. Fu, Z. M. Cui, Y. F. Chen, Y. T. Li, Y. W. Tang, J. B. Goodenough, Adv. Energy Mater., 7 (2017) 1601172.
34.Y. P. Li, Z. G. Jiang, J. L. Huang, X. H. Zhang, J. H. Chen, Electrochim. Acta, 249 (2017) 301. 35.B. E. Conway, B. V. Tilak, Electrochim. Acta, 47 (2002) 3571.
36.M. Ledendecker, S. K. Krick, C. Papp, H. P. Steinrˆıck, M. Antonietti, M. Shalom, Angew. Chem. Int. Edit., 54 (2015) 12361.
38.C. Wu, Y. J. Yang, D. Dong, Y. H. Zhang, J. H. Li, Small, 13 (2017), 1602873.
39.A. J. Wang, W. Z. Liu, S. A. Cheng, D. F. Xing, J. Z. Zhou, B. E. Logan, Int. J. Hydrogen Energy, 34 (2009) 3653.