REGIONAL REVIEW
Introduction
In February 1995, Scottish unemployment fell by 5,532 to stand at 219,200. This represents a monthly fall of 2.5% and leaves 8.7% of the Scottish workforce unemployed. The bulk of the decline is due to males. Male jobless fell by 5,040 or by 2.9% whilst the female count declined by 492 or by 1% Male unemployment presently stands at 168,300 or 12V4% of the workforce and the female at 49,900 or AVi% of the female workforce. The unadjusted series for both Scotland and GB is set out in Table 1.
Examination of Table 1 indicates that falls in British unemployment in February were less sharp than in Scotland. Total unemployment in the British Isles fell by 1.8% to stand at 2,368,266 which constitutes 8.6% of the GB workforce. Thus, the Scottish unemployment rate is currently above the GB level and has been since June 1994. In Britain, male unemployment fell by 1.9% to stand at
1,810,840 or 11%% of the workforce. In the case of females, the monthly drop in February was 8,147 or 1V2% which compares favourably with the 1% fall posted in Scotland. The female count stood at 557,426 and the rate at 4%%. Unlike the male rate, the Scottish female rate is lower than the national average.
The jobless count tends to rise in February due to seasonal factors. These tend to affect peripheral regions such as Scotland to a more significant extent. The seasonally adjusted series for Scotland and GB are set out in Table 2. This indicates that, in February, total unemployment fell by 2,200 or 1.05% which compares unfavourably with the 1.16% fall evident in GB. The Scottish male count fell by 1,600 or circa 1% and the female by 600 or by 1.26%. The male fall is less sharp than the 1.14% posted in GB whilst the fall in women unemployed is similar in Scotland and GB.
In February, the seasonally adjusted count stood at 207,900 or 8.3% of the Scottish workforce. This is exactly the same rate as is evident in Britain. Indeed, inspection of Table 2 suggests that the Scottish and British rate have been at the same level since June 1994. The Scottish male rate has been consistently above the national position since
Quarterly Economic Commentary
Feb 1994 whilst the Scottish female rate remains below the British level. In February 1995, Scottish unemployment stood at 160,800 (11%%) and the GB count at 1,736,600 (11V4%). Female jobless in Scotland totalled 47,100 or 4%% of the workforce whilst the GB count was 537,500 or 4>A%.
In the quarter to February 1995, seasonally adjusted unemployment in Scotland fell by 8,700 or by 4% whilst jobless in Britain fell by 100,300 or by 414%. These are substantial quarterly falls, In the case of men, the count dropped by 6,500 or 3.9% which compares unfavourably with the 4.1% fall recorded nationally. The quarterly fall in Scottish female unemployed was 2,200 or 4.46% which is slower than the 4.7% fall evident in GB.
In the year to February 1995, Scottish jobless fell by 28,900 or by 12.2% whilst the GB count fell by 14.3%. For both males and females the annual fall is sharper in GB than in Scotland. The Scottish male count fell by 22,500 or by 12V4% which is a weaker performance than in GB where male jobless decreased by 300,800 or by 14%%. In the case of females, the Scottish count fell by 6,400 (12%) and by 76,600 (12%%) nationally.
As we have argued in previous Commentaries, there have been large cyclical rises in unemployment in the more southern parts of the country. We have consistently argued that these would abate in recovery and that Scotland would begin to under perform relative to the rest of the country. Since unemployment peaked in Dec 1992 the falls in Scottish unemployment have tended to be less pronounced than in GB as a whole. However, unemployment in Scotland is currently marginally below the 208,100 posted in Feb 1990 before the onset of recession. The male count is 9,300 higher but the female count 9,500 lower. In the GB and other parts thereof, the count remains substantially above 1990 levels.
In this review, we will examine the trend in employment and unemployment in the GB regions in order to shed some light on why unemployment is falling. We will then consider the position of the LA regions, LECs and TTWAs within Scotland with respect to unemployment. The final section will set out our impressions and conclusions.
Volume 20, No. 3, 1995
Employment in the British Regions
Whilst the fall is unemployment described above are readily observed, an explanation for them has been less forthcoming. In particular, the Department of Employment's Civilian Workforce estimates presented a picture of falling employment at a time when unemployment was likewise tumbling. In the 1992-92 period, this created the impression that unemployment in Scotland was falling due to falls in population and a pronounced 'discouraged worker' effect. In this period the Labour Force Survey likewise supported this contention. In 1993, the trends diverged providing radically different views of the underlying strength of labour demand. In this section, we will examine employment trends in Scotland, GB and in 3 constructed GB regions. We will present labour market accounts for the
1993-94 period.
Criticism of the DoE employer based jobs estimates has provoked a major revision to the underlying series. Table 3 sets out the differences between the former and revised position for both Scotland and GB. The revision relates to the employees in employment series and dates back to Autumn 1991 when the last published Census of Employment was undertaken. The revisions apply to construction and service activities.
At September 1993, the revised estimates result in an increase of 29,771 jobs compared with the previous figures. This comprises a rise of 28,812 construction jobs, 373 in Transport and Communication and 586 in Other Services. The revision favours male jobs with a rise of 29,829 alongside a fall of 58 female posts and Full Time posts which increased by 29,975 at a time when there was a 204 fall in Part Time work. As a result, females no longer constitute a majority of Scottish employees.
In GB, the rewrite engenders a rise of 112,239 jobs suggesting that Scotland accounts for 26%% of the net revision. Nationally, Construction has been underestimated by 124,791 but Transport and Communication and Other Services overestimated by 2,962 and 9,860 respectively. Male jobs are up by 114,417 and womens employment down 2,178 whilst both full time and part time jobs are up by 88,037 and 24,202 respectively. There is a major write down of full time posts in Other Services and smaller corresponding rise in part time workers.
The revision has altered the trends in employment, particularly in Construction. The original data
Quarterly Economic Commentary
suggested that, in the year to Sept 94, Scottish employees decreased by 21,083 or by 1.1%. The revision moderates this fall suggesting a decrease of 8,653 or 0.4%. In Construction, the trend is reversed. Prior to the rewrite, Construction employment was thought to have declined by 3,875 or 3%%. Construction jobs are now estimated to have increased by 7,978 or 6V4% In GB, the fall in total employment in the year to Sept 94 has been written down from 27,873(-0.1%) to 6476 (-0.0%). In Construction, the former estimates provided for a fall of 27,512 (-3Vi%) jobs whilst the new figures suggest a rise of 20,421 (+2%%).
In the 2 years to Sept 1994, Scottish employment is now estimated to have fallen by 13,571 (%%) compared with 27,730 (1.4%), pre revision. In GB, the former data suggested that employment had been flat in this period with a fall of 1,434. The present estimates suggest an increase of 72,612 British jobs which constitutes a rise of 0.3%. In both Scotland and GB, the revision bears particularly heavily on the 1993 data.
The Financial Times welcomed this revision under the headline 'Rewrite of History creates jobs'(FT: 16/03/95).The report argued that 'as if by magic, the Department of Employment yesterday conjured
120,000 extra jobs dispelling the idea that Britain has had a "jobless recovery'". The revision certainly helps but still suggests modest growth in employees.
The new estimates to Dec 1994 for the Civilian Workforce are set out in Table 4. The Civilian Workforce in Employment(CWE) comprises Employees in Employment, Self Employed and Government Trainees. In the quarter to Dec 94, the British CWE increased by 184,000 (0.7%) with employees rising by 100,000 (0.5%), self employed by 68,000 (2.1%) and trainees by 16,000 (5.9%). The male CWE increased by 50,000 (0.4%) and the female by 135,000 (1V4%). The male position reflects a 16,000 (1%%) fall in employees offset by a 55,000 (2.3%) rise in self employed and 10,000 (5.8%) increase in Government Trainees. A 116,000 (114%) rise in female employees provides the bulk of the female increase.
In the 2 years to Dec 1994, the CWE rose by 303,000 (114%), employees by 162,000 (0.8%) and self employed by 193,000 whilst the number of government trainees fell by 52,000 (15.4%). In the case of males, the CWE rose by 81,000 (0.6%) which comprises a fall of 24,000 (-0.2%) employees, 37,000 trainees offset by a rise of
142,000 (6.1%) self employed. In the female market, the CWE is projected to have risen by 222,000 (2%). This consists of a rise of 186,000 (1%%) employees, 50,000 self employed (614%) abated by a 14,000 fall in trainees. These rises in self employment and female employment are nothing short of remarkable especially given that the bulk of the increases are due to the current quarter. It is very hard to believe!
December 1992 constitutes the peak in UK unemployment following the early 1990s recession. In the 2 year period to Dec 1994, British unemployment fell by 540,800, male unemployment by 426,600 and female by 114,200. The revised employment estimates may provide a more plausible account of labour demand growth in a fast recovering economy. However, they do not accord well with the scale and gender balance of the jobless fall. This reinforces the conclusion in the FT that 'a wide ranging employment department study is due in the coming months and is almost certain to trigger another rewriting of the history books'.
This sentiment is reinforced by consideration of die regional changes in employment. The situation in Scotland remains problematic. In the recent quarter, the Scottish CWE declined by 14,000 or by 0.6%. This comprised a fall in employees of 25,000
(-1.3%) offset by rises in self employment of 12,000 (5.6%) and government trainees of 1,000 (3.6%). Bom male and female employment declines with male employees decreasing by 18,000 or 1.8%
In the 2 years to Dec 1994, Scottish employment declined by 20,000 (0.9%). This is due to a 23,000
(Wi%) fall in employees, a 10,000 (25.6%) decline
in government trainees moderated by a 14,000 (6V4%) rise in self employed. Male employment fell by 17,000 (-1.4%) comprising a fall of 21,000 (2.1%) employees and 6,000 (24%) trainees offset by a rise on self employed of 9,000 (5Vz%). Female employment fell by 3000 (V4%) with employees down by 4,000 (0.4%) and trainees by 4,000 (30.8%). Female self employed rose by 5000 or by 10%. Across this period, Scottish unemployment fell by 37,400 with the male count down by 42,600 and the female count by 8,900. On these estimates, Scotland is clearly experiencing jobless growth which cannot explain the scale and pattern of the sharp reductions in the claimant count.
The situation in 3 constructed regions is also set out in Table 4. The South of England comprises London, East Anglia, the South West and the rest of the South East. Midlands & Wales comprises
East and West Midlands and Wales whilst the North of England encompasses Yorkshire and Humberside, the North West and the Northern region. This data suggests that the recovery in labour demand is strongest in the South due to sharp increases in self employment and female employees. A strong trend in self employment is evident is Midlands & Wales where employee growth is stronger whilst the picture in the North is poorer in all respects.
Again, it is hard to reconcile the changes in employment with the sharp fall in unemployment. In all areas, the fall in unemployment is much sharper than the fall in employment. Indeed, in the North, employment fell by 33,000 whilst unemployment fell by circa 125,000. In all regions, the falls in male unemployment are significantly sharper than the estimated changes in jobs whilst the increases in female employment are less than the falls in female jobless. The female case is plausible and in a fast growing female market. However, the male situation is less easy to square.
The Labour Force Survey provides an alternative picture of regional labour demand. The LFS is a survey of residents whilst the DoE series is a survey of businesses. Abstracting from the small number of people who hold 2 or more jobs and cross border commuting, the series should yield a similar account of labour demand. As noted previously, this is not the case. The trends for Scotland GB and our 3 constructed regions are set out in Table 5. The self employment estimates in the DoE data are now due to the LFS and the differences in the figures are due to differences in measurements of employees and trainees.
The LFS suggests that British employment rose by 25,000 in the last quarter compared with a rise of 184,000 in the DoE data. The male rise is greater than the female unlike in the DoE data. The LFS estimate that the number of employees fell by 59,000 compared with a rise of 100,000 posted by the DoE. In 2 years to end 94, the LFS indicates that male employment increased by 145,000 and female by 104,000. In a similar period, the DoE records a rise of 81,000 male jobs and 222,000 females. The LFS indicates that GB employees increased by 143,000 compared with 162,000 recorded in the DoE. Given the divergent disposition of male and female employment any similarity between the employee trends is probably co-incidental.
The LFS data confirms that Scottish jobs fell by
14,000 in the quarter to Dec 95 but suggests a rise in female employment of 2000 and a fall of 16,000 in males. The DoE data indicates a fall in male employment half that suggested by the LFS and a fall of 6000 female jobs. The LFS suggests that the number of Scottish employees fell by 27,000 which is similar to the estimate provided by the DoE series. Again this conformity appears to be a bit of a fluke. In the 2 years to end 94, the LFS suggests a rise in employment of 15,000 comprising a fall of 5000 males offset by a rise of 20,000 females. The DoE data sets out a fall 20,000 with fall in jobs for both sexes. The LFS suggests a rise of 15,000 employees whilst the DoE implies a fall of 23,000. The position in our 3 constructed regions is set out in Table 5. Whilst the LFS also suggests that the recovery is strongest in the South, the LFS paints a bleaker picture of the jobs market in Midlands & Wales and North. In addition, detailed examination reveals the same basic inconsistencies in the male and female trends evident above.
The revisions made to the DoE series and the large increases in the recent quarter have gone some way to reconciling the 2 series. However differences in the male, female and regional trends suggest that the 2 surveys are presenting an irreconcilable view of the British and Scottish labour markets. Despite the revisions it remains a tale of 2 surveys as is shown in the next section where we present labour market accounts based on the 2 employment measures.
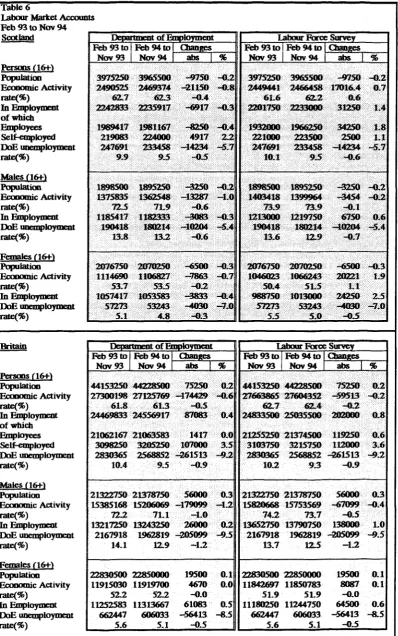
The Labour Market in the British Regions Table 6 presents labour market accounts for Scotland, GB and our 3 constructed regions. One version is based on the DoE employment estimates whilst the other utilises the LFS. Normally the LFS records unemployment based on the ILO definition. This is based on asking people who are not in work whether they looked for a job in the period in question. It differs from the claimant count which is a measure of eligibility for benefit. This the ILO measure overstates female jobless and understates male jobless compared with the conventional unemployment measures.
In this exercise we use the claimant count and copies of the accounts based on ILO unemployment are available from the Institute on request. The DoE employment series is based on different months to the LFS. The DoE data has been adjusted for this in order to maximise comparability. Both sets of measures are the averaged over the Feb-Nov
periods to provide proxies for 1993 and 1994. In GB, unemployment fell by 261,513 or by 9VA%. This comprises a fall in male jobless of 205,099 (9>/2%) and female jobless of 56,413 (8'/2%). GB 16+ population increased by 75,250 which is not favourable for unemployment because it implies an increase in working age labour supply chasing available opportunities. The two surveys tell radically different stories of why unemployment is falling.
The DoE account sees employment rising by 87,083 which is 30.0% of the fall in unemployment. The bulk of the jobless fall is due to 174,429 fall in labour market participation. As a result, the economic activity rate falls from 61.8% to 61.3%. Male employment rose by 26,000 or 0.2% which is weaker than the growth in female labour demand. The majority of the 205,099 fall in male unemployment is due to a 179,099 fall in economic activity. As a result, the male Economic Activity (EA) rate fell from 72.2% to 72.1%. In the case of females, employment grew by 61,083 or by Vi%. Unemployment fell by less and labour force participation rose by 4,670. The female participation rate stayed constant at 52.2% in both years.
The LFS version has GB employment growing by 202,000 which constitutes 11%% of the fall in unemployment. Thus, there is still a decline in participation of 59,513 which is less sharp than that implied by the DoE. The EA rate dropped to 62.4% from 62.7% in 1994. In the case of males, a
138,000 rise in employment engenders a 205,099 drop in claimants due to a fall in activity of 67,099. As a consequence, the EA rate fell from 74.2% in 1993 to 73.7% last year. Female employment rose by 64,500 which is similar to the 61,083 suggested by the DoE analysis. The implications are similar with the LFS indicating a small rise in activity and static EA rate.
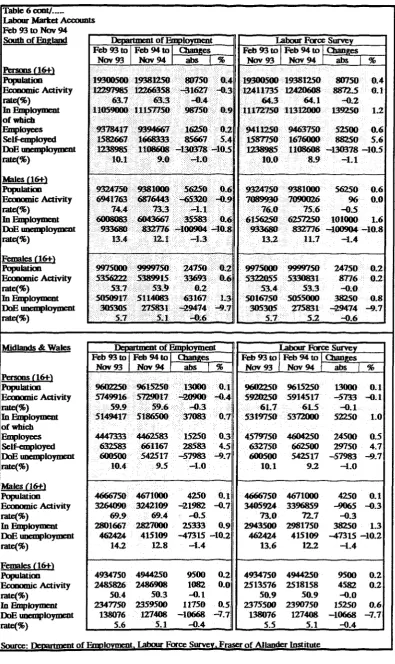
Labour market accounts for our 3 constructed regions are set out in Table 6. These indicate that unemployment is falling faster in the South and slowest in the North. For both accounts, the falls in joblessness are in some part due to falling labour market participation in all 3 areas. Indeed, female participation rates fell in the South and the North and remained static in Midlands & Wales. The differences are in the strength of the effect. The DoE series in all cases implies a sharper fall in activity than the LFS. However the message is a broadly similar one of falling unemployment being due in some part to falling labour market
participation.
Not so in Scotland where we are dealing with a veritable tale of two surveys. In this period, Scottish unemployment fell by 14,132 or 5.7%. This comprises a fall in male unemployed of 10,204 (5.4%) and in female jobless of 4,030 (7%). These are less sharp falls than in GB or any of the 3 constructed regions. Scottish population fell by 9,750 or by 0.2%. In principle, this should facilitate falls in unemployment.
According to the DoE estimates, employment likewise fell by 6,917. Thus, the drop in unemployed was entirely due to a sharp fall in labour market participation. In consequence, the economic activity rate fell from 62.7% to 62.3%. This is evident for both males and females. Male employment decreased by 3,083 at a time when male jobless fell by 10,104. This implies a 21,150 decline in activity with the rate falling from 72Vi% to 71.9%. In the case of females, a decline in employment of 3,833 is attended by a 4,030 fall in unemployed and a 7,863 fall in activity.
The LFS indicates that employment increased by 31,250 or by 1.4%. This is sharper than in GB or in any of the 3 large GB regions. Unemployment fell by 14,237 whilst activity rose by 17,016 suggesting that the sharp rise in employment did not favour the unemployed who were beaten to the new opportunities by those not in activity. The EA rate increased from 61.6% to 62.2%. In the case of males, employment rose by 6,750 at a time when unemployment fell by 10,204. Economic activity fell by 3,454 but the rate stayed stable at 73.9%. Female employment rose by 24,250 or by 2Vi% whilst female jobless fell by 4030. Thus, female jobless fell by less than it might have due to a 20,221 rise in labour market participation. The EA rate rose from 50.4 to 51'/2%.
In Scotland, the DoE series suggest that, for both men and women, both employment and unemployment are falling because of sharp falls in activity for both men and women. The stronger employment growth in the LFS moderates this effect in the case of men. However, the fall in Scottish male unemployment is in part due to falling participation. In terms of women, the LFS suggests that unemployment fall has been checked by a rise in participation. The LFS tells a different story and casts doubt on the competitiveness of the female jobless pool. The rise in the overall activity rate in Scotland is entirely due to developments in the female labour market.
Given that the Scottish economy grew by 3.3% and the UK economy by 4% in this period, the LFS provides a more plausible explanation of developments in national and regional labour markets. This is not an endorsement!. Economists are critical of the DoE series because it does not accord with expectations of labour demand at this stage of a strong recovery. This is not to suggest that the LFS is accurate, it is simply more plausible to the vast majority of the economics profession.
There are problems with the LFS relating to the sample size. Even at the level of the GB regions, there appear to be difficulties. The NOMIS database deliberately omits the facility to make direct comparison between LFS at different points in time. It is for this reason that we average a number of surveys in attempting any assessments across time. Even this should have a health warning and needs careful interpretation. In addition, except for Scotland, we report GB and large constructed regions.
The Scottish series is noisy. The August measure of employment seems extremely high due to an estimate for employees of 1,998,000. This is completely out of line with neighbouring periods and could be an outlier. However, a similar trend is evident in the DoE series. Alternatively, the fall at the end of the year could likewise be suspect. In addition, the self employment series is extremely volatile with an unexplained surge in female self employment in 1993 and subsequent decline. The male series has similar characteristics with a questionably high estimates of 172,000 posted in Dec 1993 and 169,000 in Mar 94.
It is our view that the Scottish Economy is performing a little less well than suggested by our analysis of the LFS. Our view is set out in the Outlook and Appraisal. However, we believe that labour demand is growing and growing fast at present. The labour market accounts present an estimate of the change across annual averages. At the end of 1994 and at present, it remains our view that labour demand growth is strong and that unemployment is falling largely for this reason. At present, we expect that employment is growing faster than unemployment is falling. This suggests that the published claimant counts may be a better approximation to underlying demand conditions than is normally the case.
The composition of employment growth is another matter. The male labour market appears slacker than that of females. In the next section we
examine the detailed pattern of change as set out by the DoE.
Sectoral Employment Change: 1993-1994 Table 7 presents the annual estimates of sectoral change in employees in Scotland and GB for 1993 and 1994. The estimates are due to the DoE and are subject to the caveats set out above. The data sets out employees by SIC 1980 industrial division and by gender and by full time and part time work. The annual estimates are derived by averaging the 4 observations from March to December in each year. These figures are not comparable with those presented above in the labour market accounts.
In Scotland, the number of employees fell by 10,253 in the 1993 to 1994 period. This constitutes a Vi% fall and compares unfavourably with the static position in the British Isles where there was a marginal rise of 2,639. North of the Border, the 10,253 fall was due to drop of 5,416 male jobs and 4,837 female jobs and a fall of 19,282 full time jobs offset by a rise of 9,029 part time jobs. The Scottish fall in full time employees of 1.3% is sharper than the GB decrease of 0.8% whilst the rise in part time work of 1.7% is slower than the national rise of 2%.
In Scotland, construction employment increased by 4,664 or 3.9% which compares favourably with the 0.4% rise evident in GB. As explained above this is due to part 1 of the revision to the DoE series. Employment in the primary sector is down by 4,665 or 5.9% which is less sharp than the 8.3% fall nationally. This contraction is largely due to Energy & Water supply where GB experienced a 12.9% fall compared with 8V4% evident in Scotland. In Britain, the sharper fall reflects the massacre of the deep mined coal sector. In Scotland, the fall is more due to losses in energy utilities and demanning in the oil sector.
Scottish manufacturing employment is down by a further 8,403 or by 2.3%. In Britain, manufacturing employment was down by 21,159 or by V4%. The sharper Scottish fall was due to sharper declines in Engineering and in Other Manufacturing but a better Scottish performance in Chemicals, Metals & Minerals. This accords with the story emerging from the Scottish Index of Production which suggests that outside electronics and chemicals the Scottish economy is recovering slowly from recession, if any recovery is evident.
In services, Scottish employment is down by 1,849
or by 0.1%. This compares poorly with a Vi% rise in Britain. Scottish performance is inferior in all divisions except Transport & Communications. In Britain, employees in Other Services, Banking, Insurance and Finance and Distribution, Hotels and Catering increased whilst this was only the case in Scotland for Other Services. Both male and female service employment fell in Scotland whilst rising modestly in GB.
In Scotland, the fall in service FTEs is 0.9% which suggests that there is a shift in favour of part time working. Indeed, full time service employees fell by 13,140 or by 1.3% whilst part time workers rose by 11,291 or 1.7%. In GB, the fall in full time service jobs was 55,710 or 0.6%, which is less sharp than north of the border. The growth in part time work was 125,000 or 2.3% which is similar to the increase posted in Scotland. Thus Scotland's poorer performance in service job creation is due to a comparative inability to retain full time posts.
The shift to part time work is evident in the 4 major service divisions but most marked in Transport and Communications where full time employment fell by 3,177 (3.3%) and part time work increased by 1,110 (8'/2%). In Distribution, Hotels & Catering, the fall in full time employment of 4,837 is almost offset by a rise of 4,344 part timers. In the large Other (Mainly Public) Services division, FT jobs fell by 4,619 whilst part time jobs increased by 5,486.
A sharp growth of 2,824 male jobs is evident in Distribution, Hotels and Catering but this fails to offset a decline of 3,317 females. In Banking, Insurance and Finance, male jobs fell by 1,332 whilst female workers grew by 1,177. Within this there is evidence of a shift to FT employment. In Other Services, male jobs fell marginally whilst female employment grew by 1,027.
Thus, the pattern of employment change continues to be from production to services, from male to female and from full time to part time working. There is nothing wrong with part time work per se. In GB, 85% of part time workers do not wish full time employment. What is problematic is the distribution of work. Often part time workers are women who are supplementing a full time wage in their household. There is an increasing tendency for households to have either 2 or more or none in employment.
The weakness in male demand and in full time employment is at the root of concern. Many
households cannot secure one full time wage and the trends in this respect continue to be worrying. In addition, the ongoing shifts conceal a move from blue collar to white collar work. This implies that, unless there are adequate routes to re-skilling, people and communities can be left behind in the process of structural change resulting in long term unemployment and attendant social problems. The evidence is that we failed to get this right in the 1980's and that the new Scottish Enterprise goal of tackling social exclusion must be given due priority.
Unemployment in G6 Regions
Tables 8 and 9 set out the details of seasonally adjusted unemployment for Scotland, GB and the standard planning regions. Table 8 presents details of the trends in the past year whilst Table 9 covers the period from April 1990. Corresponding tables for males and females are available on request. Table 10 sets out details of regional vacancies and U/V ratios for the Feb 1990 to Feb 1995. The U/V ratio measures the number of unemployed chasing each vacancy and is a standard indicator of the tightness of labour markets.
Table 8 indicates that Scottish unemployment stood at 8.3% in February 1995. This corresponds to the rate posted in GB but lies below the UK average. Table 9 indicates that, in February 1995, Scotland was one of 5 regions with unemployment below the UK average. The Scottish unemployment rate is 98.8% of the UK rate and the other regions exhibiting a lower relative rate are the South East (79.8%), East Anglia (76.2%), the South West (88.1%) and East Midlands (94%).
The British and Scottish unemployment rate for the 1975-95 period is set out in Figure 1 and the relative rates in Figure 2. Figure 3 presents unemployment change in Scotland, and the 3 large regions since January 1990, whilst Figure 4 presents relative unemployment rates for these areas. These suggest that the process of regional convergence in unemployment rates evident across the recession is unwinding and that recovery is stronger in the South.
In the case of Scotland, the Scottish rate has been falling in line with the British rate since June 1994. The SAR unemployment rates are based on denominators which are estimates of the workforce in 1993. Our labour market accounts provide alternative unemployment rates based on quarterly updates of workforce. These suggest that, because the Scottish workforce in employment is growing
Quarterly Economic Commentary
more slowly than in the UK, the denominator is relatively lower than in 1993 and that the SAR series understates the Scottish jobless rate. Analysis of the quarterly trend suggests that the Scottish unemployment rate has actually been above the GB rate since the middle of last year.
Table 8 highlights that Scottish unemployment decreased by 28,900 or by 12.2% in the year to Feb 95. This is slower than the 14.2% fall evident in GB and the 14.1% posted in the UK. Only London (-11M>%), Yorkshire & Humberside (-9.9%) and the Northern region (-8.9%) experienced a weaker decline in jobless claimants. The sharpest falls were experienced in the Rest of the South East (-20.2%), West Midlands 17.4%) and the South West (-15.9%).
In the most recent quarter, Scottish unemployment fell by 8,700 or by 4% which compares unfavourably with falls of 4.2% recorded in both Britain and the UK. This is a sharper fall than in London 3.5%), East Anglia 3.6%), Wales
(-3Vi%) and in all of the 3 regions comprising the
North of England (-3.2%). The sharpest quarterly falls are in Rest of South East (ROSE) (-6%), West Midlands (-53/4%) and the South West (-5%). However, in the most recent month, Scottish unemployment fell by 2,200 or by 1%. This was weaker than in either Britain 1.2%), the UK 1.1%) or in all regions except the South West (-0.9%), North West (-0.9%) and Wales (-0.6%).
The trends in UK regional unemployment in recession and recovery are set out in Table 9 and Figures 3 & 4. The recession began in the 1st quarter of 1990 and unemployment started to increase in the UK in April 1990. The recession ended in the 2nd quarter of 1992 and unemployment peaked in December of that year. Table 9 sets out the changes in jobless and trends in relative unemployment for these periods.
In the recession, unemployment increased faster the further south on looks. Between April 1990 and December 1994, Scottish unemployment increased by 45,700 or by 22.4%. This is significantly slower than in the UK (86.6%), GB (9\Vi%) or in any of the GB regions. The Scottish relative unemployment rate fell from 1.5 times the GB rate to 94.3% in Dec 92. UK relative rates converged as the South experienced sharper rises in unemployment compared to the Midlands and the North.
In the period since Dec 92, Scotland has experienced a much weaker decline in
unemployment than nationally. In recovery, Scottish unemployment fell by 41,700 or by 16.7%. This is slower than in Britain (-20.6%), the UK (-20.4%) and in all of the regions except London (-14.8%), the Northern region (-11.1%) and Yorkshire and Humberside (-161/2%).
The Scottish relative unemployment rate increased from 94.3% to 98.8% and the process of regional convergence in jobless rates starts to unwind. Relative rates is the South have started to decrease except in London where the overall picture is concerning. Relatives in the North have started to increase except in the North West. The recession altered the geography of British regional unemployment and the recovery is slowly unwinding the process of convergence.
Table 10 sets out the trend in vacancies and the U/V ratio in the UK regions for the Feb 90 to Feb 95 period. The recession can be proxied by Feb 90 to Feb 93 and the recovery the period thereafter. The present level of vacancies in Scotland is similar to the pre recession level whilst the U/V ratio is broadly similar. The present U/V ratio of 9.7 jobless per vacancy is lower than any region except Wales (8.4). In April 1990, the number of Scots chasing each vacancy was 1.14 times the number in the UK. In Feb 1995 this relative stood at 70.6%. Thus, Scots jobless continue to face a relatively buoyant labour market.
Unemployment in the Scottish Regions
In the previous section, we analysed Scottish, UK and British regional jobless with respect to the DoE seasonally adjusted series. This series also adjusts for the numerous revisions to the counts which took place in the 1980s. No such adjustments are undertaken for areas below the UK standard regions. However, there have been no changes in counting procedures since 1989 and, abstracting from the effects of the Restart programme, the series are consistent from that point.
Table 11 presents details of the unemployment trend in the Scottish regions in the last year. Tables
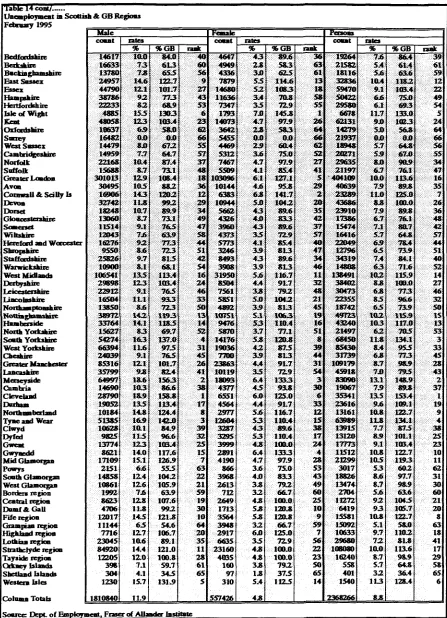
12 and 13 set out the same analysis for males and females respectively. Table 14 contains details of unemployment in the British counties for the Feb 90 to Feb 95 period. Table 15 sets out the trend in unfilled vacancies in the last year whilst Table 16 presents the U/V ratio for the Feb 90 to Feb 95 period.
Table 11 indicates that unadjusted Scottish
unemployment fell from 246,507 in Feb 94 to 218,200 in Feb 95. This implies a fall of 28,307 and constitutes an HVi% decline. Only Shetlands 18.8%), Highland 15.1%) and Strathclyde (-14.2%) experienced sharper fall than nationally. The decrease in Lothian was equivalent to the decrease in Scotland. Unemployment increased in Orkney (9.4%) and in Dumfries and Galloway (2.2%).
In February 1995, the Scottish unemployment rate stood at 8.7% of the workforce and at 9.8% on the basis of the narrow workforce count. The workforce rate is the same as the UK average. The highest unemployment rates are evident in the Western Isles (11.3%), Fife (10.8%), Strathclyde (10%) and Highlands (9.7%). In addition, Central (9.2%) and Dumfries and Galloway (9.3%) above the national average. The lowest unemployment rates are to be found in Shetlands (3.2%), Grampian (5.1%), Borders (5.6%) and Orkney (5.7%).
Table 14 sets out the unemployment position in the GB counties and presents the relative rates and ranks for these areas. There are 66 British counties although an unemployment rate is not defined for Surrey. In Feb 1995, Scotland accounted for 2 of the 10 top county jobless black spots. These were Western Isles (6th) and Fife (8th). In addition, only 4 Scottish regions ranked outside the worst third of British counties, These were Shetlands (65th), Grampian (63rd), Borders (60th) and Orkney (58th) and Lothian (41st). Thus Scotland continues to present some of the best and worst LA counties/regions.
In Feb 90, Scotland had 3 regions in the worst 10 British counties. These were, Western Isles (2nd rank), Strathclyde (4th rank) and Fife (7th rank). In addition, only Shetlands, Orkney, Grampian and Borders ranked outside the worst third of the 66 counties. February 93 is close to the peak in British unemployment. By this time, Scottish regions accounted for only 1 of thetop 10 county blackspots with the Western Isles ranking 9th. Scotland provided 5 of the worst third areas. In Feb 1995, the trends which emerged across the recession have gone into reverse.
Table 12 sets out details of the trend in male unemployment in the year to Feb 95. This indicates that Scottish male unemployment fell from 190,499 in Feb 94 to 160,300 in Feb 95. This represents a fall of 22,199 or 11.7%. This was less sharp than in GB (-14%), the UK (-13.8%) or in any of the 3 constructed GB regions. The Scottish male unemployment rate was 12.2% on the workforce
basis. This is higher than in the UK (11.8%), GB (11.7%) and in the 3 large regions, excepting the North of England (13.2%).
In terms of male jobless change only 5 regions bettered the Scottish performance. These were Highland (-I6y2%), Strathclyde and Shetlands (-14.1%), Central (-12.4%) and Lothian (-11.9%). Male unemployment increased by 11.2% in Orkney and by 3.4% in Dumfries and Galloway. In Feb 95, only Central (12.8%), Fife (14.5%), Highland (12.7%), Strathclyde (14.4%) and the Western Isles (15.7%) had male jobless rates above the Scottish average. In addition, Tayside (12%) and Dumfries and Galloway (11.8%) lay above the British average of 11.7%.
Table 14 presents details of male jobless in the GB counties at February 1995. Half of the Scottish regions have rates above the British average unemployment rate and only Western Isles (5th) and Fife (10th) lie within the top 10. However, Strathclyde occupies 11th rank and half of the Scottish regions lie within the top third. Scotland presents 4 of the best 10 British counties. These are Shetlands (65th), Grampian (64th), Orkney (61st) and Borders (59th).
Table 13 presents the trends in female unemployment in the Scottish regions in the year to February. Female claimants fell from 56,008 in Feb 94 to 49,900 one year later. This constitutes a fall of 6,108 or 10.9%. This is weaker than in Britain and the UK 12.3%) or the South of England (-13.4%) or Midlands and Wales (-12.7%). The Scottish Female unemployment rate stood at 4V£% of the workforce which is lower than in all other areas.
Only 4 regions experienced a sharper fall in female unemployment than in Scotland. These are Shetlands (-24.2%), Strathclyde (-14.6%)), Western Isles (-13.9%) and Highland (-11.1%). Female claimants increased in Orkney by 5.3%. The female rate is higher in 7 of the 12 Scottish regions with Highlands (6%), Fife and Dumfries and Galloway (5.8%) and Western Isles experiencing the highest incidence of female joblessness. In contrast, the female rate in Shetlands is 1.8% and under 4% in Orkney (3.8%), Lothian (3l/2%), Grampian and Borders (3.2%).
Table 14 sets out the female unemployment position in the British counties. Scotland has 3 of the 10 worst areas for female joblessness. These are Highlands (7th), Fife (9th) and Dumfries &
Galloway (10th). Scotland also provides 4 of the best areas. These are Shetlands (65th), Borders (60th), Grampian (59th) and Lothian (56th). These areas along with Orkney are the only areas with female unemployment rates above the Scottish average.
Vacancies and U/V Ratios in the Scottish Regions
Table 15 sets out the trends in unfilled vacancies in the year to Feb 1995. The volume of vacancies rose from 16,271 in Feb 94 to 19,373 in Feb 95. This represents a rise of 3,102 or 19.1% which is weaker than in GB (24.9%) or in the South of England (30.1%) and Midlands and Wales (29.9%). In the quarter to February, Scottish vacancies fell by
10.8% and by less than in Britain (-16.4%) or in the 3 large regions.
Only 4 regions experienced a faster growth than that experienced nationally. These were Borders (40.6%)), Lothians (58.6%), Tayside (52.8%), Strathclyde (20.6%) and the Western Isles (20.6%). Vacancy levels fell in Central (-4.4%), Dumfries & Galloway (-11.3%), Fife (-2.2%), Orkney (-76.1%) and Shetland (-97%). In Orkney, the level of unfilled vacancies presently stands at 11 and at 3 in Shetland. Unemployment is rising in the former but falling sharply in the latter.
Table 16 sets out details of the U/V ratio for the Feb 90 to Feb 95 period. At present the 3 Scottish Islands constitute the GB regions with the highest number of jobless per vacancy. The Western Isles typically rank highly but Orkney and Shetland tend to be areas with the lowest U/V ratios. In both Orkney and Shetland vacancy levels have slumped in the past year. In Orkney, unemployment has been rising indicating a weak market whilst in Shedand unemployment has been falling sharply. The U/V ratio in Shetland is not a sign of a distressed labour market.
Outside the Islands, only Fife figures in the third of GB counties with the highest U/V ratio and has a ratio worse than the GB average. Dumfries & Galloway constitutes the only mainland region whose U/V ratio has declined in the year to Feb
1995. In all mainland regions, the U/V ratios are down with particularly sharp falls in evident in Lothians and Tayside.
This situation in 1995 contrasts markedly with the position at the top of the 1980s cycle. In Feb 1990, the U/V ratio stood at 11.2 which was 1.2 times the
British level. Scotland contributed 4 of the 10 areas with the most adverse U/V ratios whilst only 3 Scottish regions had ratios outside the worst third of the 66 British LA regions and counties.
Unemployment in the Scottish Travel To Work Areas
Table 17 sets out unemployment change in the Scottish TTWAs between Feb 90 to Feb 95 whilst Table 18 presents the rates, relative rates and ranks for this period. A travel to work area corresponds to a local labour market allowing jobless rates to be calculated. There are 322 TTWAs in Britain and 60 in Scotland. As is traditional, Cumnock and Sanquhar with an unemployment rate of 20.2% constitutes the worst GB TTWA whilst Shetlands (3.8%) is the best places area. Aberdeen (4%) ranks 3rd best in Britain.
In Feb 95, Scotland provided 4 of the 10 worst British TTWAs in terms of the unemployment rate. These were Cumnock & Sanquhar (1st), Forres (3rd), Girvan (7th) and Newton Stewart (9th). Scotland contributes a further 5 to the worst 10% of the 322 GB TTWAs. These are Sutherland (18th), Alloa (20th), Dunoon and Bute (25th), Arbroath (27th) and Skye and Wester Ross. It is interesting to note that these are mainly rural areas. Scotland contribute 3 of the best 20 British TTWAs. These are Shetland (321st), Aberdeen (311th), and Galashiels (396th). In addition, 33 of the 60 Scottish TTWAs are amongst the best third of GB labour markets.
Table 18 sets out the story of the relative improvement in Scottish TTWAs across the recession and the in the recovery. The reader is left to examine the changing fortunes of these areas in this period. As with the counties, the general picture is one of Scottish areas slipping down the rankings between 1990 and 1993 and shifting back up thereafter.
Concluding Remarks
This review has focused heavily on the vexed question of the trends in Scottish and British employment and the differences between the DoE employer survey and the LFS. We presented labour market accounts based upon the employment trend in the 2 series in 1993 and 1994. Whilst both show some similarity at the British level, the weaker jobs growth in the DoE series means that a greater share of the fall in British jobless can be attributed to a drop in participation. However, both series point to
some reduction in Economic Activity in Britain and in our 3 large regions.
In Scodand, it is a veritable tale of 2 surveys. The DoE series suggests that, for men and women both employment and unemployment fell between 1993 and 1994. The LFS has stronger male employment growth but male unemployment is still falling due to falling participation. In the case of women, the LFS suggests that the fall in unemployment has been moderated by a strong rise in economic activity. The rise in the overall Scottish EA rate is entirely due to developments in the female labour market.
The DoE series has been criticised for understating employment growth in the period since 1991. It ha been revised to increase male employment, particularly in the Construction sector. Even after this revision, the labour market accounts based on the LFS appear more plausible than those derived using the DoE data. For this reason, we expect further significant change to the DoE data to bring in more into line with the LFS.
This is not an endorsement of the conclusions derived from the LFS. The LFS data is noisy and does not invite comparisons across time. Even at the regional level certain of the estimates look problematic. In the case of Scotland, we view that the LFS is overstating (female) employment expansion. Between 1993 and 1994, the LFS suggests total Scottish employment rose by 31,250. Our current medium term forecast suggests that Scottish employment increased by 5,300 in 1993/94.
At the end of 1994 and at present we suspect that Scottish and GB employment is rising fast and that the falls in unemployment are more directly due to this rather than falling participation. We expect jobs growth to be strong in 1995 with a net creation of 21,900. Employment will continue to rise modestly until 2001. However, despite fast export and investment led growth, Scottish employment is expected to be only marginally above the pre recession figure of 2,301,900. Unemployment will fall due to falling population and the falls will be moderated by increasing participation.
Our assessment of the 2 employment series and the construction of labour market accounts is a better way to assess changes in regional labour markets than simply examining employment and unemployment is isolation. In principle, we can carry out this exercise at the level of the Scottish LA region and LEC. Indeed, accounts have been
prepared for the 1993/94 period. Due to the limitations of the LFS these are not robust enough to publish.
However, we believe that extending and expanding the LFS to obtain better quarterly estimates at the national, regional and sub regional level. Analysis of unemployment trends in small areas can be a poor guide to the underlying strength of labour demand. If the LFS were more consistent across time then local labour market performance could be properly assessed on a regular basis. Indeed, such developments would take the emphasis of policymakers away from the monthly count and its questionable trends and towards a more appropriate perspective. For this reason, we believe that the LFS should be expanded in size.
Policy makers require reliable estimates of key variables at both the Scottish and sub Scottish level. This is more important given the advent of LECs. Despite the arrival of the LFS, the information set on the Scottish economy, remains deficient and confounds analysis and prediction at the Scottish or local level. Until this is remedied, assessing the state of the Scottish economy will be like peering through a glass darkly. It doesn't have to be this way!
Table I.
Scottish & British Unemployment; Feb 1990-95 Unadjusted Time series
Scotland
Feb 1990 Feb 1991 Feb 1992 Feb 1993
Feb 1994 Mar 1994 Apr 1994 May 1994 Jim 1994 Jul 1994 Aug 1994 Sep 1994 Oct 1994 N o v 1994 Dec 1994 Jaa 1995 Feb 1995
Change acr
MoBth Quarter Year
persons Rate
8.7 8 3
93
1 0 3
9 . 9 9 . 6 9-5 9 3 9.1 9.7 9.6 9 8 . 6 8 3 8 3
9
8.7
ass previoo: Total
215701 213729 2 3 9 8 2 2 2 5 7 0 9 2
2 4 6 5 0 7 240106 237575 231141 2 2 6 3 4 6 2 4 1 1 9 4 238816 223741 215265 2 1 3 2 8 8 2 1 2 6 0 3 2 2 3 7 3 2 218200
> - 5 5 3 2
4912 - 2 8 3 0 7
Monthly % c h
- 1 3 9 0 3 0 - 0 . 6 3 - 1 . 4 1
- 1 . 7 9 - 2 . 6 0 - 1 . 0 5 - 2 . 7 1 - 2 . 0 7 6 3 6 - 0 . 9 9 - 6 3 1 - 3 . 7 9 - 0 . 9 2 - 0 . 3 2 5.23 - 2 . 4 7
- 2 . 4 7 2 3 0 ^ 1 . 4 8
male Rate
1 1 . 3 1 1 3
123
1 4 . 3
13.8 13.5 1 3 3 13 12.8 1 3 . 2 13 12.5 12.1 12 12 12.6
YLZ
Total
157314 159691 182280 197517
190499 185904 184199 180045 176437 181923 179778 172590 167162 165367 165253 173340 168300
- 5 0 4 0 2933 - 2 2 1 9 9
Monthly % c h
- 1 . 6 0 0 3 4 - 0 . 9 9 - 1 . 8 6
- 2 . 1 1 - 2 . 4 1 - « . 9 2 - 2 . 2 6 - 2 . 0 0 3.11 - 1 . 1 8 - 4 . 0 0 - 3 . 1 5 - 1 . 0 7 - 0 . 0 7 4 . 8 9 - 2 . 9 1
- 2 . 9 1 1.77 - 1 1 . 6 5
female Rate
5.4 5 5.2 5.3
5 4.9 4.8 4.6 4.5 5.3 5 3 4.6 4 3 4 3 4.2 4.5 4.5
Total
5 8 3 8 7 54038 5 7 5 4 2 59575
56008 54202 53376 51096 4 9 9 0 9 59271 59038 5 H 5 1 4 8 1 0 3 47921 4 7 3 5 0 5 0 3 9 2 4 9 9 0 0
- 4 9 2 1979 - 6 1 0 8
Monthly % c h
- 1 3 3 0.40 0 3 2 0.13
- 0 . 7 0 - 3 . 2 2 - 1 3 2 - 4 . 2 7 - 2 3 2 18.76 - 0 3 9 - 1 3 3 6 - 5 . 9 6 - 0 3 8 - 1 . 1 9 6.42 -©.98
- 0 . 9 8 4.13 - 1 0 . 9 1
Great Britain
Feb 1990 Feb 1991 Feb 1992 Feb 1993
Feb 1994 Mar 1994 Apr 1994 May 1994 Jan 1994 Jal 1994 Aug 1994 Sep 1994 Oct 1994 Nov 1994 Dec 1994 Jan 1995 Feb 1995
Change acr
Month Quarter Year
persons Rate
5.6 7 9.4 10.7
10 9 . 8 9.6 9 3 9.1
93
9 . 2 9 8.6 8 3 8 3 8.8 8.6
o s s p r e v i o u Total
1576782 1947558 2606602 2935427
2741848 2678924 2636051 2S56853 2489410 2 5 4 1 7 8 6 2537178 2481442 2 3 6 1 5 7 3 2331552 2326972 2 4 1 1 4 7 0 2368266
s
- 4 3 2 0 4 36714 - 3 7 3 5 8 2
Monthly % c h
- 0 . 6 2 4 . 6 2 1.46 - 0 . 6 3
- 1 . 6 2 - 2 . 2 9 - 1 - 6 0 - 3 . 0 0 - 2 . 6 4 2.10 - 0 . 1 8 - 2 . 2 0 - 4 . 8 3 - 1 . 2 7 - 0 . 2 0 3.63 - 1 . 7 9
- 1 . 7 9 1.57 - 1 3 . 6 3
male Rate
7 . 2 9 3 12.7 14.5
13.6 1 3 . 3 1 3 12.7 1 2 , 3 12.4 1 2 3 12.1 11.6 1 1 3 11.5 11-9 11.7
Total
1157507 1472605 1994171 2253252
2106144 2059117 2024328 1967D46 1914140 1921795 1903281 1872042 1795814 1777524 1783441 1845897 1810840
- 3 5 0 5 7 33316 - 2 9 5 3 0 4
Monthly % c h
- 0 3 4 4.78 1 3 0 - 0 . 7 6
- 1 . 7 8 - 2 . 2 3 - 1 . 6 9 - 2 . 8 3 - 2 . 6 9 0.40 - 0 . 9 6 - 1 . 6 4 - • . 0 7 - 1 . 0 2 0.33 3 3 0 - 1 . 9 0
- 1 . 9 0 1.87 - 1 4 . 0 2
female Rate
3.5 4 5.1 5.7
5.3 5-2 5.1 4.9 4-8 5.2 5 3 5.1 4.7 4.6 4.6 4.7 4.7
Total
4 1 9 2 7 5 4 7 4 9 5 3 612431 6 8 2 1 7 5
6 3 5 7 0 4 6 1 9 8 0 7 6 1 1 7 2 3 5 8 9 8 0 7 5 7 5 2 7 0 619991 6 3 3 8 9 7 6 0 9 4 0 0 5 6 5 7 5 9 5 5 4 0 2 8 543531 5 6 5 5 7 3 5 5 7 4 2 6
- 8 1 4 7 3398 - 7 8 2 7 8
Monthly % c h
- 0 . 8 6 4.16 1.32 - 0 . 2 0
- 1 . 0 5 - 2 3 0 - 1 3 0 - 3 . 5 8 - 2 . 4 6 7.77 2.24 - 3 . 8 6 - 7 . 1 6 - 2 . 0 7 - 1 . 8 9 4.06 - 1 . 4 4
- 4 . 4 4 0.61 - 1 2 . 3 1
Table 2.
Scottish & British Unemployment: Feb 1990-95 Seasonally Adjusted Time series
Scotland
Scotland
Feb 1990 Feb 1991 Feb 1992 Feb 1993
Feb 1994 Mar 1994 Apr 1994 May 1994 Jan 1994 Jul 1994 Aug 1994 Sep 1994 Oct 1994 Nov 1994 Dec 1994 Jan 1995 Feb 1995
Change acr
Month Quarter Year
persons Rate
8 . 4 8 . 2 9 . 2 9 . 9
9 . 5 9 . 4 9 3
93 93
9 . 3
93, 9
8.8 8 . 7 8 . 5 8 . 4 8 3
ossprevioa: Total
208100 206300 231700 247500
236800 234700 233400 232300 230800 232200 229400 225200 220700 216600 212200 210100 207900
i
-2200 -8700 -28900
Monthly
% c h
-0.1O 2.18 0.74 -0.16
-0.67 -0.89 -0.55 -0.47 -0.65 0.61 - U S I -4.83 -2.00 -1.86 -2.03 -0.99 -1.05
-1.05 -•.02 - 1 2 2 0
male Rate
10.8 10.9 12.4 13.8
1 3 3
13.2 13.1 13.1
1 3 1 3
12.8 12.6 12.4 12.1 11.9 11.8 11.7
Total
tsisoo
154000 176200 190600
183300 182000 181300 180400 179400 179400 177200 174400 170800 167300 164000 162400 160800
-1600 -6500 -22500
Monthly
% c h
0.26
2 4 0
0.74 -0.21
-©.70 -0.71 - 0 3 8 -0.50 -0.55 0.00 -4.23 -1-58 -2.06 -2.05 -1.97 -0.98 -0.99
-0.99 -3.89 ^ 2 . 2 7
female Rate
5 3 4 . 8 5 5.1
4 . 8 4 . 7 4 . 7 4 . 6 4 . 6 4 . 7 4 . 7 4 . 5 4 . 5 4 . 4 4 . 3 4 3 4 . 2
Total
56600 52300 55500 56900
53500 52700 52100 51900 51400 52800 52200 50800 49900 49300 48200 47700 47100
-600 -2200 -6400
Monthly
% c h
-1.05 0.97 0.73 0.00
-0.56 - 1 3 0 -1.14 - 0 3 8 -0.96 2.72 -1.14 - 2 ^ 8 -1.77 -4 30
-233
-1.04 - 1 3 6
-1.26 -4.46 -11.96
Great Britain
Feb 1990 Feb 1991 Feb 1992 Feb 1993
Feb 1994 Mar 1994 Apr 1994 May 1994 Jan 1994 Jnl 1994 Aug 1994 Sep 1994 Oct 1994 Nov 1994 Dec 1994 Jan 1995 Feb 1995
Change acr
Moath Quarter Year
persons Rate
5 . 4 6 . 8 9 . 2
10.4
9 . 7 9 . 6 9 . 4 9 . 3 9 3
93
9.1 9 8.8 8.7
S3
8.4 8 3
oss prcviou. Total
1513100 1880800 2532900 2853300
2653500 2620300 2582500 2563100 2545100 2532100 2497100 2466800 2419600 2374400 2325000 2300900 2274100
>
-26800 -100300 ^79400
Monthly
% c h
-0.11 5.29 1.95 -0.13
- 1 3 9 -1.25 -1.44 -0.75 -0.70 - 0 3 1 ^ . 3 8 -1.21 -1.91 -4-87 -2.08 -1.04 -1.16
-1.16 - • . 2 2 - 1 4 3 0
male Rate
6 . 9 8 . 9 1 2 3
14.1
13.1
1 3 1 2 *
12.7 12.6 12.4
1 2 3
12.1 11.9 11.7 11.4
1 1 3
11.2 Total
1106000 1418800 1936000 2190000
2037400 2011700 1981100 1963800 1947600 1930300 1903700 1882800 1847100 1810600 1775100 1756600 1736600
-20000 -74000 -300800
Monthly
% c h
0.15 5.62 2.12 -0.18
- 4 3 2 -1.26 - 4 3 2
-axi
-0.82 -0.89 - 1 3 8 -4.10 -1.90 -1.98 -1.96 -1.04 -1.14
-1.14 -4.09 -14.76
female Rate
3 . 4 3 . 9 5 5.6
5 . 2 5.1 5 5 5 5.1 5 4 . 9 4 . 8 4.7 4.6 4 . 6 4 . 5
Total
407100 462000 596900 663300
616100 608600 601400 599300 597500 601800 593400 584000 572500 563800 549900 544300 S37500
-6800 -26300 -78600
Monthly
% c h
-0.83
4 3 9
1.39 0.03
-0.98 - 1 3 2 -1.18 -0.35 - 0 3 0 0.72 -1.40 - 1 3 8 -1.97 -1.52 -2.47 -1.02 - 1 3 5
-1.25 -•.66 -12.76
Table 3
Difference between Original and Revised Estimates of Employment September 1994
Scotland
0 Agriculture, Forestry and Fishii 1 Energy & Water
2 Chemicals, Metals & Minerals 3 Engineering
4 Other Manufacturing 5 Construction
6 Distribution, Hotels & Catering 7 Transport & Communication 8 Banking, Insurance & Finance 9 Other services
Total
GB
0 Agriculture, Forestry and Fishit 1 Energy & Water
2 Chemicals, Metals & Minerals 3 Engineering
4 Other Manufacturing 5 Construction
6 Distribution, Hotels & Catering 7 Transport & Communication 8 Banking, Insurance & Finance 9 Other services
Total
Source: Department of Employmen
male | 0 0 0 0 0 28811 0 589 0 429
29829
male j 0 0 0 0 0 124790 0 -2244 0 -8129
114417
malept | 0 0 0 0 0 0 0 21 0 -205
-184
malept | 0 0 0 0 0 1 0 -183 0 3849
3667
female | 0 0 0 0 0 1 0 -216 0 157
-58
female | 0 0 0 0 0 1 0 -448 0 -1731
-2178
t, Fraser of Allander Institute
femalept | 0 0 0 0 0 1 0 - 6 6 0 45
- 2 0
femalept j 0 0 0 0 0 2 0 -446 0 20979
20535
persons | 0 0 0 0 0 28812 0 373 0 586
29771
persons 0 0 0 0 0 124791 0 -2692 0 -9860
112239
maleft | 0 0 0 0 0 28811 0 568 0 634
30013
maleft 0 0 0 0 0 124789 0 -2061 0 -11978
T a b l e 4
E a p l o y a e a t im B r i t b k R e g i o a s Dec 1990 QB Dec Dec Dec Mar Jun Sep Dec Mar Jun Sep Dec Changes quarter year 2 years S«nHaai Dec Dec Dec Mar Jun Sep Dec Mar Jun Sep Dec Changes quarter year Zyears Source: D
- D e c 1994
1990 1991 1992 1993 1993 1993 1993 1994 1994 1994 1994 nprevi aba * ate * mos * 1 1990 1991 1992 1993 1993 1993 1993 1994 1994 1994 1994 npre*i< aba * aba * aba * •eparba^
Civilian workforce ao Bmployme Mala 14416000 1372*004 1328000ft 1317*000 1319100* 13248940 13241000 1313709* 13202000: 13311000 1336109ft oua ""Male 50000 0.4 120000 0.9 81000 0 . *
Feasale II695090 1135900ft 11243990 I1142000 11290000 11272009 11J5700O U2C3900 1129900ft 1129000ft 1142S90O Female 135000 1.2 *8000 0.4 222000 2A m 26922000 2598449* 24483000 24319000 24480000 24520000 24599000 24400000 24501000 24602000 24786000 All 184400 0.7 187000 • i i 30340ft 1-2
Civilian Worfctorce in tUDployme Male 1245000 1239000 1198000 117900ft 1179000 1189000 1193000 1176000 1179000 1189000 1181000 oua -8000 -ft-7 -12000 - 4 . 0 -47000 -tA Female 1031000 1044000 1047000 1042000 1061000 1065000 1069000 1051000 1061000 1050000 1044000 Female -MOO - 0 . 6 -25000 - A 3 -3000 -4>-3 All 2274000 2283000 2245000 2220*00 2240000 22S4000 2262000 2227900 2241000 2239000 2225*00 All -44000 -0.6 -37000 -i* -20000
- 0 . 9
sot of Employment. Labour Force Su employees Mala 11599000 11085000 10740000 10667000 10704000 10747000 106910M 105980*0 10634000 10732000 10716000 locmployni cat Feaaalel AU 10627090 10440000 103150*0 10270000 10378000 10377000 10440000 10340000 10377000 10385400 105010*0
Male 1 female -MOO*
- * . »
25000 0.2 -24000 - 0 i
Employees U a l e 1044040 1039000 10*9000 98800ft 10*0099 1009000 1001000 98S00O 9960*0 100*090 98800O "Male -38000
- i t -43000 -4.3 -21000 -2.1 rvey 1»««0» 1-1 61040 0.6 1860*0 1.8 22226000 21524004 219550*0 20937000 21082040 21124000 21130400 20938000 2101100ft 21117000 21217090 All 10000O 0 3 87000 ft.4 16204O 0J8 O tUDplOYIDC Female 961400 979004 9840** 97*040 992004 994440 99640ft 981000 996900 989400 98040ft Female -9000 - 0 . 9 -16000 -4 A -4000 -4M AU 2004004 2018000 1992000 1967044 1991904 2003000 1996000 1966044 19(7*00 1994000 1969000 All -25*00 - 4 3 -27044 -1.4 -23*00 - 1 2
seit employed UM 2569440 2432040 2321440 2295000 2342040 2319000 2352000 23470*0 2389*00 2448904 2463000 Male 1 55400 2 J 111400 4.7 142400 6,1 Feaaale 82500O 792440 770090 751440 801040 790040 8450** 80900ft S1940O 808940 82000ft Female I 12000 1.5 15040 IS 50000 6.5 Mil bmployed Ualel 166400 1710ft* 164000 1*6000 158040 159004 17200ft 169400 163000 1*4000 17300ft Male] 9000 5.5 1400 ».* 9000 5.5 Feaaalej 5000* 48000 50090 49000 5700* 60000 62000 59000 59000 52000 55900 Female 1 30*0 5.8 -7490 - K . J 5904 14.0 All 3394940 3224909 3091000 304*449 3193040 3109494 3157944 3155099 32*8409 321604* 3284000 All 48440 2.1 127000 4J> 193440 «-2 All 216000 2190*9 214009 215000 216490 219440 234000 228940 222000 216099 228000 All 12900 5* -69*4 - A * 14000 6.S uovcrnmeot iraineea MaW 248000 299004 219400 215000 184094 182004 198400 193400 179099 172404 182000
Male ~ ( 14000
5.8 -16400 - 8 J -37094 -16.9 Beanie | 154000 127409 118009 121440 111000 195000 113009 1140*0 103099 97099 194000 Female I 7440 7 i - 9 0 0 0 -8.0 -4440* -11.9
Oovcrnmeot trainees U a l d 35040 29940 25009 25040 21900 21000 20000 22000 20000 20000 19000 -4090 -5J> -1400 - 4 . 0 -6099 - 2 4 . 0