By
S. SEFANAIA
A dissertation submitted in partial fulfilment of the requirements for the degree of Master of
Agricultural Development Economics in The Australian National University
ACKNOWLEDGEMENTS
I wish to acknowledge the valuable contribution made by my supervisor, Dr Satish Chandra, to the formulation and refinement of this work.
I am grateful to Dr D.M. Etherington for technical guidance with the model. This is greatly appreciated. I am also grateful to the staff of the Ministry of Agriculture Forests and Fisheries who helped with the data collection.
The study was made possible through the provision of a scholarship by the Australian Development Assistance Bureau and a study leave allowance from the Ministry of Agriculture Forests and Fisheries and the Government of Tonga.
ABSTRACT
In the national economy of Tonga the contribution of smallholder farmers is extremely important. The smallholders control most of the land and labour resources and generate most of the export earnings. Recent trends show a fluctuation in the export earnings of individual crops but for agriculture as a whole, export earnings remain at around 90 per cent of total exports. There is also a migration of potential agricultural workers to the main island, Tongatapu, and overseas. In this study, different intercropping models are investigated as to their potential for increasing income, employment opportunities and fulfilling subsistence requirements of farm families.
The potentials for intercropping in Tonga are considered by reviewing studies on the advantages of intercropping thereby establishing the technical basis for this type of cropping system. Alternative
techniques that can be adopted for the analysis of the intercropping system are also reviewed. Then the MULBUD technique is outlined and adopted for subsequent analysis. MULBUD was found suitable for the analysis as the results were of a comparative nature rather than of optimising nature. In summary the MULBUD technique reports the return in terms of the Sum of Net Present Value (SNPV), amortized value and SNPV per labour day at a specified discount rate. The labour requirements for individual crops, as well as alternative models, are also reported.
in terras of their economic returns and labour requirements. The financing of cash requirements during the establishment periods, especially of
perennial crops, is through loans.
Attention is also directed at the intermediate period in the life of the coconut stand under which there is no or limited potential for
intercropping. Therefore the importance of adopting alternative densities to allow for continuous intercropping is also considered. The alternative adopted was found to have higher economic returns.
For the perennial crops, the vanilla intercrop gives the best economic returns followed by the kava intercrop. Bananas are unprofitable intercrops under the present production system. There is little difference in economic returns in the production of the different annual crops.
However, the susceptibility of the different crops to changing prices, yields and costs are shown by the sensitivity analysis.
The intercropping system not only can make substantial contribution to the national economy but is also capable of fulfilling the multiple
CONTENTS
Page
ACKNOWLEDGEMENT ii
ABSTRACT iii
LIST OF TABLES x
LIST OF FIGURES xii
GLOSSARY xiii
MAP OF TONGA xiv
CHAPTER
1 INTRODUCTION 1
1.1 The Resource Base 2
1.2 Location 3
1.3 Climate 4
1.4 Land Tenure 4
1.5 Population 6
1.6 Manpower 9
1.7 Employment 10
1.8 Capital Resources 11
1.8.1 Infrastructure 11
1.8.2 Education 12
1.8.3 Tonga Development Bank 13
1.8.4 Research and Extension 14
1.9 Imports 14
1.10 Balance of Payment 14
1.11 The Agricultural Sector in Tonga 16 1.11.1 Size of the Agricultural Sector 17 1.11.2 Importance of the Agricultural Sector 18 1.11.3 The Performance of the Agricultural Sector 19 1.11.3.1 Household Consumption 19 1.11.3.2 Gross Domestic Product 19
1.12 The Kingdom’s Objectives 22
1.13 Plan of the Study 22
CHAPTER Page 2 AGRICULTURE AND POTENTIAL FOR INTERCROPPING 24
2.1 Intercropping 24
2.2 The Farming System 24
2.3 Reviews of Studies on Intercropping 27 2.3.1 Modern Intercropping Systems 29
3 ALTERNATIVE ANALYTICAL TECHNIQUES 40
3.1 Time 40
3.2 Alternative Techniques 44
3.2.1 Dynamic Programming 44
3.2.2 Recursive Programming 45
3.2.3 The Principles of Linear Programming 47
3.2.3.1 Linearity 48
3.2.3.2 Divisibility 48
3.2.3.3 Additivity 48
3.2.3.4 Certainty 48
3.2.4 Multi-stage Linear Programming 49 3.2.4.1 Time in Linear Programming 49
3.2.5 Partial Budgeting 50
. 3.2.6 MULBUD 52
3.2.6.1 The MULBUD Program 52
3.2.6.2 Analytical Requirements of
MULBUD 59
4 THE CROPS AND THEIR CASH FLOWS 61
4.1 Coconuts 62
4.1.1 The Coconut Yield Stream 62
4.1.2 Coconut Product Prices 72
4.1.3 Cost in Smallholder Production 74
4.1.4 Coconut Fixed Costs 76
4.1.5 Coconut Cash Flow 76
4.2 Cassava 79
4.2.1 Cassava Yields 80
4.2.2 Cassava Prices 80
4.2.3 Cost of Cassava Production 80
4.2.4 Cassava Fixed Costs 82
CHAPTER Page
Yams 83
4.3.1 Yam Yields 83
4.3.2 Yam Prices 83
4.3.3 Cost of Yam Production 84
4.3.4 Yam Fixed Costs 86
4.3.5 Yam Cash Flow 86
Swamp Taro 87
4.4.1 Swamp Taro Yields 87
4.4.2 Swamp Taro Prices 87
4.4.3 Cost of Swamp Taro Production 88
4.4.4 Swamp Taro Fixed Costs 90
4.4.5 Swamp Taro Cash Flow 90
Xanthosoma 90
4.5.1 Xanthosoma Yields 91
4.5.2 Xanthosoma Prices 91
4.5.3 Cost of Xanthosoma Production 91
4.5.4 Xanthosoma Fixed Costs 93
4.5.5 Xanthosoma Cash Flow 94
Capsicum 94
4.6.1 Capsicum Yield 94
4.6.2 Capsicum Prices 95
4.6.3 Cost of Capsicum Production 95
4.6.4 Capsicum Fixed Costs 97
4.6.5 Capsicum Cash Flow 98
Kava Tonga 98
4.7.1 Kava Yield 98
4.7.2 Kava Prices 98
4.7.3 Cost of Kava Production 99
4.7.4 Kava Fixed Costs 101
4.7.5 Kava Cash Flow 101
Banana 101
4.8.1 Banana Yields 101
4.8.2 Banana Prices 102
4.8.3 Cost of Banana Production 103
4.8.4 Banana Fixed Costs 106
CHAPTER Page
4.9 Vanilla 106
4.9.1 Vanilla Yields 107
4.9.2 Vanilla Prices 107
4.9.3 Cost of Vanilla Production 108 4.9.4 Fixed Costs in Vanilla Production 110
4.9.5 Vanilla Cash Flow 110
4.10 A Comparison of Cash Flows 110
5 MODEL SPECIFICATION 113
5.1 Alternative Objective Functions 113
5.2 The Farm Unit in Tonga 118
5.3 Model Building 123
5.4 Data and Assumptions for Modelling 128
6 RESULT AND DISCUSSION 133
6.1 Comparison Between Perennial Cash Intercropping 134 6.2 Comparison of Different Coconut and Intercrop
Density 142
6.3 Comparison Between Different Times of Planting
of Kava and Banana Intercrop 145
6.4 Comparison Between Different Annual Crop
Combinations 149
6.5 Tax Allotment Modelling 159
• 7 SUMMARY AND CONCLUSION 167
k k k
BIBLIOGRAPHY 174
APPENDICES
A 180
Al.l The Coconut Industry in Tonga 180
* A1.2 The Coconut Replanting Scheme 181
A2.1 The Banana Industry 183
A3.1 Vanilla Industry 187
A4.1 Kava 188
APPENDICES Page
A6.1 Root Crops 189
B Fixed Cost Per Unit Farm (3.34 hectares)
Tools and Equipment 191
C Value of Some of Tonga’s Agricultural Exports
(T$'000) - Crops Considered in the Cash Flow 192 D The Relationship Between Maximizing Sum of Net
Present Value and Maximizing Net Worth 193 E Explanatory Figure and Tables for the MULBUD
Programming Technique 195
LIST OF TABLES
Table Title Page
1.1 Dry Land Area and Population Distribution for the
Kingdom of Tonga (1976 Census) 3
1.2 Average Rainfall for 1945-1980 5
1.3 Land Tenure 1979 6
1.4 The Growth and Structure of the Population 7 1.5 Age Structure of the Population as at Census Date 8
1.6 Manpower and Labour Force 9
1.7 Labour Force in Relation to the Total Population 10 1.8 Agricultural Loan Approval by the Tonga Development
Bank (T$'000) 1977-1980 13
1.9 The Structure of Imports (CIF) by Commodity and Value 15 1.10 Balance of Payment Summary 1970/71 - 1979/80 16 1.11 Export by Major Commodities (f.o.b. value - T$’000) 17 1.12 Allocation of Government Controlled Resources 18 1.13 Annual Household Consumption of Locally Produced Food
and Animal Feeds in Metric Tons in 1979 20 1.14 Gross Domestic Product by Kind of Economic Activity
(Current Prices - 1981) 21
2.1 Total Annual Productivity of a Coconut Plantation at
Different Yield Levels 30
2.2 Yield of Coconuts Before and After Planting Cacao 36 4.1 Yield Comparison for 25-29 Year Old Coconuts 63 4.2 Coconut Age Coefficients for Yield Per Palm (Kg)
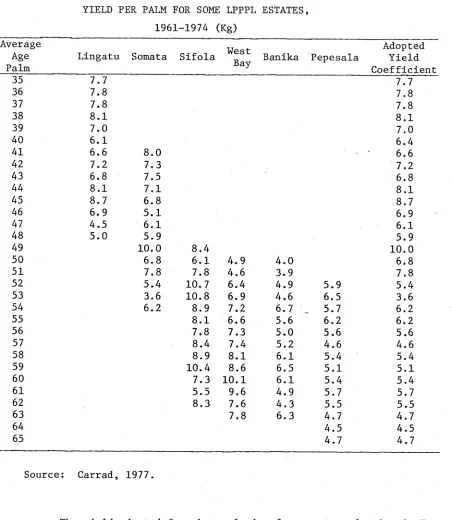
Adjusted for Average Estate Effect 68
4.3 Yield Per Palm for Some LPPPL Estates, 1961-74 (Kg) 70 4.4 Coconut Yield Streams (Density - 123 Palms Per Hectare) 71 4.5 Annual Coconut Cash Flow and Labour Inputs 77 4.6 Summary of Returns and Average Labour Use 79 4.7 Annual Cassava Cash Flow and Labour Inputs 81 4.8 Annual Yam Cash Flow and Labour Inputs 85 4.9 Annual Swamp Taro Cash Flow and Labour Inputs 89 4.10 Annual Xanthosoma Cash Flow and Labour Inputs 92 4.11 Annual Capsicum Cash Flow and Labour Inputs 96 4.12 Annual Kava Tonga Cash Flow and Labour Inputs 100
Table Title Page 4.14 Non-Subsidized Banana Cash Flow and Labour Inputs 104
4.15 Vanilla Yield Per Crop 107
4.16 Annual Vanilla Cash Flow and Labour Inputs 109 4.17 Comparative Data for Different Crops 111 6.1 Time of Planting and Area Occupied by Each Crop 135 6.2 Returns, Labour Requirement and Loans for Perennial
Cash Crop Intercropping 136
6.3 Tonga Bananas Sensitivity Analysis 138
6.4 Kava Tonga Sensitivity Analysis 140
6.5 Tonga Old Coconuts 1 Sensitivity Analysis 141
6.6 Tonga Vanilla Sensitivity Analysis 142
6.7 Time of Planting and Area Occupied by Each Crop 143 6.8 Return, Labour Requirement and Loans for Models
With Different Densities of Coconuts and Intercrop 144 6.9 Time of Planting and Gross Area Occupied by Each Crop 146 6.10 Returns, Labour Requirements and Loans for the
Different Intercropping Models 147
6.11 Time of Planting and Gross Area Occupied by Each Crop 150 6.12 Returns, Labour Requirements and Loans for Different
Annual Crop Mixes 152
6.13 Tonga Yams Sensitivity Analysis 153
6.14 Tonga Swamp Taro Sensitivity Analysis 154 6.15 Talo Futuna (Xanthosoma) Sensitivity Analysis 156
6.16 Tonga Capsicum Sensitivity Analysis 157
6.17 Tonga Cassava Sensitivity Analysis 158
6.18 Intercropping Models for Tax Allotment Analysis 161 6.19 Returns and Labour Requirement for the Different
Intercropping Models 163
6.20 Average Return and Labour Requirement Per Tax
Allotment 164
LIST OF FIGURES
Figure Title Page
2.1 Root Distribution of a Coconut Tree 32 2.2(a) Schematic Representation of the Vertical Distribution
of Roots in a Multistoreyed Crop Combination 33 2.2(b) Schematic Representation of the Horizontal Distribution
of Roots in a Multistoreyed Crop Combination 33 2.3 Light Interception and Penetration in a Coconut Stand
Over Time 35
2.4 Growing Conditions and Growth Habits of Coconuts 37
3.1 Consumer Time Preference 42
3.2 Schematic Flow Chart of 'MULBUD' 53
3.3 Net Benefits from Intercropping 58
4.1 Comparative Copra Yield Curves 65
4.2 Coconut Yield Curve Predicted for Average of Seven
Estates, LPPPL, Solomon Islands 69
Pa'anga
Seniti
Unit of Tongan currency, the symbol adopted in the study is 'T'. Exchange rate
MAP OF THE KINGDOM OF TONGA
© i7b- 3o
Niua Fo'ou
Tafahi q N m a
Toputapu
\ / b
o. A ta
175° Fonualei ° 174" 18“ '
a Toku
V A V A ' U G R O U P H u nga
Va va u Neiatu (Aj Late / - Ka.P a
T O N G A
Q Kao
Tofua (^>
Ha ano
M o u n g a o n e 0 *
• <b
. * • C^Foa
?inW 'A u f u k a
-20°
H A A P A I G R O U P /Vu*upu/9 * Suoteva
K o to . ^
*%* H a a f e v a
N o m u k a^ -%F o n o itu a N o m u k a ik i # • * ^
M a n g o % • La Iona
H u n g a H a a p a i
- '0E Ua ,k, T O N G A T A P U ^ ~ ~ \ ^ y T o n g a t a p u
G R O U P / I
_________________ ^
20"
-_50 Kilom etres
The economy of the Kingdom of Tonga is primarily based on agricultural production. This is the predominant activity consisting mainly of production of crops for local consumption. Some cash cropping has been added to this subsistence production and this forms the basis for the country’s main export earnings.
Cash cropping which includes coconuts, bananas, vanilla, root crops and vegetables contributes to rural family incomes. Apart from this, some members of the families may be employed in either the private or the public sector. Remittances from members who are
Zealand, Australia or the United States of America may also contribute substantially to the family income. The growth in the cash earnings is reflected in the desire for a higher standard of living. This is reflected in the type of housing and the number of people who own private vehicles. Earnings from some of the cash crops such as vanilla, xanthosoma and yams have shown an increasing trend. In the case of bananas, export earnings started to increase from 1978. Since 1977, a decreasing trend for
coconut products is also observed (Appendix C, Table C.l).
The macro-economic effects of the above situation are an increasing deficit on the trading account. Some of this deficit is reduced by remittances from Tongans living abroad. Other sources of capital includes earnings from services such as tourism and the high level of foreign aid to Tonga. Inflows reduces the deficit considerably.
agriculture. It is thought that the commercial agricultural sector would provide increasing demand for cash incomes whereas the subsistence sector will continue to provide basic food requirements.
In terms of the whole economy, the agricultural sector should be capable of providing increased export earnings, labour employment opportunities and a stable supply of subsistence food. At the same time the agricultural sector should enable a more effective utilization of the land resource which is becoming a limiting factor and thereby generating surplus suitable for the development of agro-based industries.
1.1 The Resource Base
The resources available to the Kingdom of Tonga are extremely limited. There are no exploitable mineral resources although intensive search has been undertaken. Although the land area is small (Table 1.1), most of it is available for cultivation with the exception of parts of
' Eua, Kao, Tofua and Late. The land which is generally flat or gently undulating is very fertile. Ward and Proctor (1980, p.7) reported the finding of Widdowson (1977) - who stated that:
"In Tonga, two major deposits of wind blown andesitic volcanic ash mask the surface limestone to a depth of
several metres and provide deep fertile soils with good physical properties."
The fertile land together with the favourable climate provides the potential for the development of a highly productive agricultural sector.
It has been estimated that the present consumption of
agricultural products and agricultural exports could be supplied from 7 per cent of the available arable land area (Duttaroy, 1980). This estimate signifies the great potential for the expansion of the agricultural sector.
TABLE 1.1
DRY LAND AREA AND POPULATION DISTRIBUTION FOR THE KINGDOM OF TONGA (1976 CENSUS)
Island Group
Area (hectare)
Percentage of Total
Area
Population
Percentage of Total Population
Population Density (person per
hectare)
Tongatapu 26197 39.2 57411 63.7 2.19
Vavau 14330 21.4 15068 16.7 1.05
Haapai 11930 17.8 10792 12.0 0.90
’Eua 8743 13.1 4486 5.0 0.51
Niuas 3809 5.7 2328 2.6 0.61
Others 1882 2.8 - -
-Total 66891 100 90085 100
-Source: Fourth Five Year Development Plan for the Kingdom of Tonga.
The surrounding sea area, with the Exclusive Economic Zone (EEZ) estimated at 362,600 sq.km., contains an abundance of fish resources.
This has a large potential for generating employment opportunities, raising domestic as well as export earnings. Therefore the national income can be increased through the development of both deep sea and inshore fishery.
The main forestry resources, apart from the ubiquitous coconut timber, are on Tofua and *Eua. Tofua has a potential forest area of 1,600 hectares and ’Eua 1,400 hectares.
Tourism is another important area for development to increase foreign exchange earnings. The growth of tourism was spectacular during the first half of the 1970s but fell off in the second half. The number of tourists arriving in Tonga depends mostly on the number of cruise ships and international flights to Tonga.
1.2 Location
area. It includes 169 islands, of which only 36 are inhabited. It is situated between latitude 15°S-23.5°S and longtitude 173°W-177°W. The total dry land area is estimated at 66,891 hectares (Table 1.1). The principal settled areas as recorded in the 1976 population census are presented in Table 1.1.
1.3 Climate
The rainfall is generally very high and well distributed. The monthly average rainfall for the years 1945-1980 is presented in Table 1.2. For the three main island groups, Tongatapu, Vava’u and Hahpai, the driest month is June with 90mm, 108mm and 73mm, respectively and the wettest month is March with 243mm, 375mm and 303mm,respectively.
The average temperature range recorded between 1949 and 1970 was 17.9°C (July) - 29.1°C (January). A highest maximum of 31.9°C (January) and lowest minimum of 10.6°C (July) was also recorded during the period.
The average daily relative humidity for 1962-1973 recorded at the capital, Nukualofa, ranges from 67 to 87 per cent.
1.4 Land Tenure
The land is held under a number of different forms of tenure. The most important are the tax allotments, town allotments and leases
(Table 1.3).
The allocation of land stems from the land tenure system embodied in the constitution. Under this system, every male Tongan who has reached the age of sixteen is entitled to apply for a rural tax allotment of an area not exceeding 3.34 hectares.
Population growth has led to insufficient supply of suitable land necessary to meet the needs of those eligible for tax allotments. During
TABLE 1.2
AVERAGE RAINFALL FOR 1945-1980
onth
Tongatapu Vava’u Haapai
Number of Years
Mean Rainfall
(mm)
Number Years
of Mean ; Rainfall
(mm)
Number Years
of Mean ; Rainfall
(mm)
Janary 36 209 34 288 34 215
Febuary 36 240 34 253 34 197
Marh 36 243 34 375 34 303
Aprl 36 179 34 217 34 191
May 36 98 32 132 32 94
Jun 36 90 33 108 33 73
Jul 36 97 32 124 32 96
Augst 36 115 31 110 31 104
Sepember 36 134 32 130 32 112
Octber 36 149 32 149 32 110
Novmber 36 131 32 189 32 134
Decmber 36 149 30 213 30 171
Anhal Mean 36 1834 32 2295 32 1806
Souce: Duttaroy (1981).
This trend will continue as the population grows. This is a majr problem facing the government as unemployment will tend to increase likwise. A short term solution to this problem is the further sub-divsion of the tax allotments into half sizes (1.67 hectares). This was accmmodated within the law of Tonga in 1958. Further subdivisions may be armful to the economy as less land will be devoted to cash cropping tthie most of the land will be used for subsistence crops.
The land tenure system was summed up by Maude (1971, pp.106): "The system of land tenure which has existed in the Kingdom of Tonga since the late 19th century differs in many
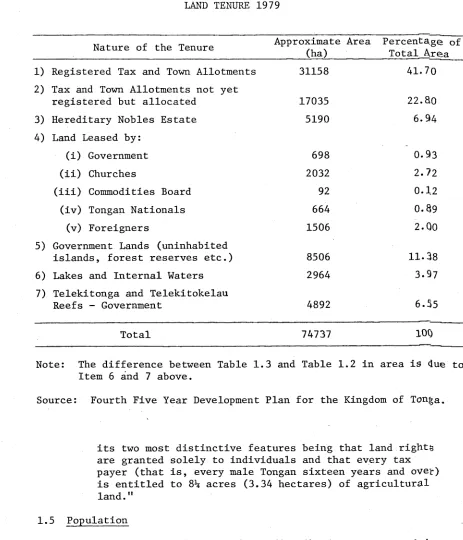
TABLE 1.3 LAND TENURE 1979
Nature of the Tenure Approximate Area (ha)
Percentage Qf Total Area 1) Registered Tax and Town Allotments 31158 41.70 2) Tax and Town Allotments not yet
registered but allocated 17035 2 2 . 8 0
3) Hereditary Nobles Estate 5190 6.94
4) Land Leased by:
(i) Government 698 0.93
(ii) Churches 2032 2.72
(iii) Commodities Board 92 0.12
(iv) Tongan Nationals 664 0.&9
(v) Foreigners 1506 2.00
5) Government Lands (uninhabited
islands, forest reserves etc.) 8506 11.38
6) Lakes and Internal Waters 2964 3.97
7) Telekitonga and Telekitokelau
Reefs - Government 4892 6.55
Total 74737 100
Note: The difference between Table 1.3 and Table 1.2 in area is clue to Item 6 and 7 above.
Source: Fourth Five Year Development Plan for the Kingdom of Ton^a.
its two most distinctive features being that land rights are granted solely to individuals and that every tax payer (that is, every male Tongan sixteen years and over) is entitled to 8^ acres (3.34 hectares) of agricultural land."
1.5 Population
The total population and its distribution as reported in. the 1976 census is shown in .Table 1.2. The population was estimated to have
[image:20.548.28.491.106.646.2]been for net outward migration to Australia, New Zealand and increasingly to the United States of America.
Equally significant, socially and economically is the drift of the population to Tongatapu. The 1976 census shows that about 11 per cent of the people who live on Tongatapu were born elsewhere in the Kingdom. The situation in Nukualofa, the capital, is more pronounced. The population doubled in the 20 year period 1956-1976 of which over 30 per cent have moved in from other parts of the Kingdom.
The average intercensal rate of population growth corresponding to the intercensal years 1946-1956, 1956-1966, 1966-1976 were 3.05 per cent, 3.14 per cent and 1.52 per cent, respectively (Table 1.4). The crude birth rate
TABLE 1.4
THE GROWTH AND STRUCTURE OF THE POPULATION
Population as at Census Date Estimated Category
1956 1966 1976 1980
mid-year
Male 28938 39837 46036 48290
(Percentage) (50.9) (51.45) (51.1) (50.96)
Female 27900 37592 44049 46470
(Percentage) (49.1) (48.55) (48.9) (49.04)
Total 56838 77429 90085 94760
Average Intercensal
Rate of Increase 3.05% 3.14% 1.52% 1.41%
Source: Fourth Five Year Development Plan for the Kingdom of Tonga.
This recent decrease in population growth is due to a marked decrease in the rate of natural increase and an increase in outward migration. The decrease in population growth rate was due mainly to the effective
adoption of family planning methods thereby reducing the birth rate. Although data on migration is incomplete it was estimated that during the period 1966-1976 net emigration was equivalent to 0.7 per cent per annum of the population.
The composition of the population by sex has changed only slightly between 1956 and 1976 with the male population composition increasing from 50.9 per cent to 51.1 per cent of the total population
(Table 1.4). The population is young with just over 44 per cent under the age of fifteen; 3 per cent is over the age of 65. This leaves 53 per cent as the active population (Table 1.5).
TABLE 1.5
AGE STRUCTURE OF THE POPULATION AS AT CENSUS DATE
Age Group
1956 1966 1976
Number Percentage Number Percentage Number Percentage
Under 15 24964 43.9 35745 46.2 40038 44.5
15-24 11013 19.4 14044 18.1 18061 20.0
25-34 7953 14.0 9983 12.9 10296 11.4
35-44 5152 9.1 7475 9.7 8519 9.5
45-54 3388 6.0 4775 6.2 6336 7.0
55-64 2244 3.9 2826 3.6 3845 4.3
65 and Over 2124 3.7 2581 3.3 2990 3.3
Total 56838 100 77429 100 90085 100
The economic implications of the above indicates a high potential labour force in the future. However, the migration of the potential
labour force from the outer to Tongatapu may cause restrictions in the amount of labour available for agriculture in the outer islands. However, the labour availability for agriculture in Tangatapu is less likely to be a problem. This was reported by Ward and Proctor (1980). Migration to the main island of Tongatapu will also create major problems of increasing unemployment and underemployment.
1.6 Manpower
Manpower comprises that part of the population between the ages of 15 to 64. The manpower is divided into labour force (those currently employed and those actively seeking employment) and that portion which is outside the labour force. In 1976, the portion of the population which was outside the labour force accounted for 27 per cent. This was composed of 19,300 females and 5,000 males (mainly students). Only 23.8 per cent of the total population were in the labour force. Of the total male populatic 39.3 per cent are in the labour force while 7.6 per cent of females are in the labour force (Table 1.6).
TABLE 1.6
MANPOWER AND LABOUR FORCE 1976
Not in
Manpower Outside Labour
Force
Manpower Labour
Force Total
Total Population
Total (000) 43.3 24.3 21.4 45.7 90
Male (000) 23.0 5.0 18.0 23.0 46
Female (000) 21.3 19.3 3.4 22.7 44
Total (percentage) 49.2 27.0 23.8 50.8 100
Male ( " ) 49.9 10.8 39.3 50.1 100
Female( ) 48.5 43.9 7.6 51.5 100
1.7 Employment
The share of the labour force in the total population remained constant at about 24 per cent over the period 1956-1976 as shown by Table 1.7.
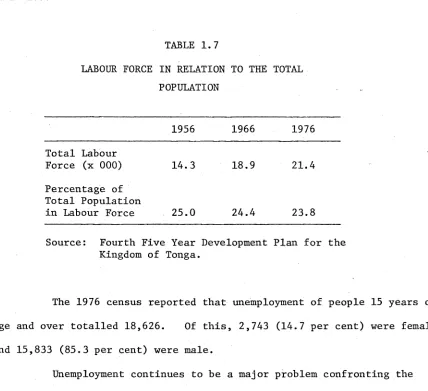
TABLE 1.7
LABOUR FORCE IN RELATION TO THE TOTAL POPULATION
1956 1966 1976
Total Labour
Force (x 000) 14.3 18.9 21.4
Percentage of Total Population
in Labour Force 25.0 24.4 23.8
Source: Fourth Five Year Development Plan for the Kingdom of Tonga.
The 1976 census reported that unemployment of people 15 years of age and over totalled 18,626. Of this, 2,743 (14.7 per cent) were female and 15,833 (85.3 per cent) were male.
Unemployment continues to be a major problem confronting the government. The population and the absolute labour force continues to grow but land is no longer available for distribution to adult males under the terms of the constitution.
[image:24.548.71.499.162.553.2]It was estimated in the Fourth Five Year Development Plan for the Kingdom of Tonga (DP IV) that about 4,000 people will enter the labour force during 1980-1985. Of this, over 50 per cent will be accommodated in the agricultural sector. There is inadequate capacity in the monetised non-agricultural sector to provide employment for those who do not own tax allotments.
Due to changes in immigration policies of both New Zealand and Australia and the limitations of wage employment in the monetised non- agricultural sector, it is evident that the most important sector to be considered for increasing employment opportunities, family incomes and foreign exchange earnings is the agricultural sector. Apart from this one of the major potentials for industrial development is based on the processing of agricultural products. Therefore the agricultural sector will be required to increase its output and productivity to provide
surpluses for such a development. 1.8 Capital Resources
The capital resources important for the development of a viable commercial agricultural sector includes: (a) the supply of credits and purchased inputs; (b) promotion of extension, research and education; and
(c) existence of a suitable infrastructure for servicing transport and market outlets. In this respect Hardaker (1975) pointed out that both capital and skills are scarce in the Kingdom of Tonga.
1.8.1 Infrastructure
Although the infrastructural resources available to the
most of the agricultural products but to some extent, the outer islands have been neglected. Lack of suitable roads is also a constraint to development, especially for banana production. Shipping remains one of the major problems. Ward and Proctor (1980, pp.178) concluded that:
"It is clear that both external and internal shipping sectors have significant problems which inhibit agricultural and rural development."
The deterioration in shipping services has been disastrous for the export of perishable crops, such as bananas, root crops and vegetables. This affects small holder production as most crops produced for export are perishable with the exception of coconut products, vanilla (Vanilla
fragrans) and Kava (Piper methysticum). Hardaker (1975) also acknowledged that transportation is a problem in Tonga.
1.8.2 Education
Agricultural education in Tonga is taught at the secondary school level. Apart from this, church denominations have established training institutions for school leavers but the enrolment is very limited. Such institutions include Hango and Mahinae'a (Free Wesleyan Church), Niumate
(Mormons) and Fualu (Catholic). These institutions teach basic farming techniques at primary level. Tertiary agricultural education has to be attained overseas in colleges such as the Regional College of Tropical Agriculture (Western Samoa), Fiji College of Agriculture (Fiji), Vudal College (Papua New Guinea), and colleges in New Zealand, Australia and the United States. Diploma holders from these colleges are now holding
responsible positions in both the government and the private sector.
the Ministry of Agriculture on an ad hoc basis. This training is important because these farmers are almost certain to remain as farmers.
1.8.3 Tonga Development Bank
The establishment of the Tonga Development Bank in 1977 marked a new era for the Tongan farmers. Previously there were no organised formal lending institutions whereby farmers could get loans for crop production. The bank started with a nominal capital of T$250,000.00 and by the end of 1980 this had increased to more than T$1.8 million. Bank lendings have been made for agriculture, fisheries and livestock development. The bank has supported the development of both subsistence and commercial crops. The bank lending is summarised in Table 1.8.
TABLE 1.8
AGRICULTURAL LOAN APPROVAL BY THE TONGA DEVELOPMENT BANK (T$'000) - 1977-1980
1977 1978 1979 1980 Total
Beverages and Spices 1.3 8.4 12.5 26.5 48.7
Fruits (Banana, Vanilla) 13.5 27.7 18.6 30.9 90.7
Root Crops 52.6 167.0 106.8 138.8 465.2
Vegetables 21.2 69.0 45.4 46.2 181.8
Others (Mulberry) 1.2 1. 3 1.2 0.7 4.4
Livestock 77.2 50.7 31.9 53.1 212.9
Structural 12.8 36.2 21.8 48.4 119.2
Plant and Equipment 36.2 87.6 64.9 30.0 218.7
Transport 19.5 74.1 35.7 125.4 254.7
Communities - 4.6 1.0 238.8 244.4
Total 235.5 526.6 339.8 738.8 1840.7
About 40 per cent of the loans was provided as working capital for short term crops. The importance of the root crops is reflected by the high percentages of the loan (25 per cent - the highest) attributed to these crops. This reflects the importance of the annual crops for domestic consumption as well as for exports.
1.8.4 Research and Extension
Research and Extension are very important in promoting a subsistence sector into a commercial or partly commercial sector.
Effective research must be carried out on existing crops and potential intercrops in terms of increasing productivity and foreign exchange
earnings. The results obtained must be transferred to the farmers. This can be done by an effective extension service. These two services are provided by the Ministry of Agriculture, a part of the Tongan public service.
1.9 Imports
In spite of the predominantly agricultural economic base, Tonga is heavily dependent on food imports such as meat, cereals and tinned food. Import items are presented in Table 1.9. Over recent years the foreign exchange earnings from agricultural exports have not kept up with the cost of food imports during the same period. The increase in food import value in recent years reflects the effects of inflation and a rise in the standard of living.
1.10 Balance of Payment
The overall picture for the Balance of Payment for the 1970s shows a growing weakness of the economy (Table 1.10). During the first five years, exports were sufficient to cover only 44 per cent of imports. This
TABLE 1.9
THE STRUCTURE OF IMPORTS (CIF) BY COMMODITY AND VALUE
1970 1975 1980
Item
(T$'000) % (T$'000) % (T$'000) % Food and Live Animals 1621 29.3 3557 27.4 7082 23.5
Beverages and Tobacco 438 7.9 892 6.9 1966 6.5
Crude Materials 185 3.3 1012 7.8 1624 5.4
Mineral Fuels and
Lubricants 328 5.9 747 5.8 4293 14.3
Oils, Fats and Chemicals 449 8.1 815 6.3 1727 5.7
Manufactured Goods 1255 22.7 2660 20.5 5986 19.9
Machinery and Transport
Equipment 748 13.5 2033 15.7 5095 16.9
Miscellaneous Manufactures 463 8.4 1196 9.2 2230 7.4
Others, Not Classified 52 0.9 51 0.4 131 0.4
Total Imports 5539 100 12963 100 30134 100
Source: Fourth Five Year Development Plan for the Kingdom of Tonga (DP IV).
The major contributor to the current account is unrequited transfers from Tongan nationals living overseas. Throughout the last decade, unrequited transfers were larger than export receipts (DP IV).
The strength of the balance of payments during the 1970s lay in the capital account. The net capital inflow during this period was T$14.5 million resulting in an increase of foreign reserves.
TABLE 1.10
BALANCE OF PAYMENT SUMMARY 1970/71 - 1979/80 (T$’000)
Year Export Import Balance Trade
of
Balance of Net Invisible and Transfer
Payment
Current Account Payment
1970/71 2377 4601 -2225 1718 -507
1971/72 2426 5587 -3161 1990 -1171
1972/73 2495 5804 -3309 2757 -552
1973/74 3384 7516 -4132 4779 +647
1974/75 5679 13961 -8282 8537 +255
1975/76 3586 12846 -9259 7665 -1594
1976/77 3718 13383 -9666 7932 -1734
1977/78 6722 16369 -9647 9044 -603
1978/79 5132 20012 -14878 12750 -2130
1979/80 10285 25452 -15167 15143 NA
Note: NA Not available.
Source: Fourth Five Year Development Plan for the Kingdom of Tonga.
this respect the structure of the country's balance of payments has
weakened although, in terms of foreign reserves and currency strength, the external position appears to be sound.
1.11 The Agricultural Sector in Tonga
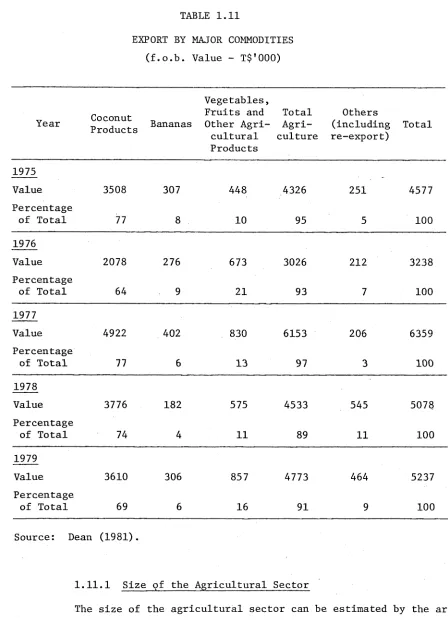
TABLE 1.11
EXPORT BY MAJOR COMMODITIES (f.o.b. Value - T$'000)
Year Coconut
Products Bananas
Vegetables, Fruits and Other Agri cultural Products
Total Agri culture
Others (including re-export)
Total
1975
Value 3508 307 448 4326 251 4577
Percentage
of Total 77 8 10 95 5 100
1976
Value 2078 276 673 3026 212 3238
Percentage
of Total 64 9 21 93 7 100
1977
Value 4922 402 830 6153 206 6359
Percentage
of Total 77 6 13 97 3 100
1978
Value 3776 182 575 4533 545 5078
Percentage
of Total 74 4 11 89 11 100
1979
Value 3610 306 857 4773 464 5237
Percentage
of Total 69 6 16 91 9 100
Source: Dean (1981).
1.11.1 Size of the Agricultural Sector
[image:31.548.50.498.77.697.2](1980) estimates the arable land in terms of tax allotments (3.34 hectares). He estimated that there were about 12,000 tax allotments covering an area of about 40,000 hectares. This is about 60 per cent of the total dry land area.
1.11.2 Importance of the Agricultural Sector
The importance of the agricultural sector to the economy has been discussed previously in terms of its contribution to the foreign exchange earnings. The agricultural sector's importance is also reflected in allocation of government controlled resources, including foreign aid in the Fourth Five Year Development Plan. This is presented in Table 1.12.
TABLE 1.12
ALLOCATION OF GOVERNMENT CONTROLLED RESOURCES
Sector Percentage
Allocation
1) Agriculture 18
2) Forestry 1
3) Fisheries 15
4) Mining and Quarrying 1
5) Manufacturing 3
6) Electricity and Water 7
7) Building and Construction 1
8) Wholesale, Retail, Trade and Tourism 9
9) Transport - Communications 24
10) Services, including Health and Education,
Law and Order and Government Administration 21
Total 100
The allocation for the agricultural sector is 18 per cent. Agriculture will also benefit from the allocation to Transport - Communications (24 per
cent) in terms of improved raods, more vehicles, wharf facilities and inter-island transports.
1.11.3 The Performance of the Agricultural Sector
The performance of the agricultural sector can be looked at in terms of the domestic production and consumption and the contribution to the Gross Domestic Product (GDP).
1.11.3.1 Household Consumption
Duttaroy (1980) did a survey of the household consumption for the Kingdom of Tonga. The result is presented in Table 1.13. The survey recorded that all consumption of staple subsistence food was met by local production. About 41,755 tonnes of root crops were produced in Tonga in 1979. Of these, 37,313 tonnes were consumed locally, the rest exported.
1.11.3.2 Gross Domestic Product
When studying the Gross Domestic Product of subsistence and semi-subsistence economies, it is always hard to estimate the non-monetary component (Fisk, 1975). However, Table 1.14 reports both monetary and non-monetary contributions which indicate that an attempt has been made in estimating the non-monetary component. The writer is not aware of how this was done.
TABLE 1.13
ANNUAL HOUSEHOLD CONSUMPTION OF LOCALLY PRODUCED FOOD AND ANIMAL FEEDS IN METRIC TONS IN 1979
Items Tongatapu Tongatapu Outer Kingdom of
Urban Rural Islands Tonga
Root Crops
Xanthosoma 1607 4804 4002 10413
Swamp Taro 168 483 361 1012
Cassava 1539 4098 4439 10076
Sweet Potatoes 332 229 259 820
Yams 895 4174 3498 8567
Alocasia (Giant Taro) 174 782 2580 3536
TOTAL ROOT CROPS 4715 14570 15139 34424
Vegetables
Tomatoes 125 470 186 781
Fruits and Nuts
Plaintain 368 1673 1623 3664
Banana 469 1952 740 3161
Watermelons 32 187 144 363
Mature Coconuts (’000) 1348 5501 4888 11737
Green Coconuts (f000) 72 1012 1306 2390
Animal Feeds
Coconuts (’000) 1133 6632 8997 16762
Xanthosoma 266 255 93 614
Cassava 754 1755 2550 5059
Kape etc. 7 68 400 475
[image:34.548.49.520.122.808.2]TABLE 1.14
GROSS DOMESTIC PRODUCT BY KIND OF ECONOMIC ACTIVITY (Current Prices - 1981)
1974/75 1977/78 1979/80
Value
% Value % Value %
(T$’000) (T$'000) (T$’000) 1) Agriculture, Forestry &
Fishery 10530.6 50.1 12966.3 41.8 15582.4 40.5
a) Monetary 5263.0 25.0 6238.5 20.1 8216.8 21.4 b) Non-Monetary 5267.6 25.1 6727.8 21.7 7365.6 19.1 2) Mining and Quarrying 110.1 0.5 195.3 0.6 260.8 0.7
3) Manufacture 1110.2 5.3 2303.5 7.5 2955.8 7.7
a) Monetary 935.7 4.5 2002.0 6.5 2579.0 6.7
b) Non-Monetary 174.5 0.8 301.1 1.0 376.8 1.0
4) Electricity and Water 196.4 0.9 342.7 1.1 339.5 0.9
3) Construction 761.6 3.6 1497.3 4.8 2462.2 6.4
a) Monetary 480.1 2.3 1288.9 4.2 2152.7 5.6
b) Non-Monetary 281.5 1.3 208.4 0.6 309.5 0.8
6) Wholesale and Retail Trade, Restaurants and
Hotels 2822.8 13.8 4439.3 14.3 5507.7 14.3
7) Transport, Services
and Communications 775.9 3.7 1824.7 5.9 2519.9 6.6 8) Finance and Real Estate
(including ownership of
dwellings) 1535.0 7.3 2270.0 7.3 2744.3 7.1
a) Monetary 193.0 0.9 453.0 1.5 632.7 1.6
b) Non-Monetary 1342.0 6.4 1817.0 5.8 2111.6 5.5 9) Community, Social and
Personal Services 3171.7 15.2 5188.5 16.7 6089.9 15.8 10) Gross Domestic Product
at Factor Cost 21014.3 100 31027.2 100 38462.5 100
ID
Plus Indirect Taxesless Subsidies 3817.6 5290.3 6066.6
12) Gross Domestic Product
at Market Prices 24831.9 36317.5 44529.1
Source: National Account Estimates for the Kingdom of Tonga 1974/75 -1979/80.
"Achieve a sustained increase in the production of goods and services, and real incomes of the people; Achieve effective management of the national economy; Achieve a fair distribution of goods, services and income between the people in different parts of the Kingdom;
Enhance the quality of life and security of the people, the cultural heritage of the nation, and the
preservation of the environment;
Develop harmonious relations and mutual cooperation in economic, social and related spheres with all nations and international organisations."
While there are other sectors that can be considered in achieving part of the national objectives such as an equitable distribution of income, improving the quality of life and increasing production, focus is directed at the agricultural sector. The economy of the country has always evolved around agriculture. The importance of the agricultural sector to the economy of the Kingdom of Tonga is clearly stated in the Fourth Five Year Development Plan. Given the need for new technologies and improved production systems, within the limits of capital and other available resources, the agricultural sector will still be the main sector for development in the future.
1.13 Plan of Study
Agriculture plays an important role in the economy of Tonga. The government is faced with the task of organising agriculture both in the subsistence and commercial sectors. The main issues are raising
The Fourth Five Year Development Plan sets out targets for existing cash crops such as vanilla, bananas, coconuts, root crops and vegetables. The plan also probes the possibility of introducing new intercrops, with potential markets, to be planted under coconuts.
1.13.1 Objective of the Study
In this study the objective is to examine the economic potential of planned intercropping of coconuts in Tonga and at the same time allowing for social and subsistence obligations of the households. Different inter cropping models will be examined and reported upon. The choice of an optimum model will be left to the farmer. Economic data are confined to the financial aspects of the system while social and subsistence
obligations are taken into account in the different crop models presented. Therefore the objective of the study will include the appraisal of different crop models in terms of:
1) Raising farm family income. 2) Net Returns (SNPV).
3) Employment opportunities which are reflected in the labour requirement.
4) Fulfilling subsistence and social requirements. 5) Foreign exchange earnings.
The next chapter will look at the existing farming system in Tonga. It considers intercropping as one type of production system to fulfil some of the nation's aspirations. A review of literature with regards to intercropping will also be carried out.
CHAPTER 2
AGRICULTURE AND POTENTIAL FOR INTERCROPPING
This chapter will discuss firstly the traditional farming system in Tonga focusing on the existing cropping pattern. Secondly, there is a discussion of the importance of the technical and agronomic aspects of intercropping thereby establishing the need for the consideration of agronomic technology of individual crops. Advantages of intercropping and why it is carried out are also highlighted. This is then followed by a discussion of modern intercropping as an agronomic system emphasizing those technical aspects which influence the economic analysis.
2.1 Intercropping
For this study, intercropping is defined as the process of growing two or more crops simultaneously in the same piece of land. One of these crops, the principal crop, is coconut.
The importance of intercropping as a mean of achieving some of the national objectives have been established in the previous chapter. The writer is not aware of any studies done in Tonga to estimate existing intercropping patterns. However, there have been some studies done at the Research Division of the Ministry of Agriculture with regards to intercropping under coconuts between the age of 25-29 years old. This forms the basis for the data adopted in the final analysis.
In discussing the farming system, it is hoped to highlight the fact that intercropping is carried out with regards to most cropping activity. However, it is done in an informal manner.
2.2 The Farming. System
practised in Tonga. Under the terms of the constitution, every tax allotment owner is directed to grow at least 200 coconut palms (Wylie, 1967, pp.620 cited in Hardaker, 1975) which will give him cash from the sale of copra. The allotment was envisaged to be sufficient to provide adequate food for the family as well as for social obligations. In
addition, the farmer can also plant some cash crops. Although agriculture is principally subsistence oriented, many farmers are caught between the social demands of their kin, church and traditional leaders on the one hand and the demands of modern agriculture and their rising aspirations on the other (Ward and Proctor, 1980). Thus an important feature of the economy of Tonga is that a large subsistence sector co-exists with monetary activity.
A large proportion of most of the tax allotments is planted with coconuts. This leaves the farmer no alternative but to plant his
subsistence crops and cash crops under coconuts. Thus intercropping
under coconuts is an important feature of the Tongan farming system. Ward and Proctor (1980) also reported that:
"At present, coconuts form an upper storey over much of the agricultural land but interplanting with a wide range of crops such as taro, bananas, yams is common. The coconut now represent a structural feature of the agricultural environment to which other land uses must adapt or which much be removed to make way for alternative uses."
The cropping pattern in Tonga can be described as consisting mainly of a Fallow System. The growing subsistence need for an increasing population and expanding cash production leads to a shortening of the
fallow periods. Fallow system is defined as the cultivation of between 33 per cent and 66 per cent of the tax allotment annually (Ruthenburg, 1980) .
Under the present farming system an area of bush fallow may be cleared either by the slash and burn technique or tractor cultivation and the land is then continuously cropped for a number of years. Duttaroy (1980) estimates that about 40 per cent of the arable land was cropped in 1979, the other 60 per cent was either left fallow or used for grazing of livestock. Hence under the current system of cropping, more than half of the arable land area is under-utilized. The use of fertilizers and effective crop rotational patterns using legumes are very restricted. Thus it is still necessary for some land to lie fallow periodically to replenish soil fertility.
The bush fallow system is an extensive production system. Much scope exists for the adoption of more intensive methods, employing new technologies of agricultural production.
The main changes in the cropping pattern in recent years have been mainly the adaptation of traditional methods rather than the
introduction of new techniques. In this regard there is a need for more effective applied research and extension inputs with regards to the
development of suitable systems of intercropping in Tonga.
Evidence of demand for a greater volume and variety of agricultural products for the domestic market is confirmed by the
Household Consumption Survey (Duttaroy, 1980). Existing export markets can absorb a greater quantity of bananas, vanilla and to a lesser extent, root crops and vegetables.
Hardaker (1975, pp.93) concluded that:
"Cropping patterns in Tonga give the impression of being somewhat random or erratic .... Mixed cropping is common, both in the form of intercropping, where one crop is planted in the spaces in another crop to exploit differences in growth habit, time of maturity etc., and in the form of a more random interplanting of two or more crops on the same area."
Potentials for improvement in the production of the agricultural
sector was summed up by Hardaker (1975, pp.108):
"Nevertheless, present farming methods are still
generally of low productivity. Both land and
labour are used relatively extensively while capital formation within agriculture has proceeded to a very
limited extent. It seems clear that, at least in
principle, there is scope for the adoption of more intensive methods of agricultural production, leading to higher levels of agricultural output, income and employment."
He also pointed out that the possibility for improving the soil fertility
lies in the application of technical inputs (fertilizer) and including
legumes in crop rotations during the fallow period.
Thus it is evident that most cropping activities are done as
intercropping under coconuts. Therefore the potential for achieving some
of the national objectives lies in the further development of the
intercropping system.
2.3 Reviews of Studies on Intercropping
Having examined the prevailing cropping pattern in Tonga, with
reference to the potential for intercropping, we can now look at the
technical basis for the economic analysis of factors affecting intercropping.
The planting of two or more crops in an area results in a complex
biological system, with many complementary relationships involving such
resources as nutrients, water, light and space. The long term nature of
some of the crops (perennials) complicates this relationship further. In
some cases the relationship between time periods may be expected to change.
This may result in a change of total output. Thus in defining the
input-output coefficients of an intercropping system, it is necessary to examine
the agronomic characteristics of the individual crops as well as considering
the time and spatial relationships of the intercrops with the principal
Due to the complex relationship discussed above, there has been a divergence of opinion with regards to intercropping. Sampson (1923, pp.149-53) concluding that intercropping retards the development of the palm during the establishment phase, condemns intercropping during this period. Others including Mathur (1963, pp.38-43), Norman (1974) and Abalu (1975), in considering traditional intercropping systems, concluded
that intercropping not only gives higher gross return per hectare but it also plays an important role as insurance against risk. Ruthenburg (1980) pointed out that in the humid and semi-humid tropics intercropping creates more effective and profitable land use systems. Jodha (1979) concluded
that intercropping is superior over sole cropping in terms of gross return per hectare as well as per manday used during the labour scarce period of the crop season. Intercropping results in a greater and more even
distribution of employment of labour.
Jodha (1979) also highlighted two important features of the traditional intercropping system. Firstly, intercropping is more important on small rain-fed farms as compared to large irrigated farms. Secondly, the traditional intercropping system is highly complex and diverse. This is because of the need to satisfy the farmers multiple objectives simultaneously.
The divergence of opinion on whether to intercrop or not has been summed up by Nair (1979, pp.46):
potential of good cropping systems involving coconuts was itself not existing."
Willey (1979) provides a comprehensive review of intercropping literature with particular reference to annual crops, noting the prime areas of scientific investigation to be on the yield advantages and the potential control of weeds, pests, diseases and soil erosion. The complexities of possible interactions between different crops are great. Both competitive and complementary effects are possible. This depends on the specific crops considered and their relative densities. The biological basis for intercropping advantages, considering both spatial and temporal dimensions, relates primarily to the utilization of biological resources and yield stability.
In spite of the complexities discussed above, there appear to be sound scientific reasons why selected intercropping systems can increase the productivity of the agricultural sector.
In the last section of this chapter an attempt is made to look at the factors which may affect intercropping thus limiting the
production of output. We can now consider some of the technical basis for modern intercropping based on research work done at the Central Plantations Crops Research Institute (CPCRI) of South India.
2.3.1 Modern Intercropping Systems Burgess (1981) reported that:
"The development of multi-storeyed cropping at the CPCRI arose from considerations of biological efficiency in the process whereby crops use the resources of solar energy and land mass for the production of economic output."
Theoretical calculations by Loomis and Williams (1963) indicated that under optimal conditions, the potential biological productivity of a crop community could be as high as 280.5 tonnes of dry matter per hectare
per year. It is evident from Table 2.1 that under coconut monocrop, there is a wide gap between the potential and actual dry matter production.
TABLE 2.1
TOTAL ANNUAL PRODUCTIVITY OF A COCONUT PLANTATION AT DIFFERENT YIELD LEVELS
Plant Part
Total Dry Matter (Net Assimilates) Production (t/ha) at an Average
Annual Yield per Palm of
60 nuts 100 nuts 250 nuts
Whole Nut 6.70 11.20 28.00
Spathe and Rachis 0.15 0.15 0.15
Leaves 4.60 4.60 4.60
Stem 1.50 1.50 1.50
Roots 1.25 1.25 1.25
Total 14.20 18.70 35.50
Source: Nair, 1979. (Computed from Nelliat et al, 1974. Weight of roots estimated by Khanna and Nair, 1977.)
Increasing the productivity levels of coconut plantations is limited by the fact that the efficiency of conversion of solar energy to chemical energy is much less in oil producing crops as compared to
carbohydrate producing crops (Mengel, 1977; Beringer, 1977).
Soil (land mass) and solar energy are the two basic resources of practical crop production. Others such as water and nutrient represents
Dalrymple (1975) pointed out that multiple cropping makes possible both an increase in area cultivated per year as well as an increase in total yield per unit area per unit time. This implies a better and fuller utilization of both the basic and technical resources.
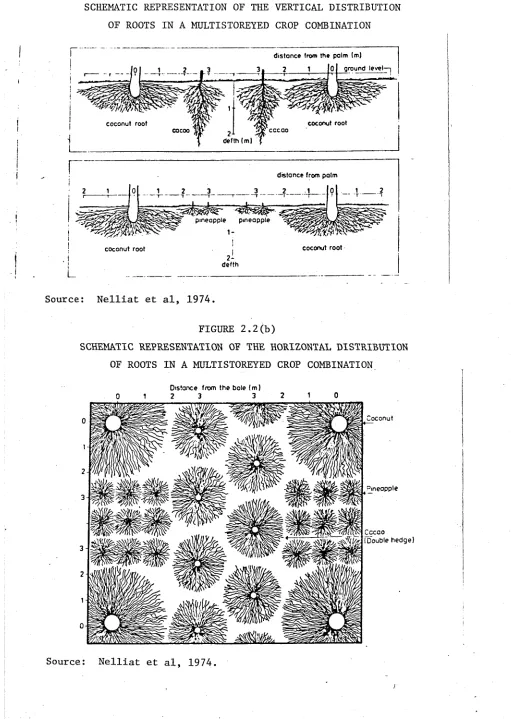
With respect to perennial cropping, the crop occupies the land for more than one year. Therefore the approach at CPCRI was to examine combinations of mutually compatible crops which efficiently utilized the environmental resources. Most of the studies reviewed here with regards to intercropping are based on the work at CPCRI.
In choosing the spacing for coconut planting, an important criteria is to ensure that overlapping of leaves of adjacent palms are minimal or avoided altogether. Therefore the spacing adopted at CPCRI
for the local tall variety was 7.5m x 7.5m square.
The CPCRI multistoreyed cropping formulation as discussed by Burgess (1981) and Nair (1979) is static in the sense that crop combinations considered were those planted under coconut stands which were 30-40 years old. The concept of multi-storeyed cropping is based on two issues:
(a) the root system of different crops are restricted to distinct zones so as to utilize the soil volume more fully at various layers with minimum or no effect on each other; (b) the canopy orientation of different species at different levels to ensure more efficiency in the utilization of solar energy.
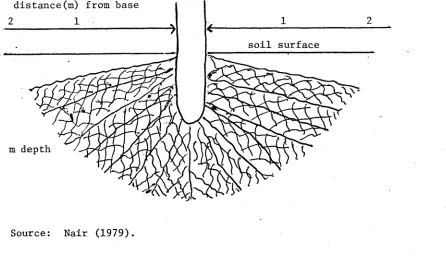
Recent studies at CPCRI (Kushwah et al, 1973) showed that the roots of a mature bearing palm, planted in sandy loan medium textured
FIGURE 2.1
ROOT DISTRIBUTION OF A COCONUT TREE
distance(m) from base
soil surface
m depth
Source: Nair (1979).
conditions, only about 25 per cent of the gross land area is effectively
utilized by the coconut roots. In planting the intercrops, the active
root zone of the coconut has to be left free thus reducing the competition
between roots for both the basic and technical resources. The net area
occupied by the intercrops will vary from 65-75 per cent of the gross area
depending on the method of planting (Figure 2.2(a) and (b)). Although cacao and
pineapple are not included in the crops considered in this study (Chapter 4),
Figure 2.2(a) and Figure 2.2(b) is presented as an example of the
distribution of roots for both the intercrops and the principal crop in the
different zones of the soil.
[image:46.548.47.493.132.397.2]