Carbon and Energy Performance of Housing: A model and toolset for
policy development applied to a local authority housing stock.
P.G.Tuohy*1, P.Strachan1, A. Marnie2 1
The Energy Systems Research Unit, University of Strathclyde, Glasgow, G1 1XJ, UK
2
South Ayrshire Council, Ayr, KA7 1DR
*
Corresponding Author, email: [email protected]
Abstract
The area of strategy formulation for energy and carbon performance of housing is coming under increasing focus. A model has been developed based on simulation results aligned with
knowledge of the housing stock which can be used to calculate energy, carbon and cost results from a reduced number of input parameters. The context of the model can be varied to reflect different climates and patterns of use. The model is embedded in a user friendly java tool which can be used to give results for a dwelling or the housing stock of an organisation, region or country. It is possible to investigate the effect of housing upgrade options, future building regulations, climates, patterns of use, renewable energy systems etc. and support formulation of future policy. In this paper the tool is briefly described and an example given showing its application to a local authority rented housing stock.
Keywords: Housing energy use, carbon footprint, energy rating, housing strategy
1. Introduction
The UK building stock is responsible for over 40% of the country’s CO2 emissions. To achieve
the UK Governments target of 60% reduction by 2050 will require significant change in our approach to the upgrading of existing buildings. Domestic energy and carbon calculation methods in current use such as the UK Governments Standard Assessment Procedure [1] are based on simple energy balance methods and do not allow the dynamic performance of buildings to be fully assessed. There are many different options for upgrades to the existing housing stock which can be applied either individually or in any number of combinations. As buildings are expected to have extended lifetimes, in addition to assessing upgrade options for dwellings in the current situation, it is important to assess the performance of dwellings in likely future contexts which may include the impact of factors such as climate change, demographic change, change in occupant expectations of inside temperatures (summer and winter) and changes in available fuels and electricity generation mix etc. All of these upgrade options and future contexts must be considered when formulating upgrade strategy for the domestic housing stock. To allow all factors to be assessed together, an energy and carbon rating tool has been developed. The tool has evolved from work previously carried out at the University of Strathclyde on assessment of housing upgrade strategy [2]. The case study presented here shows the tool applied to the Council housing stock in South Ayrshire. This work forms part of the Rurasu project, supported by the European Commission's "Intelligent Energy - Europe" programme. The Rurasu project involves the operation of rural Design Advice and Support Units to provide advice and services in the areas of energy conservation, renewable energy and energy management. The four units involved in the project are based in Germany (Allgau region), Greece (Katerini), Spain (Subbetica
Cordoba) and Scotland (South Ayrshire). An important initial task of the work carried out within the project was to determine the characteristics of the building stock in each of the regions, and to undertake an analysis of the various refurbishment options.
2. The University of Strathclyde Dwelling Energy and Carbon Tool
use is considered. The calculations use a simple input data set together with knowledge of the Scottish housing stock (the tool could be modified for other areas). Knowledge of the Scottish housing stock and supply systems has been accumulated from a variety of sources including the Scottish House condition Survey [3], the BRE Domestic Energy Fact File [4] and the Building Market Transformation databases [5]. The building fabric and systems options included are those that are found in the current housing stock and those that we anticipate will be used in the future including super insulation to ‘Passive-house’ standards [6], mechanical ventilation, air and ground source heat pumps, solar hot water, wind turbines, photovoltaic, micro-CHP, community CHP, wood and biomass systems.
The applications of the tool include:
• Individual dwelling energy, carbon or cost rating
• Individual dwelling upgrade option appraisal
• Housing stock analysis (energy, carbon, cost)
• Housing stock upgrade strategy appraisal
• Climate change impact analysis
• Impact of occupant behaviour on carbon, energy, running costs
• Detailed modelling of building dynamic performance (overheating etc)
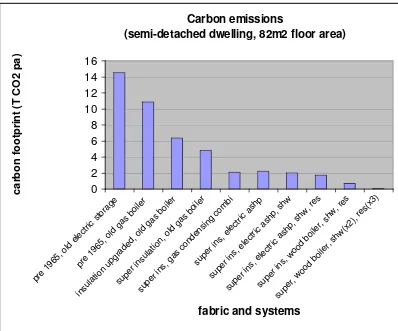
[image:2.612.93.491.384.715.2]An example of the tool output for various fabric and systems options is shown below as well as an overview of the tool architecture.
Fig 1. Example of University of Strathclyde Energy and Carbon Model Output
Carbon emissions
(semi-detached dwelling, 82m2 floor area)
0 2 4 6 8 10 12 14 16 pre 1965
, old
ele ctric sto rage pre 1965
, old
gas
boi
ler
insu
latio
n up
grad
ed, o
ld g
as b
oile
r
supe
r ins
ulat ion, old gas boi ler supe
r ins
, gas
con dens ing com bi supe
r ins
, ele
ctric
ash
p
supe
r ins
, ele
ctric
ash
p, s
hw
supe
r ins
, ele
ctric
ash
p, s
hw, r
es
supe
r ins
, woo
d bo
iler,
shw
, res
supe
r, w
ood
boile
r, sh
w(x
2), r
es(x
3)
fabric and systems
The input data for the calculations can be entered manually using the java data input screen or the tool can be run from an input file. Where data is entered manually into the tool there is the option to create an archive file which can be used to store the input details together with the calculation results. This allows a housing database to be constructed which can then be used as the basis of upgrade scenario evaluation etc. Where a housing database already exists which contains the appropriate dwelling details then it can be translated into the input format required for the tool and the calculations run with no new data collection being required. The context behind the calculations can be varied. This allows the effects of different climates to be assessed (including projected future climates [7]). The default context is set to match with the UK average operations [1, 8] and realistic conservative energy yields from the renewable systems [2].
For the South Ayrshire Council housing stock evaluations the existing housing database as supplied on 17th January 2007 was used as the input data and the context of the calculation was set to the default as the population of tenants is assumed to have typical patterns of energy use.
3. The South Ayrshire Council housing stock
The housing energy database covering the 9000 dwellings in the South Ayrshire stock was analysed and parameters driving the energy performance extracted [9]. The housing stock was broken into categories to allow the energy performance of the stock to be calculated and appropriate upgrades selected for a given situation. A distinction was made between non traditional construction (flat roof and solid ground floor) and traditional construction (pitched roof and suspended timber ground floor). The total number of dwellings analysed directly is 7876 of the total population of 8796 (89.5%). 2 storey flats (Maisonettes) and 1 storey houses have not been directly analysed due to their smaller numbers and similarities to the other categories.
4. Appropriate upgrade measures
In order to ensure that the upgrade measures applied in this study were appropriate for the South Ayrshire housing stock, examples of these upgrades applied to similar properties were identified. Many of these examples are from the Energy Savings Trusts (EST) ‘Practical help’ publications [10]. A full table of references to the upgrade option specifications and the documentation of case studies of the upgrades applied to similar dwellings are given in the Rurasu detailed report [11]. The analysis of the housing stock energy performance was carried out for a number of different upgrade scenarios as detailed below. It should be noted that the upgrades are only applied to categories of dwelling that are appropriate e.g. solar hot water and renewable electricity generation is only applied where there is an exposed roof etc.
4.1 “As is”
The current stock without any upgrades applied. The majority of the stock already has double glazing, loft insulation and cavity wall insulation.
4.2 “Low cost fabric improvement” (fabric upgrade A)
Where there is a pitched roof and a suspended wooden floor then loft insulation is increased to 400mm and the timber suspended floors insulated to 75mm. It is assumed that all cavity walls have already been filled. All dwellings to have basic double glazing. All dwellings brought up to ‘tight’ infiltration standards (all windows, doors, loft access and suspended timber ground floors draught proofed and humidistat extract ventilation applied to wet areas).
4.3 “Major fabric upgrade” (fabric upgrade B)
4.4 “2007 heating systems”
Gas, electric and solid fuel heating systems are upgraded to condensing instantaneous water heating boiler, air source heat pump with radiators and wood boiler respectively (similar to those proposed in 2007 Scottish building regulations consultation document[12]).
4.5 “Fabric upgrades A+B with 2007 heating systems”
The combination of fabric improvements and heating systems upgrade.
4.6 “Fabric upgrades A+B with 2007 systems plus solar hot water heating”
A standard solar collector which delivers 920kWh per year is applied to properties with an exposed roof (i.e. not mid or ground flats).
4.7 “Fabric upgrades A+B with 2007 systems, solar hot water and renewable generation”
In addition a domestic renewable generation device which delivers 650kWh per year is applied to properties with an exposed roof (i.e. not mid or ground flats). This generating device can be a domestic wind turbine or a PV panel.
4.8 “Fabric upgrades A+B with CHP”
Scenarios have been developed which replace domestic gas boilers with gas micro CHP systems of the Stirling engine type (12% electrical, 90% overall efficiencies). Also for the mid flat category a scenario has been developed where gas fired community CHP systems replace electric heating.
4.9 “Fabric upgrades A+B with Biomass”
Scenarios have been developed which replace individual heating systems with either individual wood boilers or community wood boiler systems.
5. Carbon results for South Ayrshire Council housing stock
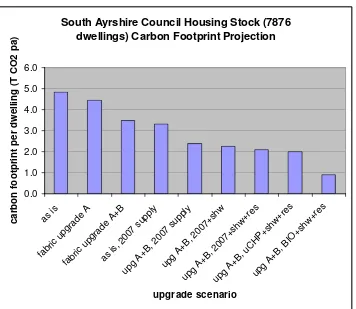
The results show the current carbon footprint per dwelling to be 4.9 tonnes of carbon dioxide per year while future scenarios are presented with emissions below 1 tonne. The chart below
illustrates the impact of each of the building fabric and energy supply technology upgrade scenarios on the carbon footprint. The table shows the results broken out by dwelling category. Some observations can be made for specific property types. One observation for top flats is that the impact of the solar hot water heating system appears relatively small at around 10%. If we look in more detail the solar hot water heating does provide a saving of around 30% of the annual water heating requirements and this percentage could be further increased by reducing hot water demands. The mid floor flat results show that no renewable energy options were considered applicable in this case. The mid floor flats have a high proportion of electrical heating (around 50%). For these electrically heated mid flats an option would be to replace the electric heating with a community CHP system fired by gas or a community heating system fired by a wood boiler. Mid floor flats are typically found in higher density developments where these community systems have most benefit.
The carbon footprint for each scenario has also been quantified in terms of the number of commercial scale wind turbines that would be required to offset the emissions of the housing stock and achieve carbon neutrality. The number of commercial turbines required to offset the current emissions is 17 while in the best future scenario this can be reduced to 3. These
calculations have been based on the proposed wind farm on Eaglesham Moor in the South West of Scotland close to South Ayrshire. The commercial wind turbine calculations here assume that grid electricity from the current generation mix (coal, gas, nuclear) is displaced by the wind generated electricity and that the carbon saving achieved by displacing grid electricity is 0.422 kgCO2 /kWh. BWEA and Government press releases [13,14] assume that coal fired electricity is
Fig 2. Chart showing carbon footprint for each of the upgrade scenarios
South Ayrshire Council Housing Stock (7876 dwellings) Carbon Footprint Projection
0.0 1.0 2.0 3.0 4.0 5.0 6.0
as is
fabr ic u
pgra de A
fabr ic u
pgra de A
+B
as is , 200
7 su pply
upg A+B
, 200 7 su
pply
upg A+B
, 200 7+sh
w
upg A+B
, 200 7+sh
w+r es
upg A+B
, uC HP+
shw +res
upg A+B
, BIO +shw +res upgrade scenario c a rb o n f o o tp ri n t p e r d w e ll in g ( T C O 2 p a )
Table 1. Carbon footprint by dwelling type for each of the upgrade scenarios
T CO2 per annum per dwelling
sdet sdet mt mt flat(T) flat(T) flat(G) flat(G) flat(M) ave
scenario non trad trad non trad trad non trad trad non trad trad
as is 6.9 6.9 5.0 4.9 4.1 4.1 4.5 4.9 3.6 4.9
fabric upgrade A 6.5 6.1 4.7 4.4 4.1 3.8 4.4 4.3 3.5 4.5
fabric upgrade A+B 4.7 4.7 3.6 3.6 3.1 3.1 3.2 3.4 2.9 3.5
as is, 2007 supply 4.0 4.0 3.7 3.6 3.0 3.0 3.2 3.5 2.5 3.4
upg A+B, 2007 supply 2.8 2.8 2.6 2.6 2.2 2.2 2.3 2.4 2.0 2.4
upg A+B, 2007+shw 2.6 2.6 2.4 2.4 2.0 2.0 2.3 2.4 2.0 2.3
upg A+B, 2007+shw+res 2.4 2.4 2.2 2.2 1.7 1.7 2.3 2.4 2.0 2.1
upg A+B, uCHP+shw+res 2.3 2.3 2.1 2.1 1.6 1.6 2.2 2.3 1.9 2.0
upg A+B, BIO+shw+res 1.0 1.1 0.9 0.9 0.7 0.7 1.0 1.1 0.9 0.9
Quantity of properties: 258 1029 970 978 625 1212 697 1253 754 7776
It should be noted that the results given here are the operational carbon emissions and do not include the carbon emissions associated with implementing the upgrade measures. Several studies have shown that the operational emissions far outweigh the emissions associated with
construction or upgrading of buildings [13].
[image:5.612.89.511.455.584.2]6. Conclusion
The work presented here quantifies the carbon footprint of the South Ayrshire Council housing stock and provides analysis of future energy options. The Councils property is already being managed from an energy perspective and has been significantly improved through cavity wall insulation, double glazing etc. The current carbon footprint per dwelling is 4.9 tonnes of carbon dioxide per year while future options are presented with emissions below 1 tonne. The options presented here are intended to provide a strategic overview of the contributions different upgrades can make to reducing carbon emissions and improving fuel costs and comfort conditions. The carbon footprint for each scenario is quantified in terms of the number of commercial scale wind turbines that would be required to offset the carbon emissions from the stock. The model and toolset can be used to examine alternative options or analyse in more detail than is shown here.
References
[1] The Governments Standard Assessment Procedure for Energy Rating of Dwellings, 2005, BRE. [2] Clarke J.A, Energy and Buildings 36 (2004), 759-770
[3] Scottish House Condition Survey, 2003, http:// www.shcs.gov.uk/ [4] BRE, Domestic Energy Fact File, 2003, http:// projects.bre.co.uk/ factfile/ [5] UK Market Transformation Program, http://www.mtprog.com/
[6] THERMIE project BU/0127/97 title ‘Cost Efficient Passive Houses as European Standards’ (CEPHEUS), www.cepheus.de
[7] UKCIP Climate projections, http://www.ukcip.org.uk/scenarios/ukcip_data/ [8] BRE, 2003, Ecohomes 2003, issue1.1, www.bre.co.uk/Ecohomes
[9] South Ayrshire Council housing energy database, emailed by Edgar B. 17th Jan 2006. [10] www.est.org.uk/bestpractice
[11] RURASU WP3.2, Project Report, April 2006. [12] www.sbsa.gov.uk
[13] Lazarus N, BedZED, Construction Materials Report, Toolkit for carbon neutral developments–part 1, BioRegional, DTI
[14] Allan Wilson, Deputy Enterprise Minister, BBC News 27th April 2006.