EU Cohesion policy 2007-13
& the implications for Spain:
Who gets what, when and how?
Douglas Yuill, Carlos Méndez and Fiona Wishlade
June 2006
European Policy Research Paper
Number 59
Published by:
European Policies Research Centre
Universit y of St rat hclyde 40 George St reet
Glasgow G1 1QE Unit ed Kingdom
European Policies Research Centre
Universit y of St rat hclyde 40 George St reet
Glasgow G1 1QE Unit ed Kingdom
Tel: +44 141 548 3222 Fax: +44 141 548 4898
Aut hor email: douglas.yuill@st rat h.ac.uk
Acknowledgements
This report is one of t he out put s of a research proj ect support ed by t he Instit ut e of Fiscal St udies in Spain. The proj ect , ent it led ‘ Implicat ions of Cohesion Policy Reform for Spain’ , was undertaken by Douglas Yuill, Carlos Méndez and Fiona Wishlade of t he European Policies Research Cent re, Universit y of St rat hclyde, Glasgow and by Encarnación Murillo and María-Jesús Delgado of the Universidad Rey Juan Carlos, Madrid. The authors are very grat eful to Encarnación Murillo and María Jesús Delgado for t heir collaborat ion on t he proj ect and t o t he Inst it ut e of Fiscal St udies for t heir financial support . They would also like t o express t heir t hanks t o EPRC’ s EoRPA Regional Policy Research Consort ium which provides core funding for t he Cent re’ s ongoing regional policy research. That having been said, t he views expressed are solely t hose of t he aut hors.
Douglas Yuill Carlos Méndez Fiona Wishlade
ABSTRACT
The recent negot iat ion of t he EU budget and t he associat ed reform of EU Cohesion policy have had maj or policy implications for Spain, t he count ry in receipt of most Cohesion policy support in the current programming period (2000-06). EU enlargement , combined with relat ively rapid growt h in Spain, impact ed on t he eligibilit y of Spanish regions for Cohesion support while also taking t he count ry as a whole beyond t he eligibilit y t hreshold for t he Cohesion Fund. As a result, based on t he original Commission budget proposals of February 2004, Spain was facing a reduced Cohesion policy budget of at least a half (t o below €30 billion). This paper first reviews t he budget negotiat ions from a Spanish (Cohesion policy) perspect ive, ident ifying t he key negot iating goals and t he ext ent t o which t hey were achieved. It t hen looks at t he out come of t he negot iat ions for Spain, init ially at t he nat ional level and t hen in t he regions. It highlight s t he significant different ial impact s of t he cut backs in Cohesion policy allocations at t he regional level and t he pressures on t he Spanish government t o modulat e t he regional impact of t he budget ary changes.
EU Cohesion policy 2007-13 & the implications
for Spain: Who gets what, when and how?
1. INTRODUCTION ... 1
1.1 Set t ing t he agenda ... 1
1.2 The Commission’ s reform proposals... 1
1.3 The st ruct ure of t he paper ... 3
2. NEGOTIATING THE BUDGET ... 4
2.1 The Spanish negot iat ing posit ion on Cohesion policy funding... 4
2.2 Background t o t he Spanish negot iat ing posit ion ... 5
2.3 The negot iat ion process and out comes: t he EU budget as a whole ... 9
2.4 The negot iat ion process and out comes: Cohesion policy ... 12
2.5 Implicat ions for Spain ... 19
3. COHESION POLICY – NATIONAL AND REGIONAL OUTCOMES ... 20
3.1 Overall Cohesion policy allocations ... 20
3.2 Obj ective 1 / Convergence ... 22
3.3 Cohesion Fund ... 23
3.4 Out ermost regions... 24
3.5 Regional Compet it iveness and Employment ... 25
3.6 Regional-level implications of Cohesion policy reform... 27
3.7 Implicat ions for Spain ... 32
4. NEGOTIATING THE REGULATIONS ... 34
4.1 Obj ectives and general rules on assistance (Tit le I) ... 34
4.2 St rat egic approach t o cohesion (Tit le II) ... 36
4.3 Programming (Tit le III) ... 37
4.4 Effectiveness (Tit le IV) ... 38
4.5 Financial cont ribut ion by t he Funds (Title V)... 39
4.6 Management , monitoring and cont rols (Tit le VI) ... 40
4.7 Financial management (Tit le VII) ... 41
4.8 Implicat ions for Spain ... 43
5. POLICY AND INSTITUTIONAL IMPACTS... 45
5.1 Regional views on t he budget ary and regulat ory frameworks ... 45
5.2 Implement ing t he new regulat ions: t he Nat ional Strat egic Reference Framework. 52 5.3 Implement ing t he new regulat ions: Operat ional Programmes... 60
5.4 Implicat ions for Spain ... 69
EU Cohesion policy 2007-13 & the implications
for Spain: Who gets what, when and how?
1.
INTRODUCTION
1.1
Setting the agenda
The debat e on t he fut ure Cohesion policy for t he post 2006 period was launched wit h t he publication of the Commission’ s Second Report on Economic and Social Cohesion in January 2001. The Spanish government was t he first Member St at e t o formally react, expressing it s concerns in a let t er sent t o t he Commission President , Romano Prodi, in April 2001.1 The let t er, known as t he ‘ Aznar Memorandum’ , raised the issue of the “ statist ical effect ” of enlargement and, cont roversially, linked accession negot iat ions wit h guarant ees over fut ure receipt s of St ruct ural Funds for t he exist ing Member St at es
Alt hough t he at t empt t o link enlargement wit h t he reform of t he St ruct ural Funds was considered unaccept able by t he Commission and most Member Stat es, t he Spanish government reit erat ed its concerns in the Second Cohesion Policy Forum (May 2001) and t he informal Minist erial Meet ing of EU Regional Policy Minist ers (July 2001) which provided t he first opport unit y for t he Member Stat es t o express general views on fut ure Cohesion policy reform. Wit h t he onset of t he Spanish Presidency in t he first half of 2002, more detailed exchanges of views bet ween t he Member St at es were held in t he Council’ s St ruct ural Affairs Working Group, on t he basis of t he Commission’ s First Progress Report on Economic and Social Cohesion published in February 2002.
A maj orit y of Member St at es subsequent ly submit t ed t heir formal posit ions over t he course of t he next year,2 whilst Commission t hinking was furt her developed in t he Second Progress Report on Economic and Social Cohesion (February 2003). The Commission’ s thought s were examined by t he Member St at es t hrough t he St ruct ural Affairs Working Group and, at a higher polit ical level, at t he informal Minist erial meet ing for Regional Policy Minist ers under t he Greek Presidency (May 2003). The Commission published it s overall budget proposals for t he 2007-13 period in February 2004, closely followed by t he Third Cohesion Report which provided more informat ion on t he proposed Cohesion policy.
1.2
The Commission’s reform proposals
Following on from t his, t he Commission’ s legislat ive proposals relat ing t o Cohesion policy were formally submit t ed in July 2004 in t he form of one general regulat ion,3 three specific
1 Regional Policy and Enlargement , Memorandum by t he Spanish Government t o t he European Commission, 19 April 2001.
2 Netherlands (April 2002), Italy (December 2002), France (January 2003), Greece and United Kingdom (March 2003), and Belgium, Denmark, Sweden and Finland (May 2003).
regulat ions covering each of t he funds,4 and a specific regulat ion for a new inst rument for managing cross-border cooperat ion.5 The main aims were t o make EU Cohesion policy more st rat egic (focussed on t he Lisbon and Got henburg agendas including annual dialogue in t he Council of Minist ers), more concent rated (bot h geographically on t he least favoured regions and t hematically on t he Lisbon and Got henburg t hemes) and more decent ralised (wit h simpler, more t ransparent and more efficient delivery mechanisms). A number of import ant changes were proposed, including a broader rat ionale for policy; a new archit ect ure of Communit y priorit ies; and a different implement at ion syst em.
In t erms of t he new policy rationale, a key change is t he emphasis on the Lisbon and Got henburg agendas, wit h fut ure policy priorities anchored in t he t hemes of innovation and t he knowledge economy (to promot e compet itiveness), environment and risk prevent ion (to address sustainable development ), as well as labour market support (t o improve t he adaptabilit y of t he workforce t o changing circumstances in line wit h t he European Employment St rat egy). For t he first t ime, ‘ t errit orial cohesion’ received significant at t ent ion, building on t he philosophy of t he Second Cohesion Report and t he commitment in t he draft (and rej ect ed) EU Const it ut ion ‘ t o promot e economic, social and t erritorial cohesion and solidarit y among Member St at es’ . In t his cont ext , t he remit of EU Cohesion policy has been widened t o address issues such as urban development , infrast ruct ure endowment in educational, healt h and social services, and t he specific problems of areas wit h geographical handicaps (e.g. islands, mount ains, border regions).
Under t he ‘ new archit ecture’ for EU Cohesion policy, t he current Obj ect ives 1, 2 and 3 will be replaced by t hree new Community obj ect ives: Convergence; Regional Compet itiveness and Employment ; and European Territorial Cooperat ion. The current inst rument s linked to rural development policy (EAGGF Guidance Section, FIFG) are t o be grouped wit hin one single instrument under t he Common Agricult ural Policy (EAFRD) and the Communit y Init iat ives (INTERREG, URBAN, EQUAL, LEADER+) will be discont inued as separate init iatives and int egrated wit hin t he mainstream programmes. The creat ion of a specific legal inst rument t o facilit at e cross border cooperation has also been proposed.
The aim of t he Convergence Obj ective (previously Obj ect ive 1) is to support growt h and j ob creation in the least developed regions, principally in t he new Member St at es. The ERDF and ESF will provide support for investing in human and physical capit al; innovat ion and t he knowledge economy; encouraging adapt at ion t o socioeconomic change; protect ion of t he environment ; and improving administ rat ive efficiency. This obj ect ive may also be funded t hrough t he Cohesion Fund. As in t he past , t he Cohesion Fund will continue to place a st rong emphasis on support ing Trans-European t ransport net works, proj ect s of European int erest and environmental infrast ructure. The main proposed innovation is t o increase t he scope for assist ance wit h a st ronger focus on sustainable development and t he
environmental dimension (e.g. support ing energy efficiency or renewable energy). Convergence Obj ective eligibilit y will cont inue to be based on GDP (PPS) per head of less t han 75 percent of t he EU average in NUTS II regions. Phase-out and Out ermost regions will also be included under t his Obj ect ive.
The Regional Compet itiveness and Employment Obj ect ive aims t o ant icipat e and promote change t hrough a t wo-fold approach. Regional ERDF-funded programmes will seek t o improve t he compet it iveness of indust rial, urban and rural areas, while nat ional (or t errit orial where appropriat e) ESF-funded programmes will support t he int roduction and implement ation of st ruct ural reforms in t he labour market and st rengt hen social inclusion in line wit h t he priorit ies of t he European Employment St rat egy. A key change is t hat all regions outside t he Convergence Obj ect ive will be eligible for support . Unlike t he previous period, Member St at es will have full freedom to det ermine t he list of regions at eit her NUTS I or II level t hat will be included under t he Obj ective. There is no requirement t o meet specific national or EU t erritorial crit eria t o det ermine eligibilit y and zoning will no longer apply. However, t he appropriate balance bet ween geographical and ot her forms of concent rat ion in drawing-up Regional Compet itiveness programmes will be developed in part nership wit h t he Commission. Phase-in (“ nat ural growt h” ) regions will also be included wit hin t his Obj ect ive.
The Territ orial Cooperat ion Obj ect ive will seek to promot e t he harmonious and balanced development of t he Union t erritory, building on the previous INTERREG programme. The current Communit y Init iat ives will, as already ment ioned, be int egrat ed wit hin t he mainst ream programmes. In addit ion t o st rengt hening t errit orial cooperat ion, t he Commission has proposed t he creation of a single legal inst rument t o enable t he Member St at es and sub-nat ional aut horit ies t o manage cross-border programmes more effect ively. Eligibilit y will be det ermined by int ernal land borders and cert ain ext ernal borders including some regions lying on sea borders.
The Commission is also proposing to make significant changes t o t he way t hat EU Cohesion policy is implement ed. The key principles underlying t he St ruct ural Funds – mult i-annual planning, integrat ed development strat egies, part nership, co-financing and concent rat ion – will cont inue; however, t he proposals aim t o simplify and decent ralise t he process furt her. The main feat ures of the proposals are: a new planning framework; one fund per programme; rat ionalised and decent ralised procedures for financial management , cont rol and addit ionalit y; an enhanced partnership principle; a more rigorous approach to monit oring; and more result s-orient ed and flexible evaluat ion.
1.3
The structure of the paper
3). It t hen moves on to review t he development of t he St ruct ural Funds regulat ions (in Sect ion 4) and t heir policy and institut ional impact s (Sect ion 5). Each sect ion ends by discussing some implications for Spain. Sect ion 6 t hen draws t oget her t hese concluding comments in a brief review of t he overall implicat ions for Spain of t he Cohesion policy reform process.
2.
NEGOTIATING THE BUDGET
2.1
The Spanish negotiating position on Cohesion policy funding
The overarching obj ect ive for Spain in t he negot iat ion of t he 2007-13 Financial Perspectives was to ensure a posit ive net balance over t he whole of t he period by minimising t he sharpness of t he decline in it s budget ary posit ion as far as possible. Cent ral to t he pursuit of t his negot iat ing goal was t he need t o increase Spain’ s relative posit ion in EU expendit ure policies (especially t hrough Cohesion policy since, in pract ice, fut ure CAP resources had already been fixed in 2002) and, on the income side, to minimise it s contribution to the EU’ s own resources (an issue closely t ied t o t he fut ure of t he UK rebat e).
The first public st at ement of Spain’ s formal negot iating posit ion on t he financial aspect s of Cohesion Policy (and t he wider EU budget ) was provided by t he Minist er for Economy and Finance, Pedro Solbes, in a parliament ary plenary session in November 2004.6 Underlying t he government ’ s posit ion was t he view t hat “ Cohesion policy remains a core EU policy, as recognised in t he draft Const it ut ion and Treaties, and t hat , for bot h polit ical and economic reasons, it should be allocat ed an adequat e level of resources.” Whilst acknowledging t hat t he policy should be made more effect ive, t he Spanish posit ion was t hat it should not be “ reduced t o a minimum token gest ure” . More specifically, t he main financial obj ectives for Spain in t he negot iat ions were:7
• Cohesion Fund: A t ransition period for t he Cohesion Fund.
• Statistical effect (Phase-out) regions: Regions affect ed by t he st at istical effect should be t reat ed similarly or close to Convergence regions – t hat is, t hose regions below 75 percent of EU GDP (PPS) per capit a.
• Growth (Phase-in) regions: Regions t hat have risen above t he 75 percent t hreshold should receive a similar percent age of resources as t hose in a similar sit uat ion during t he current programming period. The region of Cant abria, currently an Obj ective 1 Phase-out region, should also be included wit hin t his cat egory.
• Regional Competitiveness and Employment priority: The Spanish posit ion was in favour of t he Regional Compet itiveness and Employment Obj ect ive, unlike some of t he net cont ribut or count ries (such as the Unit ed Kingdom) which wished t o see EU Cohesion policy focused on t he poorest Member St ates.
6 Congreso de los Diputados (2004) Pleno y Diputación Permanente, Año 2004, VIII Legislatura, Núm. 51, Sesión plenaria núm. 47, celebrada el miércoles, 24 de noviembre de 2004
• Outermost regions: Spain had in t he past argued and cont inued t o argue t hat t he t reat ment of t he Canary Islands should be improved under t he Special Fund for t he Out ermost Regions, so t hat t he Canarias region receives a comparable level of support as Convergence Obj ect ive regions.
• Other areas: Spain wished t o see bet t er t reatment for cit ies and areas wit h geographical handicaps, such as Ceut a and Melilla, islands and areas with low populat ion densit y.
• Also of not e, under Heading 1a of the EU budget (Competitiveness), Spain sought the application of crit eria which would favour a more equal dist ribution of resources.
2.2
Background to the Spanish negotiating position
In considering t he issues of special relevance t o Spain in t he negot iat ions, it is useful t o review current allocat ions of EU expendit ure by Member St ate, since t his obviously impacts on Member St at e views of which budget ary headings are of particular benefit. Informat ion on EU spending is published each year by DG Budget .8 An overview of allocat ed expendit ure across t he EU15 count ries by main heading (ie agricult ure, struct ural actions, int ernal policies, plus administ rative expendit ure) is provided in Figure 1. The dat a are 2000-03 averages of the percentages for t he four years under review. For comparison purposes, t he dist ribut ion of population by EU15 Member St at e is also shown (2002 dat a).
Figure 1 underlines t he current import ance t o Spain of funding under t he st ruct ural act ions heading (t hat is, EU Cohesion policy). Over t he 2000-03 period, Spain was t he main beneficiary of EU Cohesion policy funding, receiving 30 percent of t ot al EU funding. With Cohesion policy account ing for j ust over one-t hird of t ot al allocated expendit ure across t he EU, more t han half Spain’ s allocat ed expendit ure bet ween 2000 and 2003 t ook t he form of Cohesion policy funding, well ahead of agricult ure (44 percent of t he allocat ed t ot al for Spain). By comparison, expendit ure allocat ed to Spain wit h respect to other (int ernal) policies was low (j ust 6 percent of t he EU15 t otal) while administ rat ive allocations were very low (less t han 1 percent ).
8 The latest publication was made available in September 2005 at
Figure 1: Operating Expenditure by Heading and Member State 2000-03 (% EU15 total)
Agriculture
Structural actions
Internal policies
Total
allocated Admin
Overall total
2002 population (% EU15)
BE 2.28 0.89 12.08 2.49 56.75 5.50 2.72
DK 2.87 0.32 2.91 1.98 1.00 1.93 1.41
DE 14.26 14.46 17.29 14.54 3.48 13.93 21.68
EL 6.25 9.46 3.43 7.15 0.47 6.78 2.89
ES 14.19 30.02 6.19 18.99 0.82 17.98 10.66
FR 22.63 7.04 13.16 16.56 8.23 16.10 16.10
IE 4.09 2.79 1.63 3.46 0.74 3.31 1.03
IT 12.64 13.64 11.09 12.98 2.84 12.42 15.02
LU 0.08 0.03 1.57 0.17 19.51 1.24 0.12
NL 3.02 0.94 6.05 2.51 1.19 2.44 4.24
AT 2.53 0.93 2.96 2.01 0.37 1.92 2.12
PT 1.86 10.87 2.57 5.03 0.33 4.77 2.73
FI 1.92 1.11 2.17 1.67 0.49 1.60 1.37
SE 1.92 0.96 3.18 1.68 0.52 1.61 2.35
UK 9.48 6.55 13.71 8.79 3.25 8.48 15.57
EU 100.0 100.0 100.0 100.0 100.0 100.0 100.0 Operating expenditure as a percentage of total allocated operating expenditure
EU 58.2 34.7 7.1 100.0 5.9 105.9
Source: EPRC calculations from European Commission, Allocat ion of 2003 EU operat ing expendit ure by Member St at e, DG Budget , Sept ember 2004.
The expendit ure outcomes in Figure 1 reflect t he Cohesion policy commit ment appropriat ions agreed at t he 1999 Berlin European Council (see Figure 2). Spain was t he largest beneficiary of t he 2000-06 struct ural actions budget , account ing for almost 27 percent of t ot al commitment appropriations. Of part icular not e is t he import ance of Obj ective 1 funding t o Spain, amount ing t o almost 70 percent of t he Spanish st ruct ural act ions budget . The Cohesion Fund is also of obvious significance, represent ing j ust over one-fift h of the Spanish Cohesion policy commitment appropriat ions.
Figure 2: Commitment Appropriations under Structural Actions 2000-06 (€ millions, 2004 prices)
Heading Spain Heading as %
Spanish total
EU15 Spain as % of EU15
Objective 1 41672.4 69.5 140817.8 29.6
Objective 1 phase-out 388.6 0.6 9286.4 4.2
Objective 2 2818.7 4.7 21786.8 12.9
Objective 2 phase-out 108.2 0.2 3004.2 3.6
Objective 3 2362.7 3.9 26553.1 8.9
FIFG (ex Obj ective 1) 220.8 0.4 1221.1 18.1
Cohesion Fund 12357.0 20.2 19717.0 62.7
Total 59928.5 100.0 222386.5 26.9
[image:14.595.82.513.595.750.2]In t he years since t he 2000-06 budget allocations were agreed, both Spain and the European Union have changed significant ly. Not only has Spain been growing rapidly (impact ing on bot h nat ional and regional eligibilit y for Cohesion policy support ) but t he EU has expanded t o 25 Member St at es. Wit h all t he new members poorer t han Spain, set t ing t raditional eligibilit y t hresholds in t erms of EU25 rat her t han EU15 averages significantly “ raised t he bar” for t he EU15 Member St at es (t he so-called “ st at istical effect ” ).9 The very different posit ion of Spain in Cohesion policy eligibilit y t erms is shown in Figure 3. There has been a maj or reduction in t he proport ion of t he populat ion locat ed in regions qualifying for t he highest level of Cohesion policy support (Obj ect ive 1 in 2000-06, t he Convergence priorit y for 2007-13), down from 58.5 percent t o 31.8 percent (Galicia, Castilla–la Mancha, Ext remadura, Andalucía). Relat ed, regions covered by t ransitional provisions have grown markedly in import ance. The Phase-out regions, those impact ed by t he st at ist ical effect (Ast urias, Murcia, Ceut a and Melilla), account for almost 6 percent of t he Spanish populat ion for t he 2007-13 period, while t he Phase-in regions, t hose which no longer qualify as Convergence regions due t o t heir growt h, represent more t han one-fift h of t he national populat ion (Cast illa-León, Comunidad Valenciana and Canarias). Consequent ly, t he funding accorded t o such t ransit ional regions was an obvious Spanish priorit y in t he negot iat ions. Also important , given it s current significance, was the fat e of t he Cohesion Fund in Spain. Wit h GNI (PPS) per head of over 93 percent of t he EU25 average (2001-03),10 Spain lost out on Cohesion Fund eligibilit y due t o enlargement . Finally, funding for t he Outermost regions remained a significant issue, t he more so since, as already not ed, Canarias did not meet the 75 percent Convergence region eligibilit y t hreshold post 2006.
9 Set t ing t he eligibilit y t hreshold for Convergence funding at 75 percent of t he EU25 GDP (PPS) per head average is equivalent t o an 82.2 percent t hreshold in EU15 t erms.
Figure 3: Objective 1/ Convergence, Phase-Out and Phase-In Coverage (% of population)
2000-06 2007-13
Objective 1 Phase-out Convergence Phase-out Phase-in
EU25 34.5 2.9 27.3 3.6 4.0
EU15 22.4 3.5 14.5 4.3 4.1
NMS10 96.7 0.0 92.9 0.0 3.8
Belgium 12.7 12.4 0.0
Czech Rep 88.6 0.0 88.6 0.0 0.0
Denmark
Germany 17.3 1.6 12.5 6.1
Estonia 100 100.0
Greece 100 36.6 55.5 7.8
Spain 58.5 1.3 31.8 5.8 20.7
France 2.7 1.9 2.9
Ireland 26.6 73.4 26.5
Italy 33.6 0.6 29.2 1.0 2.9
Cyprus
Latvia 100 100.0
Lithuania 100 100.0
Luxembourg
Hungary 100.0 72.2 27.8
Malta 100.0 100.0
Netherlands 1.8
Austria 3.4 3.4
Poland 100.0 100.0
Portugal 66.6 33.4 67.8 3.8 2.3
Slovenia 100.0 100.0
Slovak Rep 88.9 88.9
Finland 21.0 13.0
Sweden 11.0
UK 8.6 3.5 4.0 0.6 4.4
Source: EPRC calculations
2.3
The negotiation process and outcomes: the EU budget as a whole
The process of negot iating t he EU budget was lengt hy. Init ial Commission proposals regarding t he next Financial Perspect ive (2007-13) were published in February 2004.11 The assumptions underpinning t hese proposals (and t heir implicat ions) were t hen discussed and developed in t he Friends of t he Presidency Group on t he Financial Perspect ives which, in the course of the next year, considered almost 100 technical documents (fiches) produced by t he Commission.12 A progress report in March 200513 summarised t he work of t he Group, t he clarifications achieved and t he developing posit ions on certain issues. Four days lat er, following t he approach adopt ed in t he run-up t o t he 1999 Berlin European Council, a first Negot iating Box was produced by t he Luxembourg Presidency.14 This was “ designed to provide a solid framework and give focus and moment um t o t he discussions”15 by distinguishing bet ween areas (in normal t ypeface) where t here was a degree of agreement (at least at t he level of principles) and problem areas (in italics) which remained t o be progressed. Four furt her Negot iat ing Boxes were considered in April, May and June.16 Areas of disagreement were narrowed and budget ary ranges became proposed figures. A final set of proposals was made in t he last st ages of t he European Council on 17 June.17 However, t he proposals did not receive t he required unanimous approval of t he Member St at es. Three of t he main net cont ributors – t he United Kingdom, Sweden and the Net herlands – rej ect ed t he package, as did, for different reasons, Finland and Spain. Spanish concerns cent red part icularly on t he net balance posit ion of t he count ry.18 Two ot her Member St at es – Denmark and It aly – abst ained.
Alt hough t he failure to reach agreement led t o considerable rancour in t he immediat e aft ermat h of t he European Council, t he Luxembourg Presidency felt t hat t he basis for an agreement had been creat ed.19 It argued t hat t he final out come would not be subst ant ially different from t he June Council proposal – “ a budget for commit ment appropriations representing 1.056% of nat ional wealt h and a budget for payment appropriations representing 1% of nat ional wealt h” . It placed t he blame for non-agreement mainly at t he door of t he net cont ributors - and, in part icular, t he Unit ed Kingdom for failing t o reduce it s rebat e sufficient ly t o allow t he demands of all net cont ributors t o be met . “ Ah, if only
11 European Commission,
Buil ding our common f ut ure. Pol icy chal l enges and budget ary means of t he enl arged Union 2007-2013, COM(2004) 101 final, 10 February 2004
12 See t he Temporary Commit t ee on Policy Challenges and Budget ary Means of t he Enlarged Union 2007-2013 at http:/ / www.europarl.europa.eu/ comparl/ tempcom/ finp/ default_en.htm
13 CADREFIN 35 of 4 March 2005 (6825/ 1/ 05 REV 1) 14 CADREFIN 43 of 8 March 2005 (7054/ 05). 15 Ibid, para 2.
16 CADREFIN 84 of 21 April 2005 (8292/ 05), CADREFIN 108 of 19 May 2005 (9065/ 05), CADREFIN 115 of 2 June 2005 (9637/ 05) and CADREFIN 130 of 15 June 2005 (10090/ 05)
17 In the form of an addendum to CADREFIN 130 on 17 June 2005 (10090/ 05, ADD 1).
18 For a more det ailed discussion of t he Spanish posit ion on t he Luxembourg presidency negot iat ions see: Navarro, A and Viguera, D (2005) ‘ España y las perspectivas financieras de la UE’ , Política Exterior, No.106, July/ August 2005.
t hose six, who t oget her, on a day of inspirat ion wrot e a let t er, had agreed on t he det ail of t heir proposals!”20
Wit h t he fut ure of t he UK rebat e at t he heart of t he disagreement , t he Unit ed Kingdom Presidency delayed producing a furt her Negotiat ing Box unt il t en days before t he December European Council.21 This left t he result s of t he June negot iat ions unchanged as t hey relat ed t o t he EU15, and t ried t o sat isfy t he net cont ribut ors by reducing t he expendit ure flowing t o t he new Member St at es by over 8 percent. By way of “ compensat ion” , various concessions were made to t he new Member St at es t o ease t heir absorption of EU spending (by, for inst ance, increasing t he co-financing rat e from 80 percent t o 85 percent , set ting t he aut omatic decommitment rule at n+3 rat her than n+2 for 2007-10 and making housing proj ects eligible for ERDF support ). As no doubt ant icipat ed by t he Presidency, t he proposals were not accept ed and, indeed, generat ed considerable adverse comment .22 Furt her concessions were made in a second UK Negot iating Box t o t ry to bring t he parties closer t o agreement .23 A final Negot iating Box was wit hheld unt il t he Presidency felt t hat agreement could be reached.24 This made more concessions all round. Expendit ure commit t ed under t he final set of proposals was 1.0459 percent of EU GNI compared to 1.03 percent under t he first UK Negot iat ing Box and 1.056 percent under t he 17 June proposals of t he Luxembourg Presidency. Also import ant t o t he final agreement were development s on t he revenue side of t he equat ion. The Unit ed Kingdom agreed t o reduce t he UK rebat e by up t o €10,500 million (an increase of €2,500 million compared t o the second UK Negot iating Box) and addit ional concessions were made t o Aust ria and, part icularly, t he Net herlands.
An overview of t he Financial Perspective at key stages of t he negot iat ions is set out in Figure 4. Compared t o the benchmark provided by 2006 expendit ure commitment s, t he init ial Commission proposal involved a much enhanced budget . An increase of almost a quart er was proposed in real t erms, taking commit ment appropriations close t o t he own resources ceiling for t he budget . A key feat ure of t he negotiat ions was t he at tempt by t he net contributors to st abilise average expendit ure levels at around prevailing levels, a maximum 1 percent of EU GNI. Early in t he debat e (December 2003), t he Group of Six25 made t his proposal in t he j oint let t er t o t he Commission President referred t o above.
20 Ibid. The Group of Six letter is discussed further below.
21 UK Presidency Website, European Union Financial Perspectives 2007-13, United Kingdom Presidency Negot iat ing Box available at http:/ / www.eu2005.gov.uk, 5 December 2005. Although t his may seem late in the day, it should be noted that the Luxembourg Presidency did not produce detailed figures unt il t he Fourt h Negot iat ing Box in early June.
22 The spokesman for t he Commission President (Johannes Lait enberger) comment ed: "You all know t he old st ory of Robin Hood and t he Sheriff of Not t ingham. The President has made it very clear t hat he does not expect t he Brit ish Presidency t o t ake t he role of t he Sheriff of Not t ingham, t aking from t he poor t o give t o t he rich." Quot ed on htt p:/ / news.bbc.co.uk/ 1/ hi/ uk_politics/ 4488164.stm, 6 December 2005
23 UK Presidency Website, European Union Financial Perspectives 2007-13, United Kingdom Presidency Negot iat ing Box available at http:/ / www.eu2005.gov.uk, 14 December 2005
24 Finally published as CADREFIN 268 of 19 December 2005 (15915/ 05).
Thereaft er, much of t he debat e concerned t he appropriat e level of expendit ure, coupled wit h relat ed argument s about t he UK rebat e, overall net balances and t he need t o review t he fut ure st ruct ure of t he budget . While t he final agreement set t he budget for commit ment appropriations above t he 1 percent t arget of t he Group of Six, payment appropriat ions were at this level while commitment appropriat ions in 2013 will be 1 percent of EU GNI.
Figure 4: Financial Perspective by Heading (€mn at 2004 prices)
Heading 2006 bench-mark As % EU total COM alloc’ns As % EU total Lux NB6 alloc’ns As % EU total UK NB3 alloc’ns As % EU total UK NB3 as % COM UK NB3 as % 2006 1 316764 38.2 463256 45.1 381604 43.8 379739 44.0 82.0 119.9
1a 53662 6.5 121685 11.8 72010 8.3 72120 8.4 59.3 134.4
1b 263102 31.8 341571 33.2 309594 35.5 307619 35.7 90.1 116.9
2 388486 46.9 400679 39.0 377801 43.3 371244 43.0 92.7 95.6
Of which:
agric 306145 37.0 301074 29.3 295105 33.9 293105 34.0 97.4 95.7
3 14049 1.7 20945 2.0 11000 1.3 10270 1.2 49.0 73.1
4 53613 6.5 84649 8.2 50010 5.7 50010 5.8 59.1 93.3
5 48013 5.8 57670 5.6 50300 5.8 50300 5.8 87.2 104.8
Comp 7287 0.9 800 0.1 800 0.1 800 0.1 100.0 11.0
Total 828212 100.0 1027999 100.0 871515 100.0 862363 100.0 83.9 104.1
GNI 75121480 82448058 82448058 82448058
% GNI 1.10 1.25 1.06 1.0459
Sources: The Commission allocat ions and relat ed 2006 dat a are drawn from Fiche 29 Rev1, as updat ed to t ake account of t he lat est available dat a, Fiche 17 and Fiche 92. The 2006 benchmark figures consist of 2006 commitment appropriat ions mult iplied by 7. The Luxembourg Presidency figures come from CADREFIN 130 of 15 June 2005 (10090/ 05), as amended and the UK Presidency data from CADREFIN 268 of 19 December 2005 (15915/ 05) Alt hough t he overall budget was much reduced compared t o t he original Commission proposal, t he key expendit ure headings for t he net recipients held up well during t he negot iat ions. The final Cohesion policy budget (Heading 1b) was cut by less t han 10 percent compared to t he overall fall in commit ment appropriations of more t han 16 percent . The allocat ions t o headings of less direct benefit t o net recipient s - Headings 1a (Compet it iveness), 3 (Internal policies) and 4 (EU as a global part ner) - were reduced by bet ween t wo-fift hs and a half. Of t he ot her headings, administ rat ion (Heading 5) was cut by almost 13 percent while spending on nat ural resources (Heading 2) fell by j ust over 7 percent . The agricult ural component of Heading 2 was largely unchanged in line wit h t he agreement reached at t he Oct ober 2002 European Council; t he decline recorded reflect ed t he inclusion of Bulgaria and Romania wit hin t he Oct ober 2002 ceilings.
proport ion of t he budget devot ed t o Cohesion policy increased. This is clearly in line wit h Spanish int erest s.
Figure 5: Commitment Allocations as a percent of the EU Total
0.0 5.0 10.0 15.0 20.0 25.0 30.0 35.0 40.0 45.0 50.0
Heading 1 Heading 1a Heading 1b Heading 2 Of which: agric Heading 3 Heading 4 Heading 5 FP headings
2006 benchmark Commission allocations Lux NB6 allocations UK NB3 allocations
Alt hough t he agreed budget was lower t han t he Spanish aut horit ies wished, it s st ruct ure met many of t he negotiat ing goals of Spain – in particular, t he relat ive import ance at t ached t o Headings 1b (Cohesion policy) and 2 (Nat ural resources) which, t oget her, account for almost 90 percent of commit ment appropriations. In addit ion, t he allocation of ext ra resources to Heading 3a (freedom securit y and j ust ice) to finance t he management of EU immigration - a proposal driven by t he Spanish Prime Minist er at t he Hampt on European Council meet ing - is also expect ed t o be of part icular benefit t o Spain given it s close proximit y t o Africa and t he acut e immigration challenges faced over recent years. While t he Compet it iveness heading (1a) grew in significance relative t o t he 2006 benchmark posit ion, it was much reduced from t he original Commission proposal. Moreover, in line wit h Spain’ s negotiat ing goals, “ ensuring balanced access for all Member St at es” was included in the allocation crit eria for the EU’ s research efforts alongside “ excellence” .26
2.4
The negotiation process and outcomes: Cohesion policy
Wit h respect t o Cohesion policy, a number of key issues had t o be resolved in t he course of t he negot iat ions: t he allocat ion of funding bet ween t he Convergence priorit y, t he Regional Compet itiveness and Employment priorit y and t he Territorial Cooperat ion priorit y; relat ed, t he split bet ween t he new Member St at es and t he EU15 (as det ermined primarily by t he level of absorpt ion capping applied to t he new Member St at es and t he assumed fut ure growt h rat es for t hese count ries); t he t ransitional provisions for regions losing t heir previous designat ed st at us (t he Phase-out regions under t he Convergence priorit y and t he
Phase-in regions under t he Regional Competit iveness and Employment priorit y); provisions relat ing t o t he Cohesion Fund (in particular, from a Spanish perspect ive, whet her t ransit ional provisions should apply t o count ries losing Cohesion Fund eligibilit y); and t he t reat ment of special geographic areas under t he Treat y – specifically, t he Out ermost regions (Canarias in t he Spanish context ) and regions of sparse populat ion (in t he Nordic Member St ates).
[image:21.595.91.504.231.492.2]An overview of Cohesion policy commitment appropriat ions at different st ages of t he budget negotiat ions is provided in Figure 6.
Figure 6: Cohesion Policy Commitment Appropriations 2007-13 (€mn at 2004 prices)
0 50000 100000 150000 200000 250000 300000 350000 400000 CON VERG ENCE P RIORI TY Conv ergenc e Phas e-out Cohe sion F
und OMR
REG C OMP&E
MPL PRI
ORITY Ph ase-in
Other
TERR COOP P
RIORIT Y
TOTA L
COM prop NB4 NB5 NB6 UKNB1 UKNB2 UKNB3
It can be seen t hat t he overall Cohesion policy budget init ially fell significant ly from t he Commission proposal (while remaining well above 2006 benchmark levels – see Figure 4). It recovered a lit t le in t he final phase of t he Luxembourg Presidency, was cut again in t he first UK Negot iat ing Box and t hen rose once more as special provisions were int roduced in response to count ry demands in t he last st age of t he negotiat ions. In global t erms, t here was relat ively lit t le difference between Cohesion policy funding under t he fourth Luxembourg Negot iating Box (€306,508 million) and the final agreement (€307,619 million). At t his level, t he budget was broadly midway bet ween t he 2006 benchmark figure (around €263,000 million) and t he original Commission proposal (over €341,000 million).
budget almost halved in t he course of t he negot iat ions (to €7,500 million). Under t his priorit y, by far t he great est st ress came t o be placed on cross-border cooperat ion. Second, funding for transit ional regions proved t o be relat ively robust during t he negot iat ions – especially t he budget for t he Phase-in regions which rose from €8,103 million in t he init ial Commission proposal t o €10,385 million. No other component of the Cohesion policy budget increased beyond t he original Commission proposal. As mentioned earlier, more t han one-fift h of t he Spanish populat ion is located in t his category of region (see Figure 3). Finally, Figure 6 shows t hat t he Cohesion Fund held up well during t he negotiat ions. This was at least in part due t o t he special t ransit ional provisions gained by Spain.
In short , Spain benefit ed from many of t he key developments during t he negotiat ions. This is underscored in t he sections which follow, where each of t he main negot iation issues from a Cohesion policy perspect ive are considered briefly in t urn. A final sect ion (Sect ion 2.5) draws toget her t he important points t o emerge from t he viewpoint of Spain.
2.4.1 Negot iat ion issues: allocat ions by priorit y
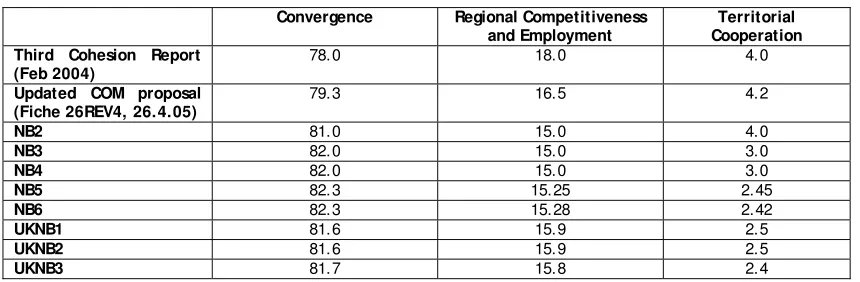
[image:22.595.83.513.496.637.2]A basic negotiat ion issue concerned t he budget ary split bet ween t he Convergence, Regional Compet itiveness and Employment , and Territorial Cooperation priorities. As shown in Figure 7, compared t o t he allocat ions proposed in t he Third Cohesion Report in February 2004,27 t here was, init ially, a significant shift away from t he Regional Competit iveness and Employment heading and t owards the Convergence priorit y. Then, as the negotiat ions became more int ense, it was t he Territ orial Cooperat ion priorit y which was squeezed as count ries impact ed by t he proposed Regional Compet itiveness and Employment cut backs sought t o rest ore t heir posit ion. Of part icular not e, a “ safet y net” was int roduced such t hat each Member St at e’ s share of t he Regional Competit iveness and Employment budget could not be less t han t hree quart ers of it s 2006 share of combined Obj ect ive 2 and 3 funding.
Figure 7: Changes in the Percentage Split between Convergence Priorities
Convergence Regional Competitiveness
and Employment
Territorial Cooperation Third Cohesion Report
(Feb 2004)
78.0 18.0 4.0
Updated COM proposal (Fiche 26REV4, 26.4.05)
79.3 16.5 4.2
NB2 81.0 15.0 4.0
NB3 82.0 15.0 3.0
NB4 82.0 15.0 3.0
NB5 82.3 15.25 2.45
NB6 82.3 15.28 2.42
UKNB1 81.6 15.9 2.5
UKNB2 81.6 15.9 2.5
UKNB3 81.7 15.8 2.4
27 European Commission, A New Part nership f or Cohesion: convergence, compet it iveness, cooperat ion, Third Report on Economic and Social Cohesion, February 2004, available at
2.4.2 Negot iat ion issues: t he absorpt ion cap on new Member St at es
[image:23.595.84.521.335.441.2]A related issue concerned t he division of t he Cohesion policy budget bet ween t he EU15 and t he new Member St at es. Under t he allocat ion met hodology, it was t he so-called Berlin met hod (as amended) which was t he basis for t he dist ribut ion of resources t o t he EU15. In cont rast , for t he new Member St at es, it was what became known as t he absorpt ion cap which mainly det ermined t he resources t hey received. The absorpt ion cap was originally int roduced under t he argument t hat there was a level (4 percent of GNI) beyond which it was difficult for Member St at es to absorb (ie effect ively ut ilise) EU resources. The impact of t he absorpt ion cap on individual Member Stat es varies since t his is dependent on assumed future growt h rat es by count ry. However, at a more general level, t he main developments are clear. As early as the first Negot iat ing Box, a side effect of capping was highlight ed: t he fact t hat it result ed in lower aid int ensit ies per head for poorer Member St at es (cont rary t o t he philosophy underpinning t he allocation met hodology). To counter t his, reduced capping levels were int roduced which were lower t he more prosperous t he Member St ate. Changes in t hese effect ive levels of capping are set out in Figure 8.
Figure 8: Changes in Effective Levels of Capping (as a percent of national GDP)
Country groups (as % EU25 GNI)
<40 40-45 45-50 50-55 55-60 60-65 65-70 70-75 + 5% pts
NB2 4.0 3.9 3.8 3.7 3.6 3.5 3.4 3.3 -0.1 %pt
NB3 4.0 3.9 3.9 3.8 3.7 3.6 3.5 3.4 -0.1 %pt
NB4 4.0 3.9 3.9 3.8 3.7 3.6 3.5 3.4 -0.1 %pt
NB5 4.0 3.9 3.9 3.8 3.7 3.6 3.5 3.4 -0.1 %pt
NB6 4.0 3.92 3.92 3.82 3.72 3.62 3.52 3.42 -0.1 %pt
UKNB1 3.663 3.590 3.590 3.498 3.407 3.315 3.223 3.132 -0.09 %pt
UKNB2 3.663 3.590 3.590 3.498 3.407 3.315 3.223 3.132 -0.09 %pt UKNB3 3.7893 3.7153 3.7153 3.6188 3.5240 3.4293 3.3346 3.2398 -0.09 %pt
Apart from an adj ustment bet ween t he second and third Negot iating Boxes which benefit ed all but t he poorest new Member St at es (Lat via, Est onia, Lit huania), the capping percent ages remained unchanged unt il t he final Luxembourg Negot iat ing Box (NB6), which saw a furt her (minor) increase. As already not ed, t he UK Presidency had t o reduce overall expendit ure (t o creat e budget ary space t o sat isfy t he net cont ribut ors) whilst t rying to avoid unravelling t he progress made under t he Luxembourg Presidency. It chose t o leave EU15 allocat ions unchanged while cutt ing back on new Member St at e receipt s via an 8.4 percent reduct ion in effect ive capping levels (see Figure 8). By way of compensat ion, and as mentioned earlier, a series of changes were made t o ease t he absorpt ion of Cohesion policy funding in t he new Member St ates: co-financing rat es were increased from 80 to 85 percent, the automatic n+2 decommit ment rule became n+3 for 2007 until 2010, and housing proj ect s became eligible for ERDF support . However, t hese “ off-budget ” concessions were not sufficient t o sat isfy t he new Member St ates. Accordingly, t he second UK Negotiat ing Box not only int roduced a furt her easing of regulat ory provisions,28 but also made specific additional Cohesion policy provision for Poland, Hungary, t he Czech Republic, Est onia and Lat via, while Slovakia and Lit huania received ext ra funding towards nuclear
decommissioning cost s.29 Finally, in t he last UK Negot iat ing Box, effect ive capping levels were increased by 3.4 percent , reducing t he capping-relat ed cut back t o j ust over 5 percent of t he final Luxembourg Presidency proposal (see Figure 8). In addit ion, t o achieve t he agreement of all t he new Member St ates, furt her addit ional support was provided to Poland (including a t ransfer of €100 million from Germany).
2.4.3 Negot iat ion issues: regions in t ransit ion
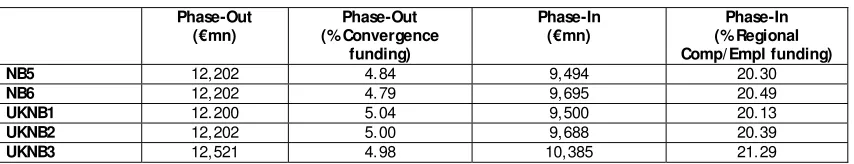
[image:24.595.87.514.514.596.2]Anot her import ant t opic in t he negot iat ions relat ed t o t he t reat ment of so-called t ransit ional regions – t hose areas losing t heir former designat ed st at us. The quest ion was raised as early as t he first Negotiating Box as to whet her t he proposed arrangements for t ransit ional regions (Phase-out and Phase-in) “ const it ut e an adequat e response t o t he issue of t ransit ion” .30 This issue was t aken forward in t he second Negotiating Box, wit h significant ext ra provision being made for t hose Member St ates (Greece and Germany) where at least one t hird of t he nat ional populat ion was locat ed in Phase-out regions. In t he same Negotiat ing Box, Spain benefited direct ly from t he decision t o provide t ransit ional support for count ries losing t heir Cohesion Fund st at us due t o t he st at ist ical effect (discussed furt her below). Over subsequent Negot iat ing Boxes, the allocat ions t o Phase-out and Phase-in regions were refined and were made explicit from t he fift h Luxembourg Negotiating Box onwards (see Figure 9). The increases recorded in t hese lat er st ages of t he negot iat ions mainly reflect additional provisions made t o Member St at es out side t he st andard allocat ion formulae. Thus, for inst ance, in the final UK Negot iat ing Box, additional funding of €1,400 million was made available t o Italy (of which €111 million relat ed t o Phase-out regions and €251 million t o Phase-in regions), €2,000 million t o Spain (of which €75 million was indicatively allocat ed t o Phase-out and €75 million to Phase-in) and €225 million to Germany (of which €58 million was Phase-out support ). These three count ries t hus accounted for all but €75 million of t he addit ional Phase-out support recorded in Figure 9.31
Figure 9: Changes in Phase-Out and Phase-In Funding
Phase-Out (€mn)
Phase-Out (% Convergence
funding)
Phase-In (€mn)
Phase-In (% Regional Comp/ Empl funding)
NB5 12,202 4.84 9,494 20.30
NB6 12,202 4.79 9,695 20.49
UKNB1 12.200 5.04 9,500 20.13
UKNB2 12,202 5.00 9,688 20.39
UKNB3 12,521 4.98 10,385 21.29
Note: The figures in t he first UK Negot iat ing Box (UKNB1) were in billions to one decimal point
29 Cyprus and Malta also benefited from specific feat ures of t he allocat ion met hodology (see para 47 and para 32(1) of t he final Negot iat ing Box). Only Slovenia was left out . However, Slovenia was anyway inclined t o accept t he proposals since it would have suffered significant ly had agreement been delayed and a later dataset been used.
30 CADREFIN 43 of 8 March 2005, para 33.
2.4.4 Negot iat ion issues: Cohesion Fund t ransit ional provisions
As already ment ioned, Spain benefit ed significant ly (and exclusively) from t he special t ransit ional provisions agreed t o help count ries “ phase-out ” from t he Cohesion Fund. There was no precedent for such an approach; Ireland lost Cohesion Fund st at us at t he end of 2003 wit hout any phase-out period. On t he ot her hand, t he int roduction of t ransitional provisions t ook cognisance of t he fact t hat t he Spanish loss of eligibilit y was not due t o growt h per se but rat her was at t ribut able t o t he st at ist ical effects of enlargement .
The proposal t hat t here should be t ransit ional provisions for t he Cohesion Fund was int roduced as early as t he second Negot iat ing Box. By t he fift h Negot iating Box, t he proposal was for a t wo-year t ransition, involving funding for Spain of €2,000 million, €1,200 million in 2007 and €800 million in 2008. However, in t he final hours of t he Luxembourg Presidency, t his was pushed up t o €2,800 million, spread over four years. The UK Presidency saw a furt her €450 million allocat ed. This took t he t ot al t ransitional allocation to €3,250 million, covering t he full 2007-13 period: €1,200 million in 2007; €850 million in 2008; €500 million in 2009; €250 million in 2010; €200 million in 2011; €150 million in 2012; and €100 million in 2013. This was a very significant allocat ion, represent ing around 10 percent of t he final Cohesion policy budget for Spain.
2.4.5 Negot iat ion issues: regions wit h specific charact erist ics
There were two ot her aspect s of t he Cohesion policy negot iat ions which were of part icular int erest to Spain. One concerned t he t reat ment of t he Out ermost regions (in t he Spanish cont ext , Canarias). As “ regions with specific charact eristics recognised under t he Treat ies” ,32 t he Out ermost regions were grouped t oget her for negot iat ion purposes wit h t he sparsely-populat ed areas of Finland and Sweden. It was under t he t hird Negot iating Box t hat specific additional provision was first made for such regions. The init ial proposal was t hat addit ional funding should be provided to t he value of €20 per inhabit ant per year – wort h €248.7 million to Canarias over t he 2007-13 period. The rat e of provision was subsequent ly raised to €30 per inhabit ant per year in t he fift h Negot iating Box (worth €374.5 million)33 and €35 per inhabit ant per year in t he sixt h Negot iating Box (€436.9 million).34 Canarias also benefit ed from furt her addit ional provision (€100 million) under t he final Negot iating Box of t he Luxembourg Presidency. In t ot al, t he ext ra €536.9 million awarded represent ed an increase of almost t hree-quart ers in t he Regional Competit iveness allocat ion t o Canarias; however, t his leaves per capit a aid levels for Canarias at only a lit tle over half Convergence region levels.
2.4.6 Negot iat ion issues: addit ional provisions
The last Cohesion policy element of t he negot iat ions involved a series of so-called “ addit ional provisions” . These were int roduced because t he general nat ure of t he
32 CADREFIN 108 of 19 May 2005, paras 32 and 33 33 CADREFIN 130 of 15 June 2005, para 44
allocat ion met hodology did “ not allow an adequat e response t o a number of obj ect ive sit uations” ,35 t hus leading to t he special t reatment of cert ain regions and count ries. Such provisions were part of the process of t rying to ensure t hat all Member Stat es were in a posit ion t o sign up t o t he negot iat ed agreement . They first appeared as a separat e heading in t he fift h Luxembourg Negot iat ing Box, increased by over €520 million in t he final June Negot iating Box and rose significant ly in bot h t he second and t hird UK Negotiat ing Boxes (by €1,350 million and €4,077 million respect ively - see Figure 10). From t he fifth Luxembourg Negot iating Box to t he final UK proposal, t hey grew by over €7,000 million as t he respect ive Presidencies st rove t o achieve an agreed solut ion.
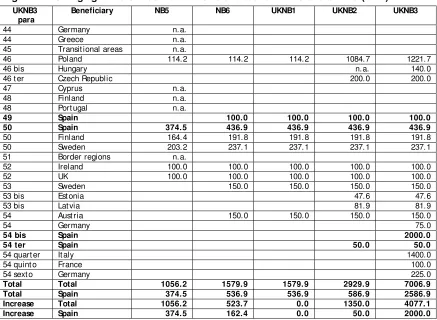
In discussing t he addit ional provisions, it should be not ed t hat t here is a degree of arbit rariness surrounding whet her part icular “ addit ions” are classified as being dist inct from t he general allocation mechanism. Thus, for inst ance, the t ransit ional provisions relat ing to t he Cohesion Fund (which, as has been not ed, were not part of t he t radit ional allocat ion mechanism and are of specific benefit to Spain) are not incorporat ed wit hin t he “ addit ional provisions” heading. On t he ot her hand, a number of ot her t ransit ion-relat ed adj ustment s are included: t he enhanced t reat ment accorded to Member St at es wit h at least one-t hird of t heir populat ion in Phase-out regions (para 44);36 t he t reat ment of regions which qualify for t ransit ional support but which were not eligible for 2000-06 Obj ective 1 funding (para 45); t he t reat ment of Cyprus, which was not an Obj ective 1 region from 2004-06 but which would have been had revised data been used (para 47); and t he t reat ment of It ä-Suomi and Madeira as if t hey were Phase-out regions when t hey have Phase-in st atus (para 48). In similar vein, t he provision t o increase funding under t he Territorial Cooperat ion priorit y by 50 percent for regions formerly on ext ernal borders (EU15/ EU12) or on EU25/ EU2 borders (para 51) covers a number of countries and could equally be viewed as part of t he allocation met hod for t he Territ orial Cooperation priorit y. Focusing on those additional provisions which can be readily quant ified (see Figure 10), it can be seen t hat Spain benefit ed significant ly. As already discussed, t here was additional funding for Canarias of €100 million (under para 49); t he already-ment ioned provision for t he Out ermost regions, wort h €436.9 million t o Canarias (para 50); t he previously-not ed additional allocation of €2,000 million under t he ERDF t o enhance Spanish R&D provision (para 54 bis); and a furt her €50 million for Ceuta and Melilla (para 54 t er). These addit ions t ot al €2,586.9 million, more t han 36 percent of the t ot al quant ified additional provisions (€7,006.9 million). Having said t hat , t here were ot her count ry-specific additions from which Spain did not benefit – including €4,070 million under t he rural development heading and €755 million (plus reduced rat es of VAT call) on t he revenue side of t he budget . Even so, once such addit ional allocat ions are t aken into account , Spain st ill did well in t erms of t hose addit ional provisions which can be quant ified, receiving more t han one-fift h of t he count ry-specific addit ions. In addit ion, t he t ransit ional provisions relat ing t o t he Cohesion Fund were clearly of maj or benefit t o Spain.
Figure 10: Changing Value of Additional Provisions between NB5 and UKNB3 (€mn)
UKNB3 para
Beneficiary NB5 NB6 UKNB1 UKNB2 UKNB3
44 Germany n.a.
44 Greece n.a.
45 Transit ional areas n.a.
46 Poland 114.2 114.2 114.2 1084.7 1221.7
46 bis Hungary n.a. 140.0
46 t er Czech Republic 200.0 200.0
47 Cyprus n.a.
48 Finland n.a.
48 Port ugal n.a.
49 Spain 100.0 100.0 100.0 100.0
50 Spain 374.5 436.9 436.9 436.9 436.9
50 Finland 164.4 191.8 191.8 191.8 191.8
50 Sweden 203.2 237.1 237.1 237.1 237.1
51 Border regions n.a.
52 Ireland 100.0 100.0 100.0 100.0 100.0
52 UK 100.0 100.0 100.0 100.0 100.0
53 Sweden 150.0 150.0 150.0 150.0
53 bis Est onia 47.6 47.6
53 bis Lat via 81.9 81.9
54 Aust ria 150.0 150.0 150.0 150.0
54 Germany 75.0
54 bis Spain 2000.0
54 ter Spain 50.0 50.0
54 quart er It aly 1400.0
54 quint o France 100.0
54 sext o Germany 225.0
Total Total 1056.2 1579.9 1579.9 2929.9 7006.9
Total Spain 374.5 536.9 536.9 586.9 2586.9
Increase Total 1056.2 523.7 0.0 1350.0 4077.1
Increase Spain 374.5 162.4 0.0 50.0 2000.0
Notes: The focus is on t he changes int roduced between t he fifth Luxembourg Negot iat ing Box and t he t hird UK Negot iating Box. For t hose ent ries where the value of the concession is not made explicit in t he Negotiat ing Box (n.a. in t he t able), t here was no subsequent change to t he value of t he concession (except under para 46 bis). It should be not ed t hat t he above t able does not list all of t he concessions made in t he final st ages of t he negot iat ions. There were also rural development “ add-ons” (under para 63), which tot alled €4,070 million, and own resources “ add-ons” (under para 78) which, in addit ion t o reduced VAT calls, benefit ed t he Net herlands to t he t une of €605 million and Sweden to t he value of €150 million.
2.5
Implications for Spain
The basic conclusion arising from t he above review must be t hat , set alongside it s original negot iat ing goals (see Sect ion 2.1), t he out come of t he Cohesion policy budget negot iat ions was positive for Spain. It cert ainly managed t o meet many of its obj ectives. Above all, Spain achieved very significant t ransitional support (€3,250 million) following t he loss of eligibilit y for t he Cohesion Fund, wit h t he negot iat ed t ransitional phase ext ending over t he ent ire 2007-13 period. In addit ion, while it did not meet it s goal of Phase-out regions being t reat ed similarly t o Convergence regions,37 it did achieve a significant increase in t he Phase-in budget , t aking it well above the original Commission proposal. More t han one-fifth of t he Spanish populat ion fit s wit hin t he Phase-in cat egory.38 Spain also managed t o ensure
37 Specific ext ra provision was limit ed t o count ries where Phase-out regions made up more t han one third of the national population (compared to j ust 6 percent in Spain). On t he ot her hand, it is of not e that this concession was made at the same time as transit ional Cohesion Fund support was made available t o Spain.
t hat t he Regional Competit iveness and Employment priorit y was ret ained at a reasonable level of funding in t he face of t he negot iat ing st ance of some count ries t hat resources should focus exclusively on poor countries and/ or regions. Wit h regard t o Canarias, ext ra support worth €536.9 million was won. Spain also gained specific ext ra provision for Ceut a and Melilla (€50 million). Finally, not only did Spain mange t o ensure t hat t here was at least an element of “ balanced access” t o Compet itiveness funding (under EU budget heading 1a), but it also gained maj or Cohesion policy support for Spanish R&D (€2,000 million).
On t he ot her hand, it is clear t hat t he overall Cohesion policy budget flowing t o Spain will be much reduced from 2000-06 levels. The next sect ion considers fut ure Spanish Cohesion policy funding in more detail, comparing it in particular t o current allocations.
3.
COHESION POLICY – NATIONAL AND REGIONAL OUTCOMES
As already discussed, t he financial implications for Spain of t he reform of Cohesion policy post -2006 flow from t wo main factors: first , changes in eligibilit y for Cohesion policy support , which are part ly, but not ent irely, due t o enlargement and shifting EU averages; and second, changes in the overall budget allocat ion and t he archit ect ure of t he reform. This sect ion begins by looking at t he nat ional l evel implications of Cohesion policy reform before considering t he implicat ions for t he regional l evel in t hose areas of policy where financial allocat ions are disaggregat ed. In bot h cases, it compares t he out come of t he 1999 Berlin European Council wit h t he t hird UK Negot iat ing Box (UKNB3) and, at t he nat ional level, wit h t he Commission proposals (COM prop).
3.1
Overall Cohesion policy allocations
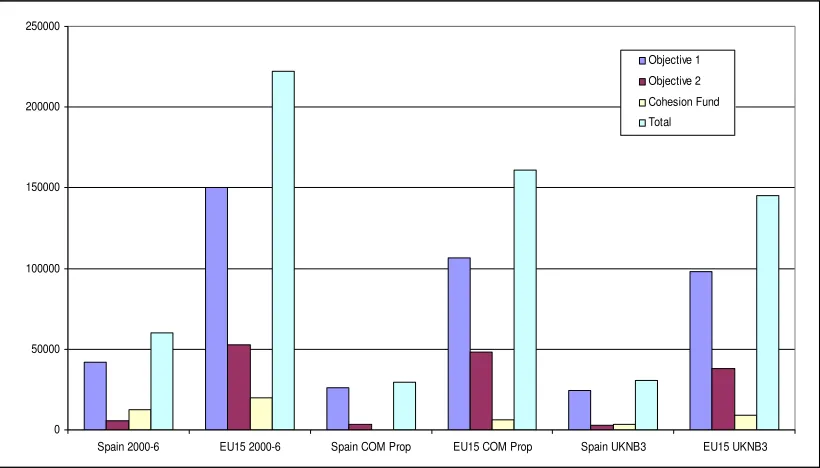
Figure 11: Impact of COM Proposals and UKNB3 on Commitment Appropriations for Spain (€m, 2004 prices)
0 50000 100000 150000 200000 250000
Spain 2000-6 EU15 2000-6 Spain COM Prop EU15 COM Prop Spain UKNB3 EU15 UKNB3 Objective 1 Objective 2 Cohesion Fund Total
Notes: (i) For the 2000-06 period, spending has been grouped as follows: Obj ective 1 includes Obj ect ive 1 Phase-out ; Obj ect ive 2 includes Obj ect ive 2 Phase-out , Obj ect ive 3 and FIFG outside Obj ect ive 1 (see Figure 2); (ii) For t he 2007-13 proposals, Obj ective 1 includes Phase-out , Phase-in and OMRs (Out ermost regions); (iii) Communit y Init iat ives (2000-06) and t he Cooperat ion priorit y (2007-13) are excluded from t hese figures.
Source: EPRC calculat ions from Eurost at dat a, dat a on Inforegio and RAPID release IP/ 99/ 442
Figure 12: Spanish Share of Cohesion Commitment Appropriations (% of EU15 total)
0 10 20 30 40 50 60 70
Objective 1 Objective 2 Cohesion Fund Total 2000-6 COM Prop UKNB3
[image:29.595.91.505.459.709.2]Figure 11 shows t hat t he proposed allocat ion t o Spain fell significant ly in absolut e t erms – from around €60 billion (2004 prices) in 2000-06 t o under €30 billion under t he Commission proposal (but over €30 billion under UKNB3). It also fell in relat ive t erms. Expressed as a proport ion of t he EU15 commit ment allocations, Spain will receive a significant reduct ion in it s share of overall EU15 funding compared t o t he 2000-06 period (see Figure 12). Against t his, it can be seen t hat , in t he course of t he negotiat ions, Spain managed t o increase it s funding share t o more t han one-fift h of t he EU15 t otal.
3.2
Objective 1 / Convergence
[image:30.595.92.506.448.705.2]As discussed in t he cont ext of Figure 3, one of t he main reasons for t he scale of t he impact on Spanish commitment appropriat ions concerns changes in t he eligibilit y of t he Spanish regions for Convergence support , due bot h t o enlargement and t he growt h of t he Spanish economy. Less t han one-t hird of t he Spanish population is now locat ed in regions qualifying for full Convergence stat us, compared t o almost t hree-fift hs for t he 2000-06 period. Relat ed, t ransit ional st at us has become import ant for Spain, wit h almost 6 percent of t he populat ion in Phase-out regions and over one-fifth in Phase-in regions. Because of t he changes in eligibilit y and t he impact of enlargement , comparisons bet ween t he 2000-06 period and t he out comes under UKNB3 for 2007-13 are not st raightforward. Nevert heless, it is clear t hat , wit hin t he EU15, t he new proposals (bot h COM prop and UKNB3) involve a significant reduct ion in Convergence funding. The Spanish share in t ot al EU15 Convergence funding is est imated t o fall from over 29 percent in 2000-06 t o around 24 percent under UKNB3 (see Figure 13).
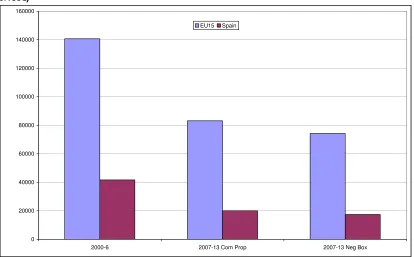
Figure 13: Implications for EU15 Convergence Region Total Allocations (€m, 2004 prices)
0 20000 40000 60000 80000 100000 120000 140000 160000
2000-6 2007-13 Com Prop 2007-13 Neg Box EU15 Spain
Source: EPRC calculations
less marked t han t hat in the overall budget allocations. Spain cont inues t o receive a higher per capit a allocation t han t he EU15 average.
Figure 14: Implications for Convergence Regions - Per Capita Annual Allocations (€, 2004 prices)
0.0 50.0 100.0 150.0 200.0 250.0 300.0
2000-6 2007-13 Com Prop 2007-13 Neg Box EU15 Spain
Source: EPRC calculations
3.3
Cohesion Fund
Anot her key element from t he Spanish perspect ive concerns eligibilit y for t he Cohesion Fund. The Cohesion Fund cont ributes t o t he Convergence priorit y under t he new archit ect ure. Eligibilit y for t he Cohesion Fund is defined in Art icle 5(3) of t he draft Regulat ion as concerning Member St at es whose per capita Gross National Income (GNI), measured in purchasing power parities and calculated for t he last t hree years available, is less t han 90 percent of t he Communit y average, and which have a programme for meet ing t he economic convergence conditions referred t o in Art icle 104.
Figure 15: GNI (PPS) Per Head 2001-03 (EU25=100)
Eligible Member States Ineligible Member States
Latvia 38.6 Spain 93.3
Estonia 41.5 Italy 107.8
Lithuania 42.9 Germany 109.2
Poland 45.7 Ireland 110.5
Slovakia 50.9 Finland 112.0
Hungary 55.6 Sweden 115.1
Czech Republic 65.1 France 115.5
Malta 71.2 Belgium 119.5
Portugal 75.2 United Kingdom 119.6
Slovenia 76.1 Netherlands 120.2
Greece 77.3 Austria 120.8
Cyprus 85.4 Denmark 122.7
Luxembourg 190.9
[image:31.595.85.518.570.761.2]The current recipient s of the Cohesion Fund are Greece, Port ugal and Spain, toget her wit h all of t he new Member Stat es (wit h effect from 2004). Ireland ceased to be eligible at the end of 2003 following t he mid-t erm review. Using GNI dat a for 2001-03, Figure 15 list s t he GNI per head figures for Member Stat es relat ive t o t he EU25 average. The table makes clear t hat all of new Member St at es, plus Greece and Port ugal, would qualify for t he Cohesion Fund post -2006, but t hat Spain would cease t o be eligible.
[image:32.595.90.504.335.585.2]As discussed earlier, t he init ial Commission proposal did not include any t ransitional arrangements for t he Cohesion Fund. This was a key element in the Spanish posit ion on t he reforms and, as discussed in t he last sect ion, ult imately result ed in special phase-out provisions being made for Spain. The implicat ions for Spain of the reform proposals for t he Cohesion Fund are illust rat ed in Figure 16. This shows a dramat ic shift in t he Spanish sit uation: from having been t he main beneficiary in 2000-06, no allocation was initially proposed by t he Commission. Transit ional arrangement s were sought and, as already discussed, result ed in funding of €3.25 billion (compared with over €12.3 billion in 2000-06).
Figure 16: Implications for Cohesion Fund Total Allocations (€m, 2004 prices)
0 5000 10000 15000 20000
EU15 Greece Spain Ireland Portugal
Berlin Com prop UK NB3
Source: EPRC calculations
3.4
Outermost regions
Reflect ing t he changes to t he Treat y regarding t he Out ermost regions (OMRs), t he draft St ruct ural Funds Regulation provides for a special budget line for t he seven regions concerned; there was no such special t reat ment in t he 2000-06 period. In t he Spanish cont ext only Canarias is designat ed as an Out ermost region.