Adaptive Query-Based Sampling
of Distributed Collections
Mark Baillie, Leif Azzopardi, and Fabio Crestani
Department of Computing and Information Sciences, University of Strathclyde, Glasgow, UK {mb, leif, fabioc}@cis.strath.ac.uk
Abstract. As part of a Distributed Information Retrieval system a
de-scription of each remote information resource, archive or repository is usually stored centrally in order to facilitate resource selection. The ac-quisition of precise resource descriptions is therefore an important phase in Distributed Information Retrieval, as the quality of such represen-tations will impact on selection accuracy, and ultimately retrieval per-formance. While Query-Based Sampling is currently used for content discovery of uncooperative resources, the application of this technique is dependent upon heuristic guidelines to determine when a sufficiently ac-curate representation of each remote resource has been obtained. In this paper we address this shortcoming by using the Predictive Likelihood to provide both an indication of the quality of an acquired resource descrip-tion estimate, and when a sufficiently good representadescrip-tion of a resource has been obtained during Query-Based Sampling.
1
Introduction
is dependent upon heuristic guidelines to determine when a sufficiently accu-rate representation of each remote resource has been obtained. In this paper we address this shortcoming by using the Predictive Likelihood to provide both an indication of: (i) the quality of an acquired resource description estimate, and (ii) when a sufficiently good representation of a resource has been obtained during Query-Based Sampling.
The remainder of this paper is structured as follows. First, we provide a brief outline of Query-Based Sampling and how it can be used to build resource descriptions, then we outline how Predictive Likelihood can be adopted as a measure of resource description quality with respect to the user information needs (Section 2). Next, we compare Predictive Likelihood to existing measures and show that it provides a comparable indication of resource quality despite the fact noa priori knowledge is used (Section 3). Finally, we demonstrate and evaluate the application of Predictive Likelihood in Query-Based Sampling on two DIR testbeds (Section 4). Our analysis validates that this unsupervised approach can substantially reduce the number of documents sampled without detracting from resource selection accuracy. We then conclude the paper with a short discussion detailing the implications of using such an approach and indicate directions for future work (Section 5).
2
Query-Based Sampling and Predictive Likelihood
A resource description is a representation of the content contained within a resource (e.g. a document collection). It can take a variety of forms depending on a number of influencing factors; such as the retrieval model used for resource selection, and the level of co-operation between a search service and information provider. Currently adopted representations include a term vector of counts or probabilities (i.e. a language model) [7], a sample of indexed documents from each collection [14], or indeed the full index [6].
The widely accepted solution for resource description acquisition is Query-Based Sampling (QBS) [7]. During QBS an estimated representation is obtained by submitting random queries to the actual collection, incrementally adding the newly retrieved documents to the estimated resource representation. Queries are randomly selected to ensure that an unbiased resource estimate is achieved. Sampling is then terminated when it is believed a sufficiently good representa-tion of the underlying resource has been acquired, facilitating effective retrieval. Through empirical analysis, the number of documents required to be sampled, on average, was estimated to be approximately 300-500. This was believed to obtained a sufficiently good representation of a resource [7]. This threshold was estimated by measuring the estimated resource description against the actual resource using two indicators of quality, and then considering the corresponding retrieval selection accuracy.
Cases when the blanket application of such a heuristic would be inappropriate include: (i) when the sizes of resources are highly skewed, and (ii) when the resources are heterogeneous. In the former, if a resource is large then undersam-pling may occur because not enough documents are obtained. Conversely, if a collection is small in size, then oversampling may occur, increasing costs beyond necessity. In the latter case, if the resource is varied and highly heterogeneous then to obtain a sufficiently accurate description would require more documents to be sampled than when a resource is homogenous. For both scenarios, adopting a threshold based heuristic will not ensure a sufficiently good resource descrip-tion for all resources. This has been recently verified by Shokouhiet al.[13] over a number of different DIR testbeds.
Ideally QBS should be curtailed only when a sufficiently good description of the resource has been acquired such that the number of documents sampled is minimised and system performance preserved. In this paper we argue that the Predictive Likelihood of the user’s information needs given the estimated resource description can be utilised as a measure of the goodness of a resource description estimate. We believe that the Predictive Likelihood can be used to: (i) provide an indication of the resource description quality, and (ii) to indicate when a sufficiently good representation of the resource has been obtained.
In statistical modelling the log-likelihood of a model on a held out sample of data is often applied as a measure for the “goodness of fit” of that model. This measure is also known as the Predictive Likelihood (PL) of the model [8]. PL is generally used to measure the quality of a language model in the fields of Statistical Language Modelling, but has been more recently applied to estimate language model parameters in text retrieval [1, 10, 16]. In these studies it has been generally assumed that those models which maximise PL will achieve bet-ter retrieval performance. Following this intuition, in the context of measuring description quality, we aim to maximise the PL of the user’s information needs given the estimated resource description. By using PL we are measuring how representative each distributed information resource is when compared to the known (typical) information needs of the users of the DIR system. This is a departure from the original QBS assumption that a resource description should be a sufficient sample of the actual entire collection. Instead, by using PL de-scriptions are measured with respect to the information needs of the users of the system. Before discussing this main difference, we first define the Predictive Likelihood measure and how it incorporates the user’s information needs.
Formally, given a sequence of queriesQ={qij : 1, . . . , N; 1, . . . , M}, where qij is the jth term of the ith query, which corresponds to a particular term t
in the estimated resource descriptionp(t =qij|θˆ). The likelihood of a resource
description estimate ˆθgeneratingQis given by the conditional probability:
p(Q|θˆ) =
N Y
i=1 M Y
j=1
where,
p(t|θˆ) = P n(t,θˆ)
t′∈θˆn(t
′,θˆ)
and n(t,θˆ) is the number of times term t occurs in the resource estimate ˆθ. We engage the standard assumption of independence between query terms and also between queries [16]. For computational connivence, however, we use the Predictive Log Likelihood of the estimated resource ˆθ:
ℓ(ˆθ, Q) = logp(Q|θˆ) =
N X
i=1 M X
j=1
logp(t=qij|θˆ)
Using this approach for measuring the quality of a resource description is fundamentally different to existing standard approaches. Current methods mea-sure the quality of an estimate against the actual resource, thus requiring full collection knowledgea priori. As mentioned previously such information is not readily available except in artificial or simulated environments. In comparison, PL requires that a set of queries Q are available for evaluating each resource description instead of the actual collection. Therefore, the selection of this set of queries is an important step in training the DIR system.
We assume that the set of queries Q are representative of the information needs of the users of that system. To elaborate, these information needs, or queries, can take the form of: (i) the previous interactions of the system obtained through the query logs [2] or (ii) profiles that represent the interests of the user-base, similar to profiles used in Information Filtering systems [4]. In the former, a query set consistent with the information needs of the user-base of the system can be obtained from query logs. For instance, the query logs of each user can be mined to extract a representative set of queries. Alternatively, if no historical queries are freely available, it is possible to access example queries from Information Retrieval test collections or a similar web based corpus. Conversely, or even supplementary, users of the system could be profiled explicitly, such as through a questionnaire or survey, where profiles represent typical topics, subject areas and tasks that the users of the system will undertake. However, both solutions for representingQenable the DIR system to be tuned either towards an averageuser-base or even tailored towards specific users or user groups depending on the requirements of the system. Throughout the development of the system,
Qcan also be re-assessed with respect to the user’s dynamically changing needs.
3
Predictive Likelihood as an Indicator of Quality
with the added advantage that PL does not requirea priori knowledge of the underlying information resource statistics.
3.1 Existing Measures of Resource Description quality
Current measures of resource description quality include the Collection Term Frequency ratio (CTF), Spearman Rank Correlation Coefficient (SRCC) [7], and the Kullback-Leibler (KL) divergence [3, 11]. CTF and SRCC are normally applied in tandem, where the former provides an indication of the percentage of terms seen, while the latter is an indication of term ranking order, although neither consider the term frequency which is an important information source for all resource selection algorithms. In a recent study, the SRCC measure was shown to be unstable and unreliable [3]. As an alternative measure the KL di-vergence was proposed. With respect to the goal of measuring the quality of a resource description the KL divergence is appealing for a number of reasons. The term probability distributions of the actual and estimated resource descrip-tions capture the relative (or normalised) term frequencies, when an accurate estimation of such information is pertinent to many of the state of the art re-source selection algorithms [6, 11, 14, 15]. It also fulfils the criteria set forth in the original QBS study by Callan and Connell [7] of measuring the correspondence between the estimated and actual resource vocabulary while not overly weighting low frequency terms (CTF), and also measuring the correspondence between the estimated and actual frequency information (SRCC). Essentially the KL diver-gence measures this phenomena precisely, resulting in a more stable and precise measure in comparison to the surrogate indicators CTF and SRCC.
We therefore compare the KL against the PL. In this experiment we hypoth-esise that the PL will provide a comparable indication of the resource description quality to KL.
3.2 Kullback-Leibler divergence
The Kullback-Leibler Divergence (KL) provides a measure for comparing the difference between two probability distributions[12]. When applied to the prob-lem of resource description quality, KL measures the relative entropy between the probability of a term t occurring in the actual resourceθ (i.e. p(t|θ)), and the probability of the termtoccurring in the resource description ˆθ, i.e. p(t|θˆ). Formally, the KL Divergence is defined as:
KL(θ|θˆ) =X
t∈V
p(t|θ)logp(t|θ) p(t|θˆ)
where, p(t|θ) = Pn(t,θ)
t∈θn(t,θ)
, p(t|θˆ) =
P
d∈θˆn(t,d)+α
P
t(
P
d∈θˆn(t,d)+α)
, n(t, d) is the number
Collection # Documents # Collection Terms # Unique Terms Mean Doc. Length
Aquaint 1,033,461 284,597,335 707,778 275
[image:6.595.136.476.116.156.2]WT10g 1,692,096 675,181,452 4,716,811 399
Table 1.Collection Statistics.
sparsity within the set of sampled documents, Laplace smoothing is applied to alleviate the zero probability problem and to ensure a fair comparison between each estimated resource description.
3.3 Experimental Methodology
Our aim is to evaluate whether PL provides a similar indication of thetrue qual-ity of a resource description estimate. Here, we assume that the KL divergence is the true measure of quality because it’s measurement is taken against the actual resource description (ground truth). Our hypothesis is that for a set of estimated resource descriptions the PL measure will rank these estimated re-source descriptions in the same order as the KL measure. If this is the case then PL will provide a comparable indication of the quality of that resource according to the KL measure.
200 400 600 800 1000 1200 1400 1600 1800
2 4 6 8 10 12 14
Number of documents seen
KL
ctf df avetf unif
200 400 600 800 1000 1200 1400 1600 1800
−1600 −1500 −1400 −1300 −1200 −1100 −1000 −900 −800 −700 −600
Number of documents seen
Predictive Likelihood ctf
df avetf unif baseline
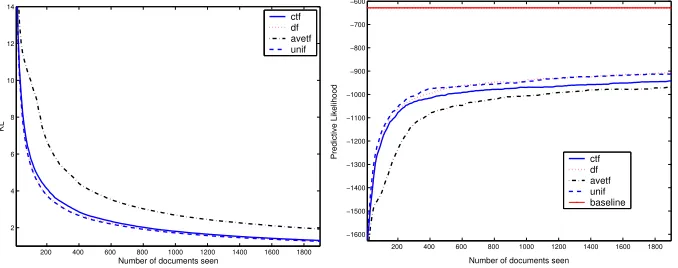
Fig. 1.Measuring the quality of resource description estimates obtained from Aquaint
collection by the four QBS approaches. KL and PL measurements for each sampling approach are displayed as the number of documents sampled increases.
The experiments were performed on several different TREC collections, with varying characteristics. For brevity, though, we only report on two of these collec-tions, the news collection Aquaint, and the Web collection WT10g ( See Table 1). Estimated resource descriptions were then created for these collections using QBS as follows:
[image:6.595.140.479.375.509.2]200 400 600 800 1000 1200 1400 1600 1800 1
2 3 4 5 6 7 8 9 10 11 12
Number of documents seen
KL
ctf df avetf unif
200 400 600 800 1000 1200 1400 1600 1800
−9000 −8500 −8000 −7500 −7000 −6500 −6000 −5500 −5000 −4500 −4000 −3500
Number of documents seen
PL
[image:7.595.142.477.115.253.2]ctf df avetf unif baseline
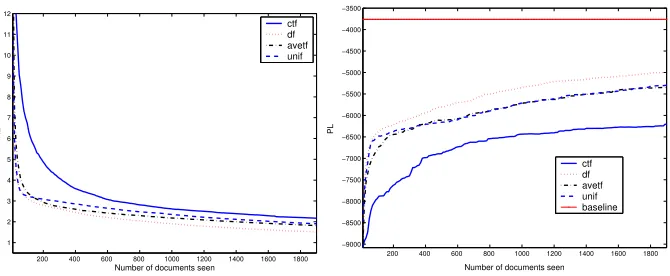
Fig. 2.Measuring resource description estimates obtained from the WT10g collection.
2. The resource is queried and the top four documents returned are added to the estimated resource description.
3. The KL and PL are measured and recorded.
4. The next query is generated using the currently estimated resource descrip-tion using one of the four sampling strategies: the collecdescrip-tion frequency (ctf), the document frequency (df), the average term frequency (avetf), or ran-domly (unif) [7].
5. If the stopping criterion has not been satisfied, return to step (2).
We continued sampling until we obtained 2000 documents. For each sampling strategy the entire process was repeated 25 times because the initial term affects the quality of the resource description. This generated 100 estimated resource descriptions for each collection along with the corresponding measurements. The query set to compute PL for both collections consisted of TREC Topics 1-200. The title field from these topics were extracted as queries which formedQ for each collection respectively.
3.4 Experimental Results
Resource description quality Figures 1 and 2 summarise the performance
of each sampling strategy by displaying the mean quality score over the 25 runs for the Aquaint and WT10g collection respectively. In the KL plots, a score of zero indicates that the estimate is identical to the actual description. While in the PL plots, the higher the PL the better the quality, where the baseline is shown as a solid line which denotes the PL score forQgiven the actual resource descriptionθ.
Documents Sampled Collection 200 500 1000 2000
Aquaint 0.85* 0.68* 0.62* 0.53*
[image:8.595.234.381.113.161.2]WT10g 0.38* 0.51* 0.57* 0.82*
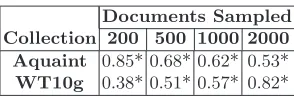
Table 2. The Kendallτ Correlation of KL and PL for ranking resource description
estimates in terms of quality, recorded at different intervals of documents sampled. An asterisk indicates a statistically significant correlation atp <0.05.
was found. As QBS sampling continued, the rate of improvement for each re-source description levelled out using either measure. This trend indicated that by adding further documents to the estimate provided small gains in quality. At this point, a decision to terminate QBS based on the cost of sampling fur-ther documents versus the gain in furfur-ther representation of the resource should be made. For the Aquaint collection, Figure 1, this point occurs when approxi-mately 800-1200 documents are sampled across all term selection methods. For the WT10g collection, Figure 2, this was found at approximately 1200-1600 for KL and somewhat later when measuring with PL.
We were also concerned with which term selection method (i.e.df, unif, ctf oravetf) acquired the better resource description estimates in terms of KL and PL, and in particular if there was agreement between both measures. Focusing first on the Aquaint collection, the ordering of the mean quality of each sampling strategy was found to be identical when using KL and PL. For both measures the rank order was:unif,df,ctf thenavetf (best to worst). For the WT10g collection, both measures also ranked the methods the same:df,unif,avetf followed byctf. Both KL and PL ranked the resource descriptions obtained from each term selection method in the same order. However, across the two collections this rank order varied with the random term selection method (unif) preferred for Aquaint, while the document frequency strategy (df) considered better for WT10g. This is an unexpected outcome as it reveals that PL can be used in a novel way for determining which sampling method will provide a better es-timate on a per collection basis, potentially increasing sampling effectiveness during QBS.
Correlation between the measures We ranked all the estimated resource
between the measures. Table 2 provides theτ correlation coefficient at 200, 500, 1000 and 2000 documents sampled.
At each of the different sampling points, shown in Table 2, the results reveal that there was a close agreement between both ranked lists complied using both measures. This relationship was found to be statistically significant across both collections, and at each of the different intervals, providing stronger evidence to support our hypothesis that the PL measure provides a comparable indication of quality with respect to the KL measure.
4
Predictive Likelihood as a Stopping Criterion
QBS is an iterative process where sampling is curtailed when a single or set of stopping criteria has been reached. In the standard approach to QBS, once n
unique documents have been retrieved then sampling is stopped [7]. We propose to use the PL measure to inform the decision making process in order to decide when enough documents have been sampled. Our stopping criterion is based on the difference in the PL score for the estimated resource description, between the previous iterationk−1 and the current iterationkof the sampling process. The differenceφk at iterationk, wherek >1, is given by:
φk=ℓ(ˆθk, Q)−ℓ(ˆθk−1, Q) =log p(Q|
ˆ
θk) p(Q|θˆk−1)
!
where ˆθk is the resource description estimate at the kthiteration. Ifφk is below
a thresholdǫ, then sampling is curtailed, whereǫindicates the necessary amount of improvement required to continue sampling. By doing so we are using a gradi-ent ascgradi-ent optimisation to maximise the Predictive Likelihood of the estimated resource description given Q[9]. The ratio of PL scores provides an indication of the rate of improvement over the previous iteration. Consequently, the free parameterǫ is independent of the document collection characteristics (such as size and heterogeneity). Unlike the fixedndocument curtailment strategy, this parameter is generalisable to other collections.
By using this technique we believe that a sufficiently good estimation of the resource will be obtained, which will minimise any unnecessary wastage from oversampling, and will also avoid obtaining an insufficient sample through under-sampling. We further hypothesise that because sufficient representations of each resource will be obtained, this will translate into better selection accuracy over the fixed method. We shall now refer to the proposed method as QBS-PL and the previous threshold based approach as QBS-T.
4.1 Evaluation
documents were approximately equal, and (2) if QBS-PL provided comparable resource selection accuracy to QBS-T when the number of sampled documents were substantially less than the threshold approach.
Experimental Settings Two DIR testbeds based on the TREC Aquaint
col-lection were formed for these experiments, with the documents partitioned By-source and By-topic. The By-By-source testbed contains 112 simulated collections, with the documents arranged into collections based on both the news agency that published each document, and the month the document was published. In this testbed the size of each collection is uniform. The By-topic testbed contains 88 collections, with documents grouped by topical similarity using single pass k-means clustering. In this testbed, collection sizes are skewed and represent a realistic setting with respect to the distribution of content.
For QBS, sampling was performed with the term selection strategy set to df, with four documents retrieved per query. The thresholds used for the QBS-T ranged from 100-1000 unique documents. For QBS-PL,ǫwas set to 0.01. We also include descriptions using the full collection information (‘complete’) as a bench-mark (i.e. all the documents in the resource to build the description). To provide an indication of how sensitive the retrieval accuracy is when applying QBS-PL with different query sets, we used four different sized query setsQconstructed from 200 TREC Topics (Topics 1-200). The number of queries in each set were 50, 100, 150 and 200. So as not to train and test using the same set of queries, another set of queries from the TREC HARD 2005 track were used for resource selection. This set contained 50 test topics, where the title field was used as the query. Resource selection was performed using the DIR benchmark algorithm CORI [6]. Resource selection accuracy was measured using the recall-based ˆR
metric. ˆRis a measure of the overall percentage of relevant documents contained in the top r collections [7]. We measured ˆR at r = {5%,10%,15%,20%,25%} of all collections searched. We also captured the average number of documents sampled per collection, and the total number of documents overall.
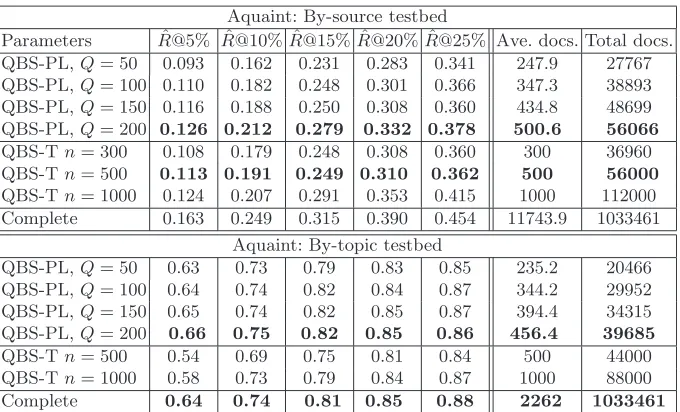
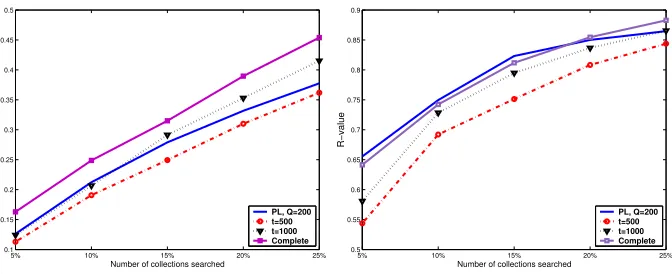
Experimental Results Table 3 provides an overview of the results obtained
for QBS-PL, QBS-T and also using the complete estimates (not all thresholds for QBS-T are shown). Figure 3 is a plot of QBS-PL using 200 queries, QBS with two document thresholds (t= 500,1000), and the resource selection performance using complete information, compared across each of the ˆR@rvalues.
Aquaint: By-source testbed
Parameters Rˆ@5% ˆR@10% ˆR@15% ˆR@20% ˆR@25% Ave. docs. Total docs. QBS-PL,Q= 50 0.093 0.162 0.231 0.283 0.341 247.9 27767 QBS-PL,Q= 100 0.110 0.182 0.248 0.301 0.366 347.3 38893 QBS-PL,Q= 150 0.116 0.188 0.250 0.308 0.360 434.8 48699 QBS-PL,Q= 200 0.126 0.212 0.279 0.332 0.378 500.6 56066
QBS-Tn= 300 0.108 0.179 0.248 0.308 0.360 300 36960 QBS-Tn= 500 0.113 0.191 0.249 0.310 0.362 500 56000
QBS-Tn= 1000 0.124 0.207 0.291 0.353 0.415 1000 112000 Complete 0.163 0.249 0.315 0.390 0.454 11743.9 1033461
Aquaint: By-topic testbed
QBS-PL,Q= 50 0.63 0.73 0.79 0.83 0.85 235.2 20466 QBS-PL,Q= 100 0.64 0.74 0.82 0.84 0.87 344.2 29952 QBS-PL,Q= 150 0.65 0.74 0.82 0.85 0.87 394.4 34315 QBS-PL,Q= 200 0.66 0.75 0.82 0.85 0.86 456.4 39685
QBS-Tn= 500 0.54 0.69 0.75 0.81 0.84 500 44000
QBS-Tn= 1000 0.58 0.73 0.79 0.84 0.87 1000 88000
[image:11.595.139.479.113.319.2]Complete 0.64 0.74 0.81 0.85 0.88 2262 1033461
Table 3.Each technique is evaluated by ˆR@rpercent of the collections searched, and
the overall document statistics for each QBS technique across the two testbeds.
because as the information needs of the users of a system diversify and change, a larger number of documents will be required in order to sufficiently describe a resource given those needs.
In comparison with the threshold method, T, the performance of QBS-PL provides comparable selection accuracy while reducing the number of docu-ments sampled (See Figure 3 and Table 3). If we consider QBS-PLQ= 200 on the By-source testbed, the fixed threshold ofn= 500 returns a similar number of documents sampled, but QBS-T’s selection accuracy is worse. It is not until the threshold was increased to n = 1000 that similar selection accuracy was obtained. However, this means that over 55,000 extra documents were sampled, an increase of almost 100%. On the By-topic testbed, QBS-PL provides better accuracy when compared with the QBS-T estimates. Even when QBS-T was set ton= 1000, with an increase of 40,000 to 50,000 extra documents sampled over the QBS-PL estimates, the selection accuracy was still 6-12% worse. It was only when complete information was used that performance similar to QBS-PL
Q= 200 was obtained. The seems to suggest that there are problems with under and over sampling of many collections, which was not so problematic when col-lection size was uniform as in the By-source testbed (and in previous work [7]); but is problematic when the collection sizes are skewed.
5
Conclusions and Future Work
5% 10% 15% 20% 25% 0.1
0.15 0.2 0.25 0.3 0.35 0.4 0.45 0.5
Number of collections searched
R−value
PL, Q=200 t=500 t=1000 Complete
5% 10% 15% 20% 25%
0.5 0.55 0.6 0.65 0.7 0.75 0.8 0.85 0.9
Number of collections searched
R−value
[image:12.595.142.478.114.251.2]PL, Q=200 t=500 t=1000 Complete
Fig. 3.QBS-PL versus QBS-T across a range of cut off values ofrover By-source (left)
and By-topic (right) respectively.
QBS algorithm. It was shown that a significant relationship exists between PL and KL divergence. However, PL is a radical departure from existing measures such as KL. It is radical because it questions whether a completely unbiased rep-resentation of the underlying resource is actually required. By using PL, we are not measuring quality in terms of sampling a sufficiently good representation of the actual collection, but measuring whether the resource description estimate satisfies the information needs of the users of the DIR system. With PL we mea-sure each resource description with respect to a set of queries that represent the typical information needs, Q, of the user-base of a system i.e. evaluating each estimate with respect to the information users want from that resource. For ex-ample, by increasingQ, it was highlighted that further documents were required to be sampled before a sufficient representation of the collection was obtained. This increase in the number of documents required to satisfy Q mirrored the addition of new information needs inQ.
We then highlighted that the problem of under and oversampling does ex-ist when employing a QBS algorithm which uses a fixed document threshold (QBS-T). As previously posited, this is especially problematic in a situation when resources are of varying size and content. Consequently, the efficiency and effectiveness of the QBS approach is compromised when using such criteria. By employing QBS-PL, it was shown that this problem can be addressed. Using PL to measure resource description quality without a priori knowledge of each distributed collection, the original QBS algorithm was improved both in terms of accuracy and efficiency. QBS-PL minimised the problems of under and oversam-pling, and in particular when faced with collections of varying size and content, we were able to determine when a sufficiently good representation of each col-lection had been obtained, which in turn was reflected by performance gains. In contrast, a fixed threshold resulted both in poorer resource selection performance and also increased overheads.
and paves the way for the development of personalised (distributed) retrieval systems. Defining the query setQprovides an intuitive mechanism for obtaining resource descriptions that are personalised to specific users or user groups; an unexplored area of research that we are currently investigating.
6
Acknowledgements
This work was supported by PENG, a Specific Targeted Research Project funded within the 6th PF of the European Research Area. More information on the project can be found at http://www.peng-project.org/.
References
1. L. Azzopardi, M. Girolami, and C. J. Risjbergen. Investigating the relationship be-tween language model perplexity and IR precision-recall measures. InProceedings of the 26th ACM SIGIR conference, pages 369–370, 2003.
2. R. A. Baeza-Yates. Applications of web query mining. InProceedings of the 27th ECIR, pages 7–22, Santiago de Compostela, Spain, 2005.
3. M. Baillie, L. Azzopardi, and F. Crestani. Towards better measures: Evaluation of estimated resource description quality for distributed IR. InFirst International Conference on Scalable Information Systems. IEEE CS Society, 2006.
4. N. J. Belkin and W. B. Croft. Information filtering and information retrieval: two sides of the same coin. Communications of the ACM, 35(12):29–38, 1992. 5. C. Buckley and E. M. Voorhees. Evaluating evaluation measure stability. In
Proceedings of the 23rd ACM SIGIR conference, pages 33–40, 2000.
6. J. P. Callan. Advances in information retrieval, chapter Distributed information retrieval, pages 127–150. Kluwer Academic Publishers, 2000.
7. J. P. Callan and M. Connell. Query-based sampling of text databases. ACM Transactions of Information Systems, 19(2):97–130, 2001.
8. M. H. Degroot. Optimal Statistical Decisions (Wiley Classics Library). Wiley-Interscience, April 2004.
9. R. O. Duda, P. E. Hart, and D. G. Stork.Pattern Classification. Wiley-Interscience Publication, 2000.
10. T. Hofmann. Unsupervised learning by probabilistic latent semantic analysis. Ma-chine Learning, 42(1-2):177–196, 2001.
11. P. G. Ipeirotis and L. Gravano. When one sample is not enough: improving text database selection using shrinkage. InProceedings of the ACM SIGMOD Confer-ence, pages 767–778, 2004.
12. S. Kullback. Information theoery and statistics. Wiley, New York, 1959.
13. M. Shokouhi, F. Scholer, and J. Zobel. Sample sizes for query probing in unco-operative distributed information retrieval. InAPWeb 2006, volume 3841, pages 63–75. Springer Lecture Notes in Computer Science, 2006.
14. L. Si and J. P. Callan. Modeling search engine effectiveness for federated search. InProceedings of the 28th ACM SIGIR Conference, pages 83–90, 2005.
15. J. Xu and W. B. Croft. Cluster-based language models for distributed retrieval. InProceedings of the 22nd ACM SIGIR conference, pages 254–261, 1999.