© 2019 Institute of Physics and Engineering in Medicine
1. Introduction
Until relatively recently, PET detectors on commercially available PET scanners had a timing resolution of a few nanoseconds. Therefore, data acquired by the scanner provided the position of the emitting atom to within a line across the two detectors. Time-of-flight (TOF) capable scanners measure the temporal difference in the
γ-photon detection with sufficient accuracy to provide an indirect measurement of the most likely location of the annihilation, thereby increasing the signal-to-noise ratio (SNR) (Nemallapudi et al2015, Dujardin et al2018).
Although early experimental PET scanners had TOF capabilities by using barium fluoride (BaF) scintillators (Laval et al1983), these crystals had low stopping-power and the photo-detector technology and speed of the acquisition electronics were not developed sufficiently for stable operation.
In the early 2000s, the introduction of lutetium oxyorthosilicate (LSO) and lutetium-yttrium oxyorthosili-cate (LYSO) scintillation crystals with high light output, good stopping power and fast responses revitalized TOF as an area of interest (Melcher and Schweitzer 1992, Moses and Derenzo 1999, Popescu et al2004).
N Efthimiou et al
Implementation and validation of time-of-flight PET image reconstruction module for listmode and sinogram projection data in the STIR library
Printed in the UK 035004 PHMBA7
© 2019 Institute of Physics and Engineering in Medicine
PMB 1361-6560 10.1088/1361-6560/aaf9b9 3
1
13
22
January
Implementation and validation of time-of-
fl
ight PET image
reconstruction module for listmode and sinogram projection
data in the STIR library
Nikos Efthimiou1,2,3 , Elise Emond2, Palak Wadhwa3,4, Christopher Cawthorne1, Charalampos Tsoumpas3,4
and Kris Thielemans2
1 PET Research Centre, Faculty of Health Sciences, University of Hull, Hull, United Kingdom 2 Institute of Nuclear Medicine, University College London, United Kingdom
3 Department of Biomedical Imaging Science, School of Medicine, University of Leeds, Leeds, United Kingdom 4 Invicro, Hammersmith Hospital, London, United Kingdom
E-mail: [email protected]
Keywords: medical imaging, Monte Carlo, positron emission tomography, time-of-flight, computer simulations, radionuclide imaging, open-source software
Abstract
In this paper, we describe the implementation of support for time-of-flight (TOF) positron emission tomography (PET) for both listmode and sinogram data in the open source software for tomographic image reconstruction (STIR). We provide validation and performance characterization using simulated data from the open source GATE Monte Carlo toolbox, with TOF configurations spanning from 81.2 to 209.6 ps. The coincidence detector resolution was corrected for the timing resolution deterioration due to the contribution of the crystal length. Comparison between the reconstruction of listmode and sinogram data demonstrated good agreement in both TOF and non-TOF cases in terms of relative absolute error. To reduce the reconstruction time, we assessed the truncation of the TOF kernel along lines-of-response (LOR). Rejection of LOR elements beyond four times the TOF standard deviation provides significant acceleration of ≈45% without compromising the image quality. Further narrowing of the kernel can provide extra time reduction but with the gradual introduction of error in the reconstructed images. As expected, TOF reconstruction performs better than non-TOF in terms of both contrast-recovery-coefficient (CRC) and signal-to-noise ratio (SNR). CRC achieves convergence faster with TOF, at lower signal-to-noise levels. SNR with TOF was superior for early iterations, but with quick deterioration. Higher timing resolution further improved reconstruction performance, while TOF bin mashing was shown to have only a small impact on reconstructed images.
2019
Original content from this work may be used under the terms of the Creative Commons Attribution 3.0 licence. Any further distribution of this work must maintain attribution to the author(s) and the title of the work, journal citation and DOI.
RECEIVED
18 September 2018
REVISED
16 December 2018
ACCEPTED FOR PUBLICATION
19 December 2018
PUBLISHED
The first generation TOF-capable clinical scanners had a coincidence timing resolution of around 600 ps (Moses 2003), with recent systems using silicon photomulipliers (SiPM) detectors achieving 250–350 ps (Surti
et al2007, Grant et al2016).
Much of the mathematical background for TOF reconstruction was presented by Snyder et al (1981), Tomi-tani (1981) and Snyder and Politte (1983), who envisaged efficient reconstruction where measurements would be made with an arbitrary timing accuracy and the radioactivity distribution could be estimated by histograms derived with no more than a scaling to account for the speed of the 511 keV γ-photons (Mullani et al1981, Snyder
1981, Wong et al1983).
The early publications focused on the benefits of using signal-to-noise ratio (SNR) gain as a metric of sensi-tivity (Mullani et al1984, Wagner and Brown 1985).
Conti et al (2005) presented the benefits of TOF for an LSO-based PET scanner. By comparing noise-contrast curves, they demonstrated that TOF reconstructions converge faster and achieve better contrast recovery (CR) than non-TOF reconstructions. In addition, this study highlighted the issue of coarse time binning, which may contribute to the degradation of Poisson statistics.
Thoen et al (2013) used listmode TOF reconstruction of Monte Carlo simulated data to determine the effects of different PET detector timing parameters on the performance of simultaneous PET-MR systems. They stud-ied the effect of TOF resolution, transverse pixel size and depth of interaction correction on image quality, in terms of spatial resolution, contrast recovery and SNR and the study concluded that the image quality can be significantly improved by reducing the transverse pixel size and improving the TOF resolution.
Brunner and Schaart (2017), reported that the cost-efficient bismuth germanate (BGO) crystals, used mostly in older generation scanners, may be capable of providing TOF information, too.
Commercial TOF-capable systems are provided with a proprietary closed source toolkit for acquiring and reconstructing data. However, there is a strong need for independent, open source software libraries to support the development of prototype scanners (Moskal et al2016) or research in medical imaging (Martins et al2005, Ahn et al2018, Berg and Cherry 2018). Independent reconstruction software packages that support TOF recon-struction include MOLAR (Johnson et al2004, Jin et al2013), QETIR (Thoen et al2013, Kolstein and Chmeissani
2016) and more recently CASToR2 (Merlin et al2018).
The software for tomographic image reconstruction (STIR) library is the oldest open source software in the field, originating back to the PARAPET project (1997–1999), a European Union ESPRIT project on parallel 3D PET reconstruction algorithms. The library’s source code was first released in June 2000 and a second release was made publicly available in 2009 (Thielemans et al2006, 2012). The current stable version of the library is v3.0.
In this paper we present the introduction of TOF (projection and listmode) reconstruction in the STIR library and the corresponding validation and performance evaluation through GATE Monte Carlo (MC) simulations (Jan et al2004). It is for the first time, a freely distributed software is being used to investigate of the benefits of the TOF reconstruction. The source code will be made available as an open source in the forthcoming release of the library.
2. Image reconstruction with time of flight
Tomographic image reconstruction tries to estimate volumetric images of the radiopharmaceutical distribution, using as input data acquired by the scanner. Iterative methods try to fit the data to a statistical model of the scanner which considers the underlying physics (Kinahan et al2004). Excluding background events, the forward model of emission tomography (ET) can be represented by the linear equation:
¯
g =Pf (1)
where ¯g represents a vector of the projection data expected to be measured, f represents the unknown underlying radiotracer distribution image vector and P is the system matrix which represents the scanner’s geometry and physical imaging processes.
Let each element pij of the matrix P represent the mean contribution of voxel j to projection element bin i. In the simplest case of solely geometrical contributions, the weights in P can be approximated by the intersection of the volumetric elements (voxels) to a line of response (LOR), specific for each bin or a detector pair. For this calculation, STIR normally uses a variation of Siddon’s ray tracing algorithm (Siddon 1985), optionally with multiple rays per detector pair (Jacobson et al2000), although other system models are equally supported, too. All voxels which do not intersect with the LOR are immediately excluded.
¯
git =!
j
pit;jfj (2)
where t is the index of the TOF bin.
If the voxel size is much smaller than the uncertainty in location due to the timing resolution, the system matrix can be computed, in good approximation, as:
pit;j=pijKitj (3)
where Kitj is the time-spread-function (TSF) for the tth TOF bin.
2.1. Image reconstruction
STIR supports a wide range of algorithms for the determination of the maximum likelihood estimate (MLE), including ordered subsets expectation maximization (OSEM), median root prior (MRP) and quadratic prior (QP) Bayesian one step late methods (Erdogan and Fessler 1999, Green et al2010), and the ordered subsets separable paraboloidal surrogates algorithm (Ahn and Fessler 2003). However, for the scope of this paper, only maximum likelihood expectation maximization (MLEM) was used (Shepp and Vardi 1982) as it is the simplest option, and is guaranteed to converge (even slowly) to a solution. However, due to the modular nature of STIR, all iterative algorithms are now support TOF.
Jacobson et al (2000) presented the MLEM version for projection data in the STIR library, however, a newly introduced listmode MLEM (LM-MLEM) (Barrett et al1997), is included within this major upgrade of the library and is formulated as follows:
λ(n+j 1)= λ (n) j Sj
!
ϵ∈Eϵ
pdϵtϵ;j
"
j′pdϵtϵ;j′λ
(n) j′
(4)
where λ(n) is the estimated image at the nth iteration, ϵ∈Eϵ are the events in the listmode file, dϵ is the detector pair for event ϵ and tϵ is its TOF bin. Sj is the backprojection of the detection efficiency for all LORs, which provides the sensitivity image, given as:
Sj= D
!
d
pdj 1
NdAd (5)
with D the set of all detector pairs, Nd is the normalization, Ad the attenuation correction factor. The absence of a sum over the TOF bins in the sensitivity image calculation is a consequence of equation (3).
2.2. TOF kernel application
For the TOF kernel model we will assume, as common in the literature, that the PET scanner measures the difference in arrival times with the uncertainty that can be modelled with a normal distribution.
As current PET scanners store the data using discrete TOF information, this distribution needs to be inte-grated over the TOF bins. In addition, this uncertainty in arrival time needs to be converted to spatial informa-tion. Figure 1 illustrates the application of the TOF kernel.
For each voxel j in the non-TOF row, let v′
cj be the projection of the Cartesian coordinates of each voxel’s
center on the vector connecting the two detectors AB⃗ .
For a given projection of the annihilation position along the LOR (v′
cj), the position corresponding to the detected timing difference follows a Normal distribution (µ,σ), where µ is v′
cj and σ is the standard deviation (SD) of the timing resolution of the scanner (Mehranian et al2016).
[image:3.595.118.554.57.164.2]The probability of detection in a certain TOF bin can then be computed using its cumulative distribution function (cdf). As a result, the timing dependent probability Kitj is given by:
Kitj= cdf(kt+1−vcj′)−cdf(kt−v′cj)
= 1
2
!
erf
!kt +1−v′cj
σ√2
"
−erf
!kt−v′
cj
σ√2
"" (6)
where we expressed the distance of the integration boundaries [kt,kt+1) of the tth TOF bin, from the v′cj point in
multiples of the timing kernel’s SD.
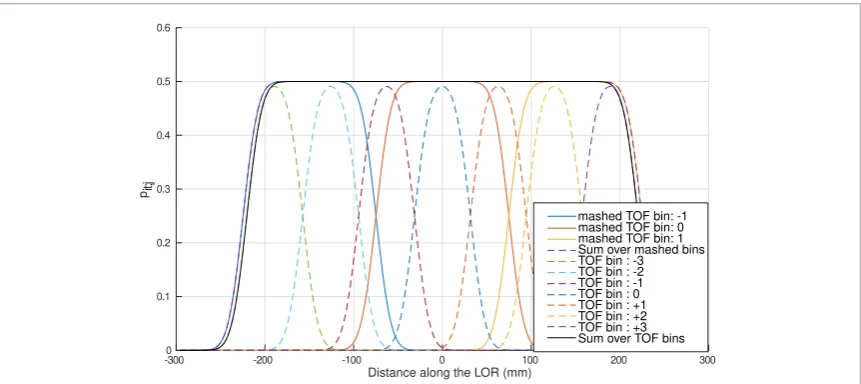
Some PET scanners have the capability to use TOF mashing, where a number of TOF bins are combined by spacing out the integration boundaries. This process leads to smaller data sizes. Figure 2 illustrates the TOF kernel when using TOF mashing, for a single ray. The initial setup had 7 TOF bins with integration boundaries every 62.95 mm. Subsequently, a mashing factor of 3 was applied to reduce the number of TOF bins to 3 with integration size of 149.74 mm. Please note that the sum over all bins in both cases are the same. This confirms that equation (6) is implemented properly.
3. Materials and methods
3.1. Monte Carlo simulations
3.1.1. Scanner geometry and coincidence timing resolution
The geometry of a cylindrical PET scanner was simulated using the GATE simulation toolkit (v.7.2) (Jan et al 2004).
The scanner had 24 rings with 666 detectors per rings. No gaps were considered. The cylindrical PET hierar-chy was used with, with 666 Rsectors, each one having one row of 24 crystals. The reason behind this arrangement was to the scanner’s geometry as close as possible to a cylinder, without gaps, as STIR does not support models of blocked geometries.
The inner ring radius was 424.5 mm and the total axial length 110.0 mm. The crystals were made of LSO:Ce (Melcher and Schweitzer 1992) with size 4×4×20 mm3. The energy resolution of the system was set to 11.7% and the applied energy window was 435–650 keV. The coincidence time window was set to 3 ns.
The number of TOF bins was set to 2999 with integration size 0.149 mm. In order to have a centered zero index bin, the number of TOF bins was kept odd. Detector dead-time was not considered. Three coincidence timing resolutions were considered: 50.0, 100.0 and 200.0 ps.
Post simulation, the detection time differences were sorted in histograms and fitted to a Gaussian function. After fitting the simulated data, the actual system’s timing resolution (FWHMT) values were found to be 81.2 ps, 118.4 ps and 209.6 ps, correspondingly. The difference between the expected and the actual FWHMT can be then explained by the photon transport spread (PTS), which contributes to the timing resolution deterioration (for more information, see appendix). The values found from the kernel fitting were those used for the TOF recon-struction.
[image:4.595.122.553.55.247.2]For the sake of simplicity the three timing resolution will be labelled as TOF-80, TOF-120 and TOF-210, throughout the paper.
3.1.2. Simulated phantom
An acquisition of the NEMA IQ phantom was simulated (National Electrical Manufacturers Association 2012). The computational phantom had the exact same dimensions as the physical IQ phantom. Four radioactive, hot, spheres (radii 5, 6.5, 8.5 and 11 mm) and 2 cold spheres (radii 14 and 18.5 mm) were introduced. The spheres were placed at the radial distance of 114.4 mm from the centre of the phantom and were centered axially. At the center of the phantom a cold cylinder made of the material equivalent to lung tissue, was placed.
The activity ratio between the sources and the background was 4 : 1. Random and scattered photon events were excluded post simulation.
The sinogram dimensions were 333 views ×320 tangential positions and 27 segments.
3.2. Image reconstruction
The voxel size of the reconstructed images was 2×2×2.08 mm3 with 297
×297×47 voxels, in total. No post-reconstruction smoothing filters were applied to the images.
Attenuation correction factors were produced with an analytical simulation, of the phantom, having the appropriate linear attenuation values for 511 keV γ-photons, as found in NIST (Hubbell and Seltzer 1995).
Normalization factors were calculated using a component-based methodology (Pépin et al2012, Efthimiou
et al2015). In brief, a cylindrical back-to-back source with diameter 400 mm, without an attenuating component was simulated with Monte Carlo for a long acquisition obtaining approximately 10×108 events. Fan sums were used, taking into consideration the axial and transaxial geometrical non-uniformity, crystal interleaving, detec-tor efficiencies and block profiles.
3.3. Comparison between sinogram and listmode reconstruction
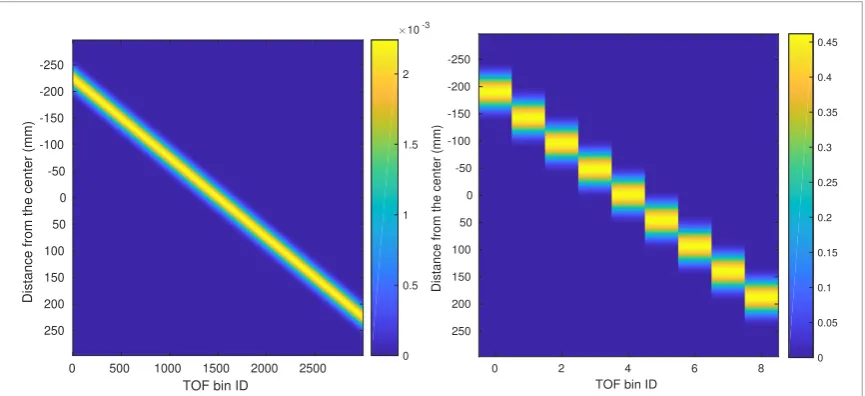
A GATE simulated dataset of approximately 10×106 counts was used for the comparison between the LM and projection reconstruction. The agreement between the two modes was validated for non-TOF and all TOF configurations.
The TOF data were histogrammed in sinograms with 13 TOF bins using timing mashing factor 215. The same timing mashing factor was applied in LM reconstruction. In figure 3 the central nine positions out of the 13 TOF positions for a single LOR, are illustrated.
The comparison was performed in terms of relative absolute error (E) using averaged images over 10 noise realizations.
3.3.1. Relative absolute error
The default image comparison tool (compare_image) provided in STIR quantifies the largest error and is calculated by the following formula:
E= max(|Y−X|)
max(|Y|) , (7)
[image:5.595.121.554.56.254.2]where Y is the first image and X is the second to be compared.
3.4. TOF kernel truncation
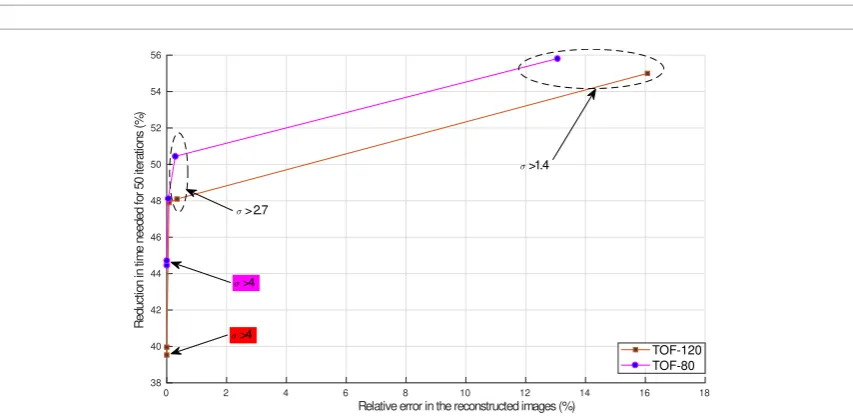
The duration of the reconstruction process strongly depends on the size of the projection matrix row. With TOF, the truncation of the LOR at a specific distance from the center of the TOF bin is possible (Daube-Witherspoon
et al2007). An investigation for the potential introduction of error due to truncation on different distances from the center of the TOF bin was performed. The distances 1.4, 2.7, 3.0, 3.5 and 4σ, were considered. Listmode reconstruction, without TOF mashing, for approximately 11×106 events, was performed for 50 iterations.
For the purpose of this comparison, all reconstructions were performed on an Intel i7 Skylake 6700 K pro-cessor with 16 GB RAM and SSD drive, using a single thread. STIR provides the options of OPEN-MP and MPI (Thielemans et al2015) but were not used in this instance.
3.5. Investigation of the performance of the time-of-flight reconstruction 3.5.1. ROI analysis
For each sphere the mean, standard deviation (SD) and coefficient of variation (CoV) were calculated using tools included in the STIR library. Circular regions of interest (ROIs) with the same radius as each source, were selected. The ROIs were drawn on the central slice, where the profile of the spheres was the largest. In our case, according to the alignment of the phantom and the scanner that slice was the 24th. Background ROIs of the same size as those used on the spheres were placed in the background area. The selected positions were non-symmetrical with respect to the center of the image. Twelve such background ROIs per slice for ±2 slices from the central slice, for each source, were considered. All background ROIs were placed so that none was closer than 15 mm to any sphere (National Electrical Manufacturers Association 2012).
3.5.2. Contrast recovery coefficient
The average contrast recovery coefficient (CRCH) for each hot sphere (H) was calculated over four noise realizations (p∈P) with ≈18×106 events each, using the formula (National Electrical Manufacturers Association 2012, Westerwoudt et al2014):
CRCH,r= 1 NP
P !"µH,r
µB,r −1 #
α−1 ×100%,
(8)
where µH,r denotes the mean value of the of hot sphere’s (Hr) ROI, µB,r denotes the mean background ROI value and α=4 which is the true activity ratio between the hot spheres and the background.
Respectively, in the case of the cold spheres C,r the CRCC,r was calculated by:
CRCC,r= 1 NP
P ! "
1 −µCµB,r
,r #
. (9)
The background viability was expressed as the coefficient of variation (CoVr), calculated for each sphere with size r as:
CoVr= 1
NP P
!σB,r µB,r.
(10)
3.5.3. Signal to noise ratio (SNR)
For the assessment of the SNR performance, four datasets with ≈18×106 events, were used. The SNR was calculated according to the formula (Westerwoudt et al2014):
SNRr= 1
NP P
!µH,r−N1B"µB,r
1
NB
"σ B,r
. (11)
4. Results
4.1. Comparison between sinogram and listmode reconstruction
The sinogram and listmode reconstructions are in very good agreement for both TOF and non-TOF cases with E below 0.009% at 10th, 30th and 40th iteration for non-TOF, TOF-80, TOF-120 and TOF-210. The small differences were expected as STIR uses single precision calculations.
4.2. TOF kernel truncation
Figure 5 illustrates the impact of different levels of LOR truncation in terms of (wall-clock) computation time and relative error in the reconstructed images for TOF-80 and TOF-120. As expected, TOF-80 which has the narrowest kernel demonstrated the largest reduction on their wall-clock computation time compared to TOF-120.
Reconstruction times were improved to ≈45% when truncating 4.0σ with practically no measurable impact in the reconstructed image. The majority of the rejected voxels in each TOF position did not relate to that par-ticular position, their probability was negligible, left over from the initial non-TOF LOR.
The cases 3.5σ and 3σ seemed to be equally appropriate alternative options for the NEMA phantom simula-tion and the statistics obtained in this simulasimula-tion. We anticipate that this will vary with noise level and regulariza-tion. Further, truncation with 1.4σ offered an acceleration of up to 55% but with a significant impact of E of the images. The largest differences are located near the boundaries of the phantom and at locations of high contrast. Larger smooth areas were not affected to the same extent in most cases, although 1.4σ demonstrated a strong impact in all locations of the phantom.
Figure 6 shows that there is a clear localization of the effect of truncation.
In the case of TOF-80, STIR was able to process 6050 events per second without truncation which with 4σ increase to 10 222. Non-TOF has a throughput of 17 037 events per second.
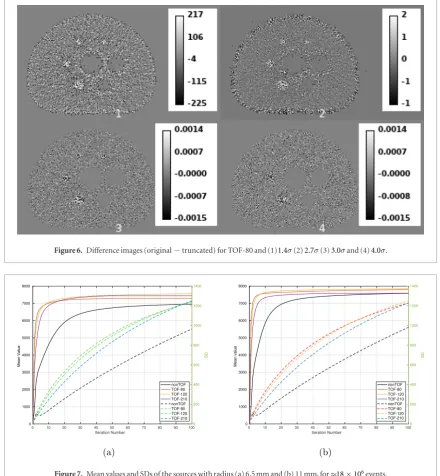
4.3. Mean values and SD
In figure 7 the mean value in the region of the two larger hot spheres and the background SD values, are shown. TOF converge much faster than non-TOF reconstruction.
For the largest hot sphere, µH,4 converged to the approximately same values for all configurations (figure
7(b)), but the 6.5 mm sphere non-TOF reached a ≈9% lower value.
(a) (b)
Figure 4. Difference images between listmode and sinogram reconstruction, in the large background region, at the 38rd iteration (a) non-TOF (b) TOF-80.
Worth noting that the mean values of the two sources are approximately the same with TOF reconstruction. The background SD kept increasing throughout the range of iterations, significantly faster in the TOF cases than the non-TOF.
4.4. Contrast recovery coefficient
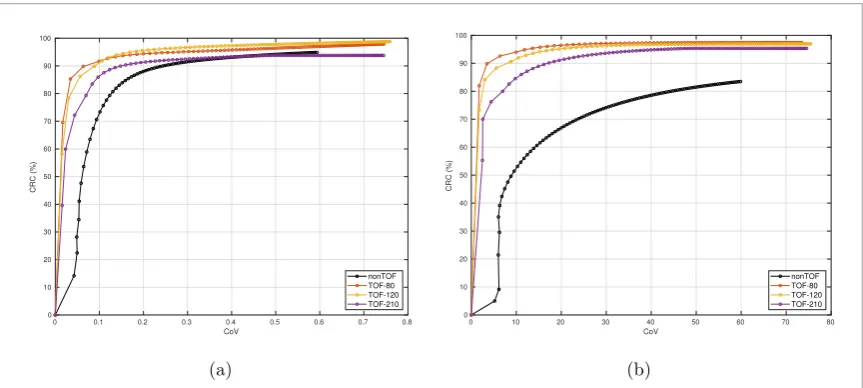
In figure 8 CRC over CoV for 100 iterations for the largest hot and cold spheres, is presented. Note that we did not iterate MLEM long enough to achieve convergence for nonTOF, but enough to demonstrate the benefits of TOF. Contrast recovery around 97% is achieved with high resolution TOF, while low resolution TOF and non-TOF reach a slightly lower value.
Smaller spheres recover to smaller values as 90% for the 8.5 mm sphere.
In all cases, high-resolution TOF performs better than low-resolution TOF and non-TOF. For example, for the 11 mm sphere, 95% recovery is reached after four iterations with a 16% noise level using 80, while TOF-210 needs 17 iterations and achieves 24% noise.
[image:8.595.122.553.56.302.2] [image:8.595.115.556.62.539.2] [image:8.595.120.551.322.523.2]The positive effect of TOF reconstruction is particularly evident in the cold spheres. Without TOF the recov-ery is significantly slower (figure 8(b)). Cold areas are known to be problematic to MLEM reconstruction.
Figure 9 shows example reconstructed images. For each configuration the iteration number was selected where the CRC of the largest hot sphere reached 95% of its maximum CRC. For non-TOF, TOF-80, TOF-120 and
Figure 6. Difference images (original − truncated) for TOF-80 and (1) 1.4σ (2) 2.7σ (3) 3.0σ and (4) 4.0σ.
For the circular profiles it is evident that the non-TOF reconstruction has poorer noise characteristics. In addition, the cold sources have not reached value 0 in most cases as it converges slower than the hot sphere, which was used to select the iteration number. The smaller spheres, especially the 5 mm, have the lower contrast, but more effects contribute to that, as partial volume error.
CRC sees a minimal impact from TOF mashing. Using only 13 TOF positions to perform the reconstruction resulted in 2%–3% worse recovery, mainly for higher resolutions.
4.5. Signal to noise ratio
TOF reconstruction drastically improved the SNR at early iterations, as demonstrated for the two larger hot spheres, in figure 10.
However, at a certain iteration (in most cases before the 10th) the SNR of the TOF images got poorer than the non-TOF case. Finally, non-TOF and TOF reconstructed images reach to approximately similar SNR levels in the range of iterations we studied.
On early iterations, TOF mashing has a small impact on the SNR peak value about 5% or less. But quickly after few iterations the mashed and non-mashed SNRs are aligned.
5. Discussion
Development of the TOF feature in the STIR reconstruction toolbox is a major update. The majority of modern scanners have TOF capable detectors. In addition, LM reconstruction is favored nowadays, as the size of the stored data is growing due to the timing positions, larger scanner sizes and better angular sampling.
Similarly to other authors (Karp et al2008, Conti et al2013, Westerwoudt et al2014, Suljic et al2015, Surti
2015, Zhang et al2018), we demonstrated that when using TOF, CRC converges faster. Comparison between different timing resolutions showed that the convergence speed is further improved when the scanner has better timing resolution. The benefits of TOF reconstruction are more evident in cold sources, which are a known issue in non-TOF MLEM reconstruction. The mean values per ROI, for the larger spheres convergence to approxi-mately the same value (<5% variation) is achieved, which is a good indication of only minimal bias introduction, in the TOF system model (see below for further discussion).
In terms of SNR, TOF performs better at low iteration numbers, as the mean value of the source is signifi-cantly higher than in the non-TOF case. Almost when the maximum mean value is reached, the SD becomes the driving factor and SNR decreases faster for TOF compared to non-TOF reconstruction. Similar behavior has been demonstrated by other authors (Conti et al2013, Westerwoudt et al2014). In our case, we found that TOF does not actually provide improved SD values, but actually the benefits on the SNR come from the improved source mean value which rises faster. This behaviour is stronger for higher timing resolutions, which makes the need to stop MLEM at the proper iteration more critical.
Monte Carlo simulations in medical imaging research are used for a wide range of purposes, support for the reconstruction of such data is in high demand. Therefore an interface which supports the reconstruction of data produced in the GATE toolbox was developed. Using GATE simulations and fast timing resolution simulations, we observed the importance of the photon detection time spread. Otherwise underestimated TOF kernels will be used in the reconstruction. It is important to fit the TOF timing resolution to the observed timing of the
[image:9.595.121.553.55.249.2]dences or modify the resolution by a factor l
c, where l is the crystal length. To the best of our knowledge this has not been reported by other authors working with GATE simulations (Groiselle and Glick 2004, Geramifar et al2008, Thoen et al2013).
Results in figure 7 seem to indicate that mean ROI values do not quite match between the different TOF reso-lutions. Aside from convergence issues, a potential cause is the slight mismatch between the actual the photon detection time spread function and the Gaussian model used in the reconstruction (Efthimiou et al2018).
[image:10.595.121.552.52.614.2]The adjustment of TOF locations and mashing, which is essential for sinogram based TOF reconstruction, has a small impact on the reconstructed images, in terms of CRC and SNR. The contrast converged slightly slower, therefore more iterations are needed, which will then influence the SNR properties. However, the impact was not
The current TOF implementation is slower than for nTOF, as the TOF kernel modelling is applied on-the-fly on the non-TOF LOR elements. Therefore, in order to improve this trade-off in execution time, the effect of TOF-LOR truncation was investigated, in order to accelerate the reconstruction (Daube-Witherspoon et al 2007). It was shown that 4σ and 3σ provide most of the benefits with respect to the duration of the reconstruc-tion without any measurable impact on the reconstructed images, in all cases tested.
In the future, we plan to implement caching of the TOF system matrix for systems with sufficient available memory. In addition, the ray-tracing algorithm will be modified to directly support TOF bins. The modification would make the algorithm to start the ray-tracing from the most probable point and move towards the integra-tion boundaries.
Finally, our future plans also include the development of a TOF scatter simulation method (Hemmati et al 2017).
6. Conclusion
In this work, we presented the validation of the addition of TOF reconstruction of listmode and sinogram data in the STIR library. GATE Monte Carlo simulations were used in order to provide a well-controlled dataset for the validation. The simulated data were reconstructed using a new interface for GATE generated ROOT files. All the components presented in this paper will be distributed as open source in the next version of the STIR library.
Acknowledgments
Dr Nikos Efthimiou was partially supported by the European Cooperation for Science and Technology Action TD1401: Fast Advanced Scintillation Timing (http://cern.ch/fast-cost), and acknowledges the receipt of an Allam Postdoctoral Fellowship. We thank Dr Assem Allam and his family for the generous donation to help found the PET Research Centre at the University of Hull and for their continued support. Elise Emond acknowledges funding support from GlaxoSmithKline to UCL (BIDS3000030921). Palak Wadhwa is supported by a Medical Research Council Industrial Case PhD Studentship (MR/M01746X/1) and Dr Charalampos Tsoumpas is supported by a Royal Society Industry Fellowship (IF170011). Dr N Efthimiou and P Wadhwa received support from the CCP PET-MR (EPSRC grant EP/M022587/1). The authors would like to express their gratitude to Prof Daniel Lesnic (University of Leeds) for his valuable comments and suggestions.
Appendix. Effect of photon time spread on timing resolution
As presented by Gundacker et al (2014) and Cates and Levin (2018) at high timing resolutions the photon time spread (PTS), i.e. the uncertainty of the detection time due to photon traveling inside the crystal or optical light latency, is not negligible. In our simulation, the PTS depends only on absorption of the events at different crystal depth which introduces a source of timing uncertainty.
[image:11.595.120.553.56.244.2]Under some approximations such behaviour can be described by the exponential Lambert–Beer’s law (Spanoudaki and Levin 2011). Assuming that the tails of the exponential attenuation are sufficiently truncated, then the effect of PTS can be approximately modelled with a Gaussian kernel with FWHMcrystal =cl, where l is the
length of the crystal and c is the speed of light. Thus the total timing response is given by the convolution of two distributions, and FWHMT =
!
FWHMCDR2+FWHMcrystal2, where FWHMcrystal = l c.
The model predicted FWHMT of 80.1 ps, 118.2 ps and 209.36 ps, respectively, which are in agreement with the values found by fitting the simulated data.
Note that another main component of PTS is the light transfer time spread (LTTS), which is an additional factor to FWHMT deterioration (Cates and Levin 2018) and is associated to the generation and spread of optical photons. However, this effect was not considered in our MC simulation as it would severely increase the simula-tion time.
ORCID iDs
Nikos Efthimiou https://orcid.org/0000-0003-1947-5033
Charalampos Tsoumpas https://orcid.org/0000-0002-4971-2477
Kris Thielemans https://orcid.org/0000-0002-5514-199X
References
Ahn S and Fessler J 2003 Globally convergent image reconstruction for emission tomography using relaxed ordered subsets algorithms IEEE Trans. Med. Imaging22613–26
Ahn S, Cheng L, Shanbhag D D, Qian H, Kaushik S S, Jansen F P and Wiesinger F 2018 Joint estimation of activity and attenuation for PET using pragmatic MR-based prior: application to clinical TOF PET/MR whole-body data for FDG and non-FDG tracers Phys. Med. Biol.63045006
Barrett H H, White T and Parra L C 1997 List-mode likelihood J. Opt. Soc. Am. A 142914–23
Berg E and Cherry S R 2018 Using convolutional neural networks to estimate time-of-flight from PET detector waveforms Phys. Med. Biol.
6302LT01
Brunner S E and Schaart D R 2017 BGO as a hybrid scintillator/Cherenkov radiator for cost-effective time-of-flight PET Phys. Med. Biol.
624421–39
Cates J W and Levin C S 2018 Evaluation of a clinical TOF-PET detector design that achieves 100 ps coincidence time resolution Phys. Med. Biol.63115011
Conti M, Bendriem B, Casey M, Chen M, Kehren F, Michel C and Panin V 2005 First experimental results of time-of-flight reconstruction on an LSO PET scanner Phys. Med. Biol.504507–26
Conti M, Eriksson L and Westerwoudt V 2013 Estimating image quality for future generations of TOF PET scanners IEEE Trans. Med. Imaging6087–94
Daube-Witherspoon M, Surti S, Matej S, Werner M, Jayanthi S and Karp J S 2007 Influence of time-of-flight kernel accuracy in TOF-PET reconstruction IEEE Nuclear Science Symp. Conf. Record vol 3 pp 1723–7
Dujardin C, Auffray E, Bourret-Courchesne E, Dorenbos P, Lecoq P, Nikl M, Vasil’ev A N, Yoshikawa A and Zhu R-Y 2018 Needs, trends, and advances in inorganic scintillators IEEE Trans. Nucl. Sci.651977–97
Efthimiou N, Emond E, Tsoumpas C, Thielemans K and Cawthorne C 2018 Estimation of timing resolution for very fast time-of-flight detectors in Monte Carlo simulations IEEE Nuclear Science Symp. Conf. Record (Sydney)
Efthimiou N, Loudos G and Panayiotakis G S 2015 Component based normalization method for rotating dual head PET scanner J. Phys.: Conf. Ser.637012007
Erdogan H and Fessler J A 1999 Ordered subsets algorithms for transmission tomography Phys. Med. Biol.442835–51
Geramifar P, Ay M R, Shamsaei Zafarghandi M, Loudos G and Rahmim A 2008 Monte Carlo assessment of time-of-flight benefits on the LYSO-based discovery RX PET/CT scanner Proc. IEEE Int. Symp. Biomedical Imaging (https://doi.org/10.1109/ISBI.2008.4541008) Grant A M, Deller T W, Khalighi M M, Maramraju S H, Delso G and Levin C S 2016 NEMA NU 2-2012 performance studies for the
SiPM-based ToF-PET component of the GE SIGNA PET/MR system Med. Phys.432334–43
Green M V, Ostrow H G, Seidel J and Pomper M G 2010 Experimental evaluation of depth-of-interaction correction in a small-animal positron emission tomography scanner Mol. Imaging9311–8
Groiselle C J and Glick S J 2004 3D PET list-mode iterative reconstruction using time-of-flight information IEEE Symp. Conf. on Nuclear Science vol 4 (IEEE) pp 2633–8
Gundacker S, Knapitsch A, Auffray E, Jarron P, Meyer T and Lecoq P 2014 Time resolution deterioration with increasing crystal length in a TOF-PET system Nucl. Instrum. Methods Phys. Res. A 73792–100
Hemmati H, Kamali-Asl A, Ay M and Ghafarian P 2017 Compton scatter tomography in TOF-PET Phys. Med. Biol.627641–58
Hubbell J and Seltzer S 1995 Tables of x-ray mass attenuation coefficients and mass energy-absorption coefficients 1 keV–20 meV for elements z = 1–92 and 48 additional substances of dosimetric interest Technical Report (Gaithersburg, MD: National Institute of Standard and Technology) PB-95-220539/XAB; NISTIR-5632 TRN: 51812148
Jacobson M et al 2000 Enhanced 3D PET OSEM reconstruction using inter-update Metz filtering Phys. Med. Biol.452417–39
Jan S et al 2004 GATE: a simulation toolkit for PET and SPECT Phys. Med. Biol.494543–61
Jin X, Chan C, Mulnix T, Liu C and Carson R E 2013 List-mode reconstruction for the Biograph mCT with probabilistic line-of-response positioning and event-by-event motion correction Phys. Med. Biol.585567–91
Johnson C, Thada S, Rodriguez M, Zhao Y, Iano-Fletcher A, Liow J S, Barker W C, Martino R L and Carson R E 2004 Software architecture of the MOLAR-HRRT reconstruction engine IEEE Nuclear Science Symp. Conf. Record vol 6 pp 3956–60
Karp J S, Surti S, Daube-Witherspoon M E and Muehllehner G 2008 Benefit of time-of-flight in PET: experimental and clinical results J. Nucl. Med.49462–70
Kinahan P, Defrise M and Clackdoyle R 2004 Analytic image reconstruction methods Emission Tomography: the Fundamentals of PET, SPECT (Amsterdam: Elsevier) ch 20, pp 421–42
Moses W W 2003 Time of flight in PET revisited IEEE Trans. Nucl. Sci.501325–30
Moses W W and Derenzo S E 1999 Prospects for time-of-flight PET using LSO scintillator IEEE Trans. Nucl. Sci.46474–8
Moskal P et al 2016 Potential of the J-PET detector for studies of discrete symmetries in decays of positronium atom—a purely leptonic system Acta Phys. Pol. B 47509
Mullani N A, Ficke D C, Hartz R, Markham J and Wong G 1981 System design of fast PET scanners utilizing time-of-flight IEEE Trans. Nucl. Sci.NS-28104–8
Mullani N A, Gaeta J, Yerian K, Wong W H, Hartz R K, Philippe E A, Bristow D and Gould K L 1984 Dynamic imaging with high resolution time-of-flight PET camera—TOFPET I IEEE Trans. Nucl. Sci.31609–13
National Electrical Manufacturers Association 2012 Performance Measurements of Positron Emission Tomographs NEMA Standards Publication NU 2-2018 (Rosslyn, VA: National Electrical Manufacturers Association) (https://www.nema.org/Standards/Pages/ Performance-Measurements-of-Positron-Emission-Tomographs.aspx)
Nemallapudi M V, Gundacker S, Lecoq P, Auffray E, Ferri A, Gola A and Piemonte C 2015 Sub-100 ps coincidence time resolution for positron emission tomography with LSO:Ce codoped with Ca Phys. Med. Biol.604635–49
Pépin A, Stute S, Jan S and Comtat C 2012 Normalization of Monte Carlo PET data using GATE IEEE Nuclear Science Symp. Conf. Record pp 4196–200
Popescu L M, Matej S and Lewitt R M 2004 Iterative image reconstruction using geometrically ordered subsets with list-mode data IEEE Nuclear Science Symp. Conf. Record vol 6 pp 3536–40
Shepp L A and Vardi Y 1982 Maximum likelihood reconstruction for emission tomography IEEE Trans. Med. Imaging1113–22
Siddon R L 1985 Fast calculation of the exact radiological path for a three-dimensional CT array Med. Phys.12252–5
Snyder D L 1981 A mathematical model for positron-emission tomography systems having time-of-flight measurements IEEE Trans. Nucl. Sci.283575–83
Snyder D L and Politte D G 1983 Image reconstruction from list-mode data in an emission tomography system having time-of-flight measurements IEEE Trans. Nucl. Sci.301843–9
Spanoudaki V C and Levin C S 2011 Investigating the temporal resolution limits of scintillation detection from pixellated elements: comparison between experiment and simulation Phys. Med. Biol.56735–56
Suljic A, Tomse P, Jensterle L and Skrk D 2015 The impact of reconstruction algorithms and time of flight information on PET/CT image quality Radiol. Oncol.49227–33
Surti S 2015 Update on time-of-flight PET imaging J. Nucl. Med.5698–105
Surti S, Kuhn A, Werner M E, Perkins A E, Kolthammer J and Karp J S 2007 Performance of Philips Gemini TF PET/CT scanner with special consideration for its time-of-flight imaging capabilities J. Nucl. Med.48 471–80
Thielemans K, Cuplov V and Thomas B A 2015 Multi-threaded image reconstruction of 3D PET sinogram data with STIR Fully 3D Conf. (Newport, RI, USA)
Thielemans K, Mustafovic S and Tsoumpas C 2006 STIR: software for tomographic image reconstruction release 2 IEEE Nuclear Science Symp. Conf. Record vol 4 pp 2174–6
Thielemans K, Tsoumpas C, Mustafovic S, Beisel T, Aguiar P, Dikaios N and Jacobson M W 2012 STIR: software for tomographic image reconstruction release 2 Phys. Med. Biol.57867–83
Thoen H, Keereman V, Mollet P, Van Holen R and Vandenberghe S 2013 Influence of detector pixel size, TOF resolution and DOI on image quality in MR-compatible whole-body PET Phys. Med. Biol.586459–79
Tomitani T 1981 Image reconstruction and noise evaluation in photon time-of-flight assisted positron emission tomography IEEE Trans. Nucl. Sci.NS-284581–9
Wagner R F and Brown D G 1985 Unified SNR analysis of medical imaging systems Phys. Med. Biol.30489
Westerwoudt V, Conti M and Eriksson L 2014 Advantages of improved time resolution for TOF PET at very low statistics IEEE Trans. Nucl. Sci.61126–33
Wong W-H, Mullani N A, Philippe E A, Hartz R and Gould K L 1983 Image improvement and design optimization of the time-of-flight J. Nucl. Med.24 52–60