I
j
1~1
I I 11:
I
I
i:
11
'1,
I
I I .
.
I
I' I
I
'
I I I
1,
Disease, Treatment and Health
Behaviour in Sri Lanka
by
Indrani Pieris
A thesis submitted for the degree of Doctor of Philosophy of The Australian National University.
I I!
!
I
I:
'
I
II
i
1·'
I
I
I
I
~
p
J
I
Declaration
Except where otherwise indicated this thesis is my own work.
,j
I
'r
I
I
j
II
I I
I•
,,
I
I
'I
I I
Dedication
I dedicate this thesis to my parents: K. Kamalawathie and Chandrasena
· Pieris whose own actions and care gave me a deep understanding .of many
I
I
,1
I
I
'
II'
11
I,
i I
I
'
'
I
I
'
I
I I
I I
' I
I
i
II
I
I I I
•
lV
Acknowledgements
I wish to thank all those involved in various ways in carrying out the Sri Lankan Demographic Change Project: at the Demographic Training and Research Unit Dr. Indra Gajanayake (now at the Australian Department of Human Services and Health) and Mr. Lakshman Dissanayake, and at the Australian National University Department of Demography Professor Jack Caldwell, Mrs. Pat Caldwell, Dr. Bruce Caldwell, Dr. Guruswamy (now at the International Institute of Population Studies, India) and Mrs. Wendy Cosford. Thanks are also due for our two interviewing teams: in 1985, Bhadra, Chandra, Hema, Kalyani; Kamani, Karuna, Kumari, Mallika, Nimali, Padmini, Pushpa, Ramani, Rathna, Sudharma, Suneetha, Vineetha and Wanni and in 1987 in addition to Sudharma, Chandani, Chinta, Gerty, Jennifer, Mallika, Padmini, Ratnayake, Sandya, Sita, Swarna, Thilak and Wimal. I am also very grateful to all the people in our research areas: Bondupitiya, Loluwagoda, Maligawatta, Jumma Masjid Road, New Kelani Bridge (Sedawatta), Nugegoda, Welisara and Rahatungoda Tea Estate for their kind co-operation in our long hours of talking.
I acknowledge the generosity of the Director, Department of Census and Statistics, Sri Lanka, Mr. R.B.M. Korale, for allowing me to use the Sri Lankan Demographic and Health Survey (SLDHS) data set. I am also very thankful to Dr. Gaminiratne for his valuable advice in the analysis of the SLDHS data.
:
i
I
I
ii
I j
I
I I I I
I
I /
I
I
I
i
I I
I I
'
I
I
I
/,
J.•
,,
I
V
given to me through regular discussions, especially valuable at a time when I had the added burden of being a new mother. I am also extremely grateful to my present supervisor Dr. Habtemariam Tesfaghiorghis for his valuable advice and suggestions throughout my writing, reading several drafts of my chapters and carefully scrutinizing the final production of my thesis. Dr. Alan Gray, my adviser, who read the final draft of my thesis and provided valuable comments on how the thesis could be improved, is gratefully acknowledged.
I am especially grateful to Ms. Wendy Cosford for her invaluable assistance and advice through all stages of the thesis.
In the Demography Program, RSSS, I wish to thank Mr. Gavin Langmuir for his assistance with computing, and Chris Patterson, computer programmer in NCDS also deserves my thanks. Jill Jones, former programmer in Demography, is also gratefully acknowledged for her advice on preparing graphs. Thanks to Milisa for her assistance in various matters during my stay in the Demography.
My period as a student at 20, Balmain Crescent, was made particularly enjoyable by the company of my colleagues: Aree, Arif, Narti, Prakash and Rossarin. Thanks to you all for being such good friends and for being there to discuss any problems. I should also thank Ms. Stephanie Fadini for her active interest in us.
I wish also to thank Colin and Grahame for their encouragement. I would like to thank Latha Pieris for looking after Chrishan when I needed to attend to urgent work.
I
I
I
I
I
r
'j
I
~' '
I
D
I
I I!
I
I
I
,,
'
I
l
I
,.I
I
VI
Abstract
This thesis applies the health transition theory to understanding Sri Lanka's transformation from a society marked by very high mortality to one noted for its extremely impressive health status. The primary data source used is the Sri Lankan Demographic Change Project (SLDCP), 1985 and 1987, which involved a combination of structured interviews, and unstructured in-depth interviews with family members including special interviews with older women on changes in health behaviour. The project was conducted in rural, urban and estate sites, and covered the three major communities in Sri Lanka, the Sinhalese, Tamils and Moors. Comparisons are also made with the data from the Sri Lanka Demographic and Health Survey, 1987.
Sri Lankans' health behaviour has played a critical role in Sri Lanka's health transformation: they have responded very effectively to a comprehensive public health system. The new health system was accepted despite being based on concepts totally different from earlier indigenous health notions. While the two health systems differed in their understanding of illness, they did not conflict as both were based on a practical and secular approach to illness and treatment.
I
,I
l
'l
11
I
IE
I
i
I,
,,
I
I
:
,,
I I
i
I,
II
l '
'
I
..
Vll
I
I
I
n
,,
I
I
,'
I
II
I•
I
•
I,
I
I
Acknowledgements Abstract
List of Tables
List of Figures and Maps
Contents
Chapter 1 Introduction
IV Vl Xlll XVlll
1
1.1 Introduction 1
1.2 Background to the study 1
1.3 Theories of mortality decline 4
1.4 Health transition theory in the context of Sri Lanka 9
1.5 The role of health services in Sri Lanka's mortality decline: a
literature review 13
1.6 Causes of high mortality and mortality decline 15
1.6.1 Famine and malnutrition 16
1.6.2 Cholera epidemics 18
1.6.3 Poor sanitation 19
1.6.4 Lack of prenatal and postnatal care, and infant and
maternal mortality 22
1.6.5 Improper infant feeding practices 25
1.6.6 Malaria 27
1. 7 Social change and mortality 31
1.8 Health, disease, and illness : a definition 33
1.9 Objectives of the study 36
1.10 Organization of the study 37
Chapter 2
Present health services in Sri Lanka 39
2.1 Introduction 39
2.2 Sri Lanka's health care system 39
2.3 Development of the natural health system in Sri Lanka 40
2.5 Natural healing system: the theory of disease causation 44
2.5.1 Cure for the diseases of three humours 45
2.6 Supernatural agents as causes of illness 46
2.6.1 Tackling the supernatural agents 49
2. 7 The development of modern health facilities 51
2.8 Self-treatment 54
2. 9 The place of the indigenous health system within the overall
health system. 55
2.10 Why Sri Lankans seek help from distinctly different systems
of medicine 56
2.11 Summary and conclusion 63
Chapter 3 Description of survey methodology and
study areas
65
3 .1 Sources of Data
3.2 Objectives of SLDCP and SLDHS
3.3 The SLDCP approach to data collection 3.3.1 The choice of micro approach
65
66
66 66
I I 1111 ' I '· I ' Ii
I·
I II :
I
I•
I I,
•
I,
3.4· The sample
3.4.1 SLDCP survey respondents
3.4.2 The questionnaire and definitions 3.4.3 In-depth interviews
3.4.4 Coding and data processing 3.5 Undertaking the project
3.6 Data quality
3. 7 The SLDCP research areas and its people 3.7.1 Housing and sanitation
3. 7 .2 Transport
3. 7 .3 Education
3.7.4 Women in the SLDCP research areas 3.8 The SLDHS sample
3.8.1 Sample design
3.8.2 Households and respondents of SLDHS 3.8.3 The questionnaire
3.8.4 Field staff and training 3.8.5 Quality of SLDHS data
3.9 Socio-economic characteristics of respondents in SLDHS in comparison with the SLDCP
3.10 Summary
Chapter4
Disease and treatment in Sri Lanka
68 71 71 72 73 73 75 79 83 87 87
89
90 91 92 92 93 94 94 9596
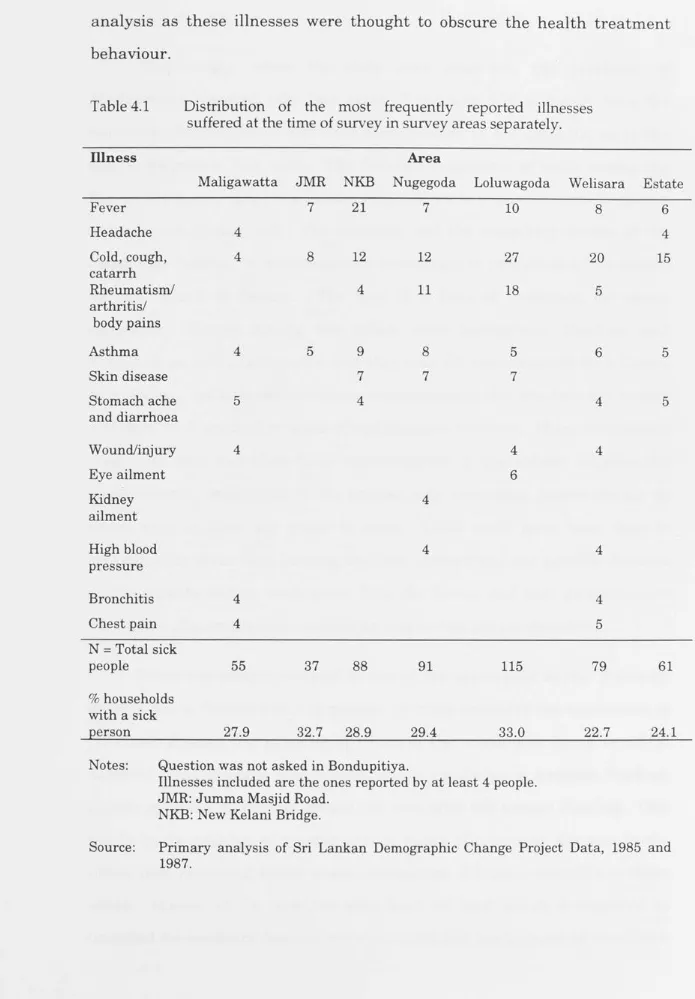
4.1 Introduction 96
4.2 Diseases in study areas 97
4.3 Treatment 100
4.4 Distance to and cost of different health services in survey areas 107
4. 5 Influence of the concept of illness on the use of health services
in South-West Sri Lanka. 110
4.5.1 Type of treatment and the nature of disease in study areas
4.6 Demographic and socio-economic differentials in health behaviour
4.6.1 Demographic variables affecting treatment 4.6.1.1 Effect of age on treatment
4.6.1.2 Sex differentials in treatment 4.6.2 Socio-cultural differentials
4.6.2.1 Place of residence and treatment 4.6.2.2 Effect of religion on treatment
4.6.2.3 Education and the use of treatment 4. 7 Health seeking process in Sri Lanka
4.8 Reasons for changing treatment
4.9 Family structure and decision making 4.10 Summary and conclusion
Chapter5 Pr,_eve"{ltive health
cqre
P.rc,,ctices
arrecting women and cliildren
5.1 Introduction
5.2 Can infant and child deaths be prevented in Sri Lanka? 5.3 Care of the mother in the prenatal period
5.3.1 Antenatal care of pregnant women in Sri Lanka 5.3.2 Diet during pregnancy
I
I I
5.4 The process of birth 167
5.4.1 Place of delivery 168
5.4.2 Assistance at delivery 175
5.4.3 Why estate women decline to use hospital facilities 177
5.4.3 Treatment of mother in the postnatal period 180
5.5 Patterns of infant feeding and child health 183
5.5.1 Commencement of breastfeeding 184
5.5.2 Duration of breastfeeding 190
5.5.3 Supplementary feeding of infants 193
5.6 Immunization of infants and children 200
5.6.1 Types of immunization 201
5.7 Summary and Conclusions 205
Chapter6 Cha11giftg repro.ductiv.J! -afld child health
care 6ehaviour in Sri Lanka
210
6.1 Introduction 210
6.2 Changes in birth practices 211
6.2.1 Antenatal care 211
6.2.3 Birth attendants 230
6.3 Changes in child health care 235
6.3.1 Immunization 235
6.3.2 Changes in infant feeding practices 239
6.3.2.1 Breastfeeding 239
6.3.2.2 Supplementary feeding 242
· 6.3.2.3 · Patterns of infant feeding and sex of child 246
6.3.2.4 Mother's education and infant feeding practices 24 7
6.4 Changes in health behaviour: the experience of the old 248
6.4.3 Causes of good hygiene in the research area 257
6.5 Summary and conclusion 261
Chapter
7
Conclusion
7.1 Introduction
7 .2 Summary of findings 7 .3 Conclusion
7 .4 An overview
References
268
268 269
276
286
I
I
'
I I
j
•
I I
I !
•
'
'
I
r
I
I I
' I
r:
I
I
I
'
I
I
Xll
Appendices
308
2.1 Mortality statistics (1901-1990) and expectation of life
at birth (1893-1991) in Sri Lanka 308
4.1 Grouping of illness 309
4.2 Proportion sick at the time of survey with specific
diseases by residence 311
4.3 Households keeping modern and traditional home medicine at time of the survey and their use in
the study areas ( % ) 312
5.1 Mean ages at which solid supplements were introduced
in all survey areas - an analysis of variance 314
5.2 Mean ages at which solid supplements were introduced by mothers education and residence - an analysis of
variance 315
6.1 Types of antenatal care used by mothers' age
education and residence(%) 317
6.2 Types of antenatal care used, by year of birth of
children and residence(%) 318
I
I
'j,
Il
IIf I
I 'I I ' I I I I I D I I /i I I
I I
I I I 111
'
{r
I
I I
i
Ii
j
I
( XlllList of Tables
Table 1.1 Mortality indicators and per capita income for selected countries2
Table 1.2 Trends in mortality measures and expectation of life at birth in
Sri Lanka. 14
Table 1.3 Selected food imports to Ceylon (Sri Lanka), 1870-1932 (cwt per
million population) 17
Table 1.4 Comparison of age-specific mortality rates per 1000 population
in the famine year (1974) and in a normal year (1973), the
estate sector of Sri Lanka. 18
Table 1.5 Neonatal and post-neonatal mortality per 1,000 live births in
the estate sector and in the rest of Sri Lanka, 1972-1976. 18
Table 1.6 Cholera deaths in Sri Lanka, 1841-1950 19
Table 1.
7
Death rate per 1000 from all diseases, diarrhoeal diseases,and hookworm on estates and Colombo
Table 1.8 Number of midwives and maternal death rate in Sri Lanka,
Colombo and the estates
Table 1.9 Development of Health Facilities in Sri Lanka, 1926-1981
Table 1.10 Progress in adult literacy in Sri Lanka, 1871-1981 .
Table 2.1 Growth of Western medical system in Sri Lanka, 1945-1990
Table 2.2 Modern and indigenous physicians, institutions and patients
treated in Sri Lanka, 1986
Table 3.1 Religious distribution of SLDCP and Sri Lanka (Per cent)
Table 3.2 Ethnic and religious distribution of households in SLDCP
research areas.
Table 3.3 Percentage distribution of households by type of sanitary
facilities in SLDCP survey areas.
Table 3.4 Per cent distribution of children aged 6-14 who ever attended
school, never attended and still attending school at the time of survey, in SLDCP research areas.
I
I
i
)
I
Ill i,
II
I I
!
I
I
Ir
'
11
I
I
I!
"
r,
'I
I
I
I
'
Table 3.5
Table 3.6
Table 4.1
Table 4.2a
Table 4.2b
Table 4.3
Table 4.4
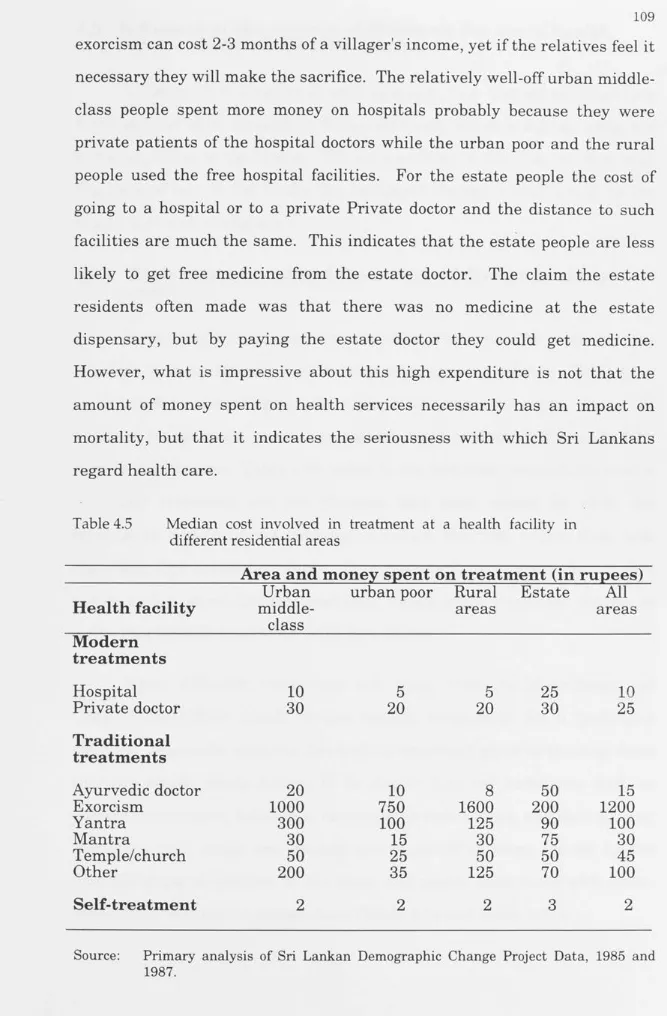
Table 4.5
XIV
Percentage distribution showirig socioeconomic characteristics of women aged 15 and over in SLDCP, 1985 and 1987. 90 Socio-economic characteristics of respondents of SLDHS and
SLDCP. 95
Distribution of the most frequently reported illnesses suffered at the time of survey in survey areas separately. 98 Number and percentage of visits to different health services for the treatment of sick persons at the time of interview, in
grouped survey areas. 101
Number and percentage of visits made by households to different health services for the treatment of sick persons during the last four weeks preceding the interview,
1n survey areas.
Distribution of the sick who did not receive any treatment by 102
age, sex and area of residence 105
Median distance travelled (in kilometres) to a health facility
in grouped survey areas 108
Median cost involved in treatment at a health facility in
different residential areas 109
Table 4.6a Type of first treatment given to those sick at the time of survey with specific diseases, all ages, male and female 111 Table 4.6b Type of illnesses for which different treatments were used, by
last use in all survey areas, all ages, male and female 112 Table 4.7 Types of first and successive treatments given for the sick in all
survey areas at the time of interview 115
Table 4.8 Percentage distribution showing illness and treatment of last
person sick by age group, in all survey areas. 119
Table 4.9 Percentage distribution in treatment of illnesses of last sick
person in household by sex in all survey areas, all ages. 122 Table 4.10 Numbers and proportions of commonly reported illnesses of
children aged five and under, by type of first treatment and
'
(I
I I
I
I
I .1 L
D
I
I
I !
1,
I ' I
I
I
,·,
I
,,
I
'
I
xv
Table 4.11 Percentage distribution showing how illnesses are treated in
different survey areas. 125
Table 4.12 Percentage distribution of types of self-treatment used for the last sick person as the first treatment in grouped survey areas127
Table 4.13 Percentage distribution of treatments used for selected illnesses
of last sick person in a household by religion. 129
Table 4.14 Percentage distribution of treatment for specific illnesses by
education of the respondent, all survey areas. 131
Flow-chart 1 Order and nature of treatment of fever 136
Flow-chart 2Order and nature of treatment for cold/cough/catarrh 137
Flow-chart 3Order and nature of treatment for rheumatism 138
Flow-chart 4Order and nature of treatment for other respiratory illnesses.141
Flow-chart 5Order and nature of treatment of disease of circulatory system142
Flow-chart 6Order and nature of treatment of mental and psychological
diseases 142
Table 5.la Causes of mortality for children aged under one year by place
of residence, SLDCP 1985 and 1987 (per cent). 157
Table 5.lb Causes of mortality for children aged 1-4 years by place of
residence, SLDCP 1985 and 1987 157
Table 5.2 Percentage distribution of mothers with children under five
years of age by type of antenatal care received, and residence
in SLDCP and SLDHS. 162
Table 5.3 Place of delivery of children under age 5 according to mothers'
residence 170
Table 5.4 Comparison of type of birth attendant according to residence
in SLDCP and SLDCP Surveys. 176
Table 5.5a Mean duration of breastfeeding in months, children born in the last three years before survey by selected characteristics
of the mother, in SLDCP survey. 191
I I Table 5.5b Mean age (in months) of breastfeedinga by mother's education
II
l I
If
11
I
I
I
ii
I
1
:.
I
11 1,1
I
XVI
Table 5.6 Mean age (in months) at which supplementary food was given
by mother's education in all areas in SLDHS. 194
Table 5.7a Age at which breastfeeding was supplemented, by mother's
education, urban middle-class (per cent) 195
Table 5. 7b Age at which breastfeeding was supplemented, by mother's
education, urban poor areas (per cent) 195
1i Table 5.7c Age at which breastfeeding was supplemented, by mother's
,.I
' /
I
I
I
I
'
I :
I
i
a
I
r
1 education, rural areas (per cent) 196
Table 5. 7 d Age at which breastfeeding was supplemented, by mother's
education, estates (per cent) 196
Table 5.8 Mean age at which breastfeeding was supplemented with solids, by mother's education in all areas (per cent)
Table 5.9 Percentage of children under age five years who received
198
different types of liquid and solid supplementary foods by area.200 Table 5.10a Type of immunization received by children under five years
by residence (per cent) 202
Table 5.10b Type of immunization received by children under five years
by residence, SLDHS 1987 (per cent) 203
Table 6. la Percentage distribution of births by mother's age group, type
of antenatal care received and residence. 213
Table 6. lb Percentage distribution of births by mother's education,
types of antenatal care and residence. 214
Table 6.2a Per cent distribution of births by place of birth, mother's age
and residence 224
Table 6.2b Percentage of mothers in each educationalcategory by place
of childbirth and residence 226
j Table 6.3a Births by type of birth attendants and woman's residence (%).231
I I
'
h·
Table 6.3b Home births by type of birth attendants (% ).
Table 6.3c Birth cohorts of child by type of birth attendant(%). Table 6.4 Children aged 20 years or less immunized as infants, by
current age and residence(%).
232 234
I
I
I j, I
I,
I
I~ I
I I
XVII
Table 6.5 Children immunized in each age group by type of
immunization, current age and residence(%). 238
Table 6.6 Births by initiation of breastfeeding, current age of mother
and residencea (% ). 240
Table 6. 7 Types of food given to babiesa before breastfeeding began,
by mother's age and residenceb (%). 242
"j Table 6.8 Mean age (in months) when breastfeeding first supplemented,
i
,.1
j;
Ill '
l !
,,
I
I
I
1 by current age of child and residence. 243
Table 6.9 Mean age (in months) when solids were introduced, by current
age of child and residence. 244
Table 6.10 Mean duration (in months) of breastfeeding of children who were not being breastfed at the time of survey by current age
of child and residence. 246
Table 6.11 Do young women look after their children's health differently
from former times? (%) 249
Table 6.12 Older women's views on young mothers' child care (first
response only)(%). 250
Table 6.13 Older women's reasons for changes in child health care (first
response only)(%). 252
Table 6.14 Whether young children are less likely to die(%). 256 Table 6.15 Old women's reasons for infant mortality decline (first
response only)(%). 257
Table 6.16a Ways in which village life has become more hygienic as
perceived by older women (first response)(%). 258
Table 6.16b Older women's second response on how village life has become
XVlll
1l
List of Maps and Figures
·1
I
Map 3.1
r1 Map of Sri Lanka indicating Sri Lankan Demographic Change
Project field sites 70
Figure 6.la
I
Percentage of mothers aged 15-39 years by type of antenatal
care used and by education: Urban middle-class 217
~I,
1, I
Figure 6.lb Percentage of mothers 40+ years by type of antenatal care
used and by education: Urban middle-class 217
I I
I
Figure 6.2a Percentage of mothers aged 15-39 years by type of antenatal
care used and by education: Rural 218
I
Figure 6.2b Percentage of mothers 40+ years by type of antenatal care
used and by education: Rural 218
I,
D
Figure 6.3a Percentage of mothers aged 15-39 years by type of antenatal
care used and by education: Estate 219
Figure 6.3b Percentage of mothers 40+ years by type of antenatal care
used and by education: Estate 219
I
I
I! Figure 6.4a Percentages of total births by type of antenatal care used and
birth cohort - Urban middle-class 221 I
Figure 6.4b Percentages of total births by type of antenatal care used and
birth cohort - Rural 221 I
'
Figure 6.4c Percentages of total births by type of antenatal care used and
birth cohort - Estate 222
I
Figure 6.5a Percentages of children born at home and hospital by birth
cohort - Urban middle-class 228
,·,
I
Figure 6.5b Percentages of children born at home and hospital by birth
cohort - Urban middle-class 229
I
Figure 6.5c Percentages of children born at home and hospital by birth
cohort - Urban middle-class 229
I
l
I I
1 ,
I
l I
I
I!
J
I
,j
I
f
I
1 I I
I
I
I
J i
I
/
I
a
I
'I
'I
I
' '
I,
h
I
I
I I
Chapter 1
Introduction
"Of all Gain, the Gain of Health is the Highest and the Best"
(Lord Buddha)
1.1 Introduction
1
Unprecedented mortality transition around the world has been a central feature of this century. During the period 1950 to 1990, average life expectancy increased by 10 years (from 66 to 76 years) in developed countries and by about 21 years (from 42 to 63 years) in less developed countries (Murray and Chen, 1993: 143). The mortality experience differs among countries in terms of magnitude, but in all, the achievement has l;>een remarkable. This thesis examines the important research question of how a very poor country, Sri Lanka, has managed to achieve very low levels of mortality with only a moderate expenditure on health. The issue is examined by focusing on the important but neglected contribution made by social and cultural factors in influencing people's health behaviour.
1.2 Background to the study
I
I I I I I I l Ii '
I I I I I ' I
I:
I I ' I.I I I
,,
I
2
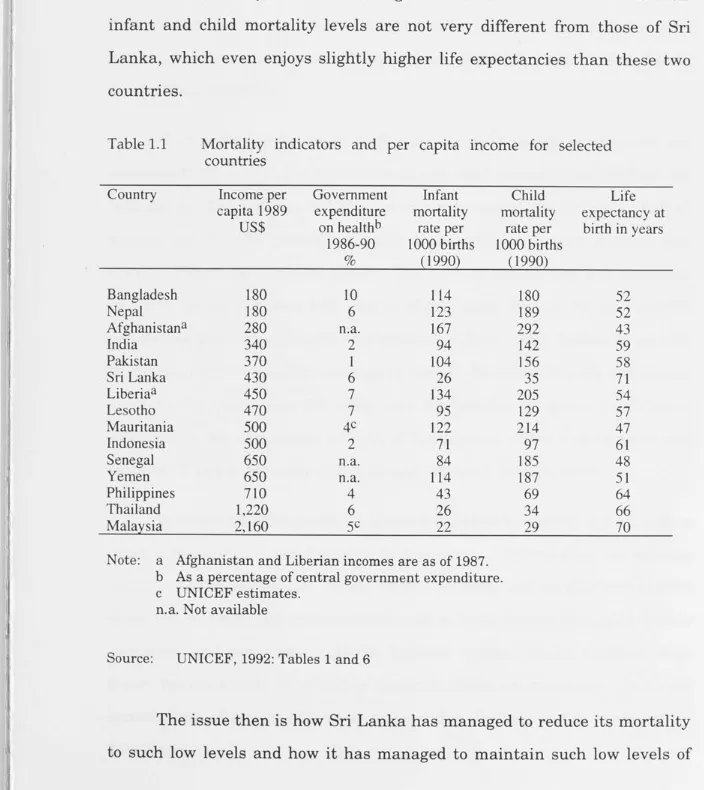
[image:19.788.17.721.293.1083.2]Sri Lanka's present mortality level is very low compared with other countries in the South Asian region. These countries, in terms _ of GNP per capita, are poorer than Sri Lanka, but even when compared to similar or even high-income developing countries, for example Liberia, Lesotho, Mauritania, Indonesia, Senegal, and the Philippines, Sri Lanka has low infant and child mortality and very high life expectancy (Table 1.1). Thailand and Malaysia have much higher incomes than Sri Lanka but their infant and child mortality levels are not very different from those of Sri Lanka, which even enjoys slightly higher life expectancies than these two countries.
Table 1.1 Mortality indicators and per capita income for selected
countries Country Bangladesh Nepal Afghanistan a India Pakistan Sri Lanka Liberiaa Lesotho Mauritania Indonesia Senegal Yemen Philippines Thailand Malaysia Income per capita 1989 US$ 180 180 280 340 370 430 450 470 500 500 650 650 710 1,220 2,160
Government Infant expenditure mortality
on hea]thb rate per 1986-90 1000 births
% (1990)
10 114
6 123
n.a. 167
2 94
1 104
6 26
7 134
7 95
4c 122
2 71
n.a. 84
n.a. 114
4 43
6 26
5c 22
Note: a Afghanistan and Liberian incomes are as of 1987.
Child mortality rate per 1000 births (1990) 180 189 292 142 156 35 205 129 214 97 185 187 69 34 29
b As a percentage of central government expenditure. c UNICEF estimates.
n.a. Not available
Source: UNICEF, 1992: Tables 1 and 6
Life expectancy at
birth in years
52 52 43 59 58 71 54 57 47 61 48 51 64 66 70
I
I
ii
'j
I,
11
I
j
I
'
I I
I
J !
I
I
'
~, I
I
I
I '
"'
I
I
•
3
mortality and high life expectation. The answer is not that Sri Lanka spends a particularly high proportion of its total budget on health; in 1986/87 only 5 per cent of the central government's expenditure was allocated to health (UNICEF, 1990: Table 6; World Bank, 1992). Ratios relating health infrastructure to population are less favourable than in some other developing countries. For example, countries such as Ghana, Zambia, Philippines, Thailand, Brazil, Paraguay and Turkey have more doctors and nurses per head than Sri Lanka, yet have higher infant and child mortality and a shorter life expectancy (UNICEF, 1992: Table 1; World Bank, 1988: Table 29).
Within Sri Lanka, areas with easy access to health services are not necessarily those with the lowest infant and child mortality and highest life expectancy. For instance in 1988 the country's capital city, Colombo, had 46 doctors per 100,000 population while Kurunegala, a remote district, had only 16 doctors per 100,000 people. The ratio of paramedics and midwives in Colombo district was 157 and in Kurunegala district 93 per 100,000 people (see Ministry of Health and Women's Affairs, 1990: Tables 10 and 28, for original figures used for estimating ratios). However, the life expectancy at birth for males was 64 years and for females 70 years in Colombo whereas the life expectancy at birth of Kurunegala males was 68 years and females 73 years (Ministry of Health and Women's Affairs, 1990).
I
' '
l,
I I
I
I
'
Iii
I
I,
I
I
I '
II
I
I I
4
1.3 Theories of mortality decline
Researchers have put forward many theories to explain how and why mortality has declined in both developed and developing countries, without any theory being fully accepted. McKeown and colleagues attributed the mortality decline in England and Wales to improved living standards through increased income. Much of the evidence for a relationship between improved standard of living and mortality decline comes from developed country experience (McKeown and Brown, 1955; McKeown and Record, 1962; McKeown, Record and Turner, 1975) but in recent times this theory has also been tested for developing countries (J ayachandran and Jarvis,
1986; and Bhuiya,Wojtyniak and Karim, 1989).
McKeown and his colleagues (1955, 1962, 1975) argued that, in the nineteenth century, in England and Wales mortality declined well before the introduction of modern medical technologies; and they attributed the change in mortality to improved economic and social conditions. Rising standards of living contributed to personal cleanliness: use of washable clothing and use of soap; and through the provision of clean water, and efficient sewage disposal systems, sanitary reforms controlled many diseases that had caused high mortality (McKeown and Record, 1962: 95-97). Improved mortality in twentieth-century England and Wales was documented by McKeown et al. (1975: 407-422) as the result of the decline in three categories of disease: airborne, food or water-borne, and others. Airborne infectious diseases were associated with 45.3 per cent of the reduction of mortality from all causes and McKeown et al. (1975) argued that this reduction was brought about by higher per capita income and food intake, and improved nutritional status.
Ii
·1
1,,
Ill , I', I
l
; D
,
I:
J
I
I
,~
I ' I I I
5
technology is responsible for the mortality decline argue that even where the incomes are lower advanced health technology can bring mortality levels down (Davis, 1956; Preston, 1975, 1980, 1985; Da Vanzo and Habicht, 1986; DaVanzo, 1988). Preston (1975: 238-239) examined the relationship between life expectancy and income during the period 1930 to 1960 using a regression analysis of 30 countries. He found that income had little effect on the gain in life expectancy. He attributed over 80 per cent of the gain in life expectancy to advances in medical technology (Preston, 1975: 243-244). In a later study, Preston (1980) compared data from a large sample of countries for 1940 and 1970. The variables included were life expectancy, per capita income, daily calorie consumption and literacy. He showed that 50 per cent of the mortality decline in the less developed countries was due to structural changes (Preston, 1980: 304-307). The importance of structural changes in mortality decline has also been demonstrated in the case of Malaysia (Da Vanzo and Habicht, 1986; Da Vanzo, 1988).
A number of writers have stressed the importance of access to health services (Cleland, 1989; Fosu, 1989; Basu, 1990). The important factors here are the distribution of availability of services, the affordability of services, and the behaviour and practices of health care providers. These are undoubtedly all very important factors in the achievement of improved health, reduced morbidity and mortality, and, as is noted below, have been vital to Sri Lanka's health transition. These three factors are all on the supply side; what is equally important is the demand side and, in particular, the health seeking behaviour of the clients.
'
,,
ii
r
,II{
:
I I
I I I I
'
I
I I!
I
I
I
I
I I
I
_ , ,
I
6
for all by the year 2000. The conference aim was to find out how a number of low-income countries, Sri Lanka, China, Costa Rica and Kerala (State of India), had achieved good health. Emphasis was placed on social, political, economic and cultural factors in the achievement of good health (Halstead, Walsh and Warren, 1985). Nations (1985) stressed in particular the relevance of cultural factors in child health in Sri Lanka, Kerala, China and Costa Rica. Since the conference a number of researchers have tried to identify the cultural and behavioural mechanisms through which the broader political and social factors, discussed at the 'Good Health at Low Cost' conference, operate to produce good health.
Caldwell ( 1986) has argued using evidence from Sri Lanka, Costa Rica and Kerala that key sociocultural factors including the autonomy of women, political awareness which demanded the right to services, equality of intra-household food distribution and social policies to provide a minimum level of nutrition to the whole population, have combined with strong government expenditure on health and education, easily accessible health services, universal immunization, and widespread antenatal and postnatal medical care to improve health. A number of writers using evidence from India have indicated how the cultural background of people, particularly of women, has influenced health behaviour and affected health status (Basu, 1990; Visaria, Anandjiwala and Desai, 1990; Reddy, 1990; Sushama, 1990).
I
I
'
I 11
1 I
I
I
' Ii
I
I I,
I
I
I
I
J ;
I
~'
'
7
example, illnesses are often attributed to causes such as bodily imbalance and the influence of supernatural beings.
The effect of health-related behaviour on mortality has been examined in the context of developed countries by Woods, Watterson and Woodward (1989), Ewbank and Preston (1990) and Preston and Haines (1991). Woods et al., (1989: 116-119) argue that in England and Wales changes in attitudes towards breastfeeding of infants and fertility regulation contributed to mortality decline. Similarly Ewbank and Preston (1990: 120-123) found that in the United States such simple preventive measures as breastfeeding of babies, hand washing before preparing meals, isolating the sick, boiling milk and water, cleaning babies' bottles and keeping flies away from milk and other fo0d were major factors in the mortality decline. Ignorance of such simple preventive measures was responsible for the unfavourable mortality conditions experienced by the professional and urban groups in comparison to the lower social-class groups in the United States in 1900, which is the direct opposite of the developing country situation today (Preston and Haines, 1991: 198-205).
Recently all three theories described above have been criticized for being incomplete and insufficient, and lacking subtlety. Murray and Chen (1993: 149) argue that the existing theories ignore the contributions of the other theories, and have too short a time-horizon, that is the earlier theories consider only the short-term effects of income or technology or behaviour on mortality changes. Consequently, all these theories have failed to explain why mortality continues to decline even through short-term disruptions such as economic downturns. Murray and Chen have speculated on what they call an 'assets approach', which takes into account aspects of all three former theories and will explain the interactive role of income, technology, and behaviour. This, they argue, would, unlike existing theories, allow the
I
,I
'j
I,
1
I
1,'
1,
1 I
I
I
I
I
'
I
I
I !
I
'
'
'
I
•
I
I
I
8
consideration of the accumulated effect of health and social assets on the long-term mortality changes.
While Murray and Chen are right to state that a comprehensive theory of mortality decline cannot ignore the contributions of all theorists, this is not very different from what is suggested by many of those emphasizing the importance of changes in behaviour, or what is known as the health transition. Caldwell (1986 and 1992), for example, argued that in Sri Lankan and Keralan societies where favourable social characteristics such as female literacy, female autonomy, egalitarian social traditions and comprehensive local health systems prevail, mortality began to decline only after the introduction of modern health services. This was because people were educated and independent, and prepared to use them effectively.
Apart from Caldwell's (1986) short account based on secondary sources, and Caldwell and colleagues' (1989, 1990) discussions, no detailed analysis of the causes of mortality decline in Sri Lanka has considered the contribution of social and cultural factors. Following the analysis of the causes of mortality decline in England and Wales by McKeown and Record (1962) and McKeown et al. (1975), Meegama (1967, 1969, 1980, 1981) focused on the effect of modern health services and improved standard of living on mortality decline in Sri Lanka. The well developed health sector in Sri Lanka has undoubtedly been an essential factor in the country's favourable conditions of health, especially in its low infant and child mortality. It was particularly effective because the type of health services offered were not of a high-technological nature but more pragmatic, inexpensive, grass-roots-level primary health care involving local health workers . However, the dramatic nature of its impact requires the consideration of other factors including the willingness of people to use the available services, and the approach of individuals to health problems within the family, particularly mothers with regard to their children's
I
,~
'
11
I
, 1 !
'
I
1
.
I·
'
'·I
I
'Il l!
I,
r,
r
.
9
health. The role of social change resulting from widespread education, social reforms and cultural changes has not been thoroughly discussed, nor has the possible influence of the pre-existing traditional medical system on the acceptance of a modern health system been taken into account.
There is a need to examine more closely the health attitudes and behaviour of Sri Lankans to understand the reasons for good health in Sri Lanka. This will make it possible to test the health transition theory using the case of Sri Lanka.
1.4 Health transition theory in the context of Sri Lanka
The determinants of Sri Lankans' health behaviour have been studied by many anthropologists, who however have not attempted to analyse their findings in terms of Sri Lanka's mortality decline (Wirz, 1954; Ames, 1963; Obeyesekere, 1969b, 1975a, 1976; Amarasingham, 1980; Kapferer, 1983; Noten, 1985; Nichter, 1988, 1989; Nordstrom, 1988; Waxler-Morrison, 1988; Wolffers, 1988; Sachs, 1989). These authors have examined the relationship between Sri Lankans', usually Sinhalese, concepts of disease causation and the types of treatment used. Their findings show that Sri Lankans use two different health systems, Western and indigenous, that have mutually exclusive concepts of disease. Most people interpret the causation of disease according to indigenous theory, but that does not undermine their acceptance or trust in the efficacy of Western medical treatment. Obeyesekere (1969b: 137) remarked that
the acceptance or rejection of Western medical cures must however be differentiated from the interpretations of disease. The acceptance of Western medicine does not imply an acceptance of Western theories of disease causation.. . Cures are accepted because they ameliorate the diseased condition, but what brought about the diseased condition is yet another matter.
l
II
l I
I
j I· I
la
I
'
I
l
I
I
_ I
10 Ames (1963) claims that for Sinhalese villagers Western medicine is simply another kind of magic, and just a substitute for the indigenous system of treatment. This implies that Western and indigenous treatments are closely related to Sinhalese ideas concerning disease. Waxler-Morrison (1976) argued that despite rapid social changes through modernization concepts of disease have not changed, even among the middle-class families of Sri Lanka. She noted that the beliefs of causes of illness are not consistent with the treatments they choose and argued that this was because people regarded Western medicine as another form of Ayurvedic therapy, the indigenous system of medicine existing in Sri Lanka. Sachs (1989: 345) concludes from a study of a rural Sinhalese population that
Western medicines are interpreted in the light of popular theories of health, built on Ayurveda, and have already been integrated into thinking about the body, illness and therapy. The mutual confidence of practitioners and patients in the medicines helps prevent the misunderstanding of each other's beliefs from being uncovered. This confidence imbues the medicine with a magic, symbolic aura, giving the practitioners as well as the patients a feeling that they contribute in their way to solving the acute health problem ... Within the therapeutic encounter then there exist two different systems of knowledge through which the effectiveness of these medicines is integrated. The contradictory symbolic meanings of the medicines remain unrevealed, allowing patients and practitioners to communicate in a satisfactory manner.
I
I
'l
I,
11
1 I
I
I
I
I
I
I
I
I
I !
I
E
I'
I
J
11
of body, habit and medicine but empathy and the quality of communication between the practitioner and patient'.
A proper analysis of the mortality transition in Sri Lanka requires an assessment of whether indigenous concepts of health have given way before the efficacy of Western treatment and have consequently become compartmentalized: some illnesses may be seen as suitable for Western medicine, but others not. Alternatively, indigenous health concepts may exist in harmony with Western medical beliefs, people perceiving Western medicine in terms of the concepts of traditional medicine. It is also possible that Western medicine predominates while most Sri Lankans fail to understand it. There is the general question of why one treatment is chosen in one circumstance and another in a different context. A related question which needs to be examined is whether the widespread use of traditional medicine has made the use of modern medicine more efficient by accustoming the people to perceive the need for treatment at an early stage of sickness, and to take further measures if the first treatment does not quickly achieve a cure. There is a need for a proper analysis which considers Sri Lanka's mortality decline in its cultural context, in terms of its people's beliefs and behaviour.
I
I I
J
~ I
'
I
I 'I j
Ji
• i
II
I
I
I
I
I
12
availability of health services, cost of the services, occupation and income to Sri Lankans' health behaviour.
The authors writing about Sri Lankan health behaviour have mostly focused on one group, the rural Sinhalese. Officially 80 per cent of the population of Sri Lanka live in rural areas although some areas designated as rural have urban aspects; the population of Sri Lanka is predominantly Sinhalese and there is also a wide range of choices in treatment available in rural areas. It would be useful, however, to know more about the health behaviour of the minority populations, the Tamils and the Muslims whose indigenous concepts of medicine differ in many ways from those of the Sinhalese, and of the urban and semi-urban population who live in a very different social context and are subject to different influences from those which affect the rural populations .
The influence of the family structure on health decision-making has also been neglected. In traditional extended families, where important decisions are made by their husbands or parents-in-law, women have little control over their children's health. When a child is sick the mother must wait until her husband or mother-in-law decides the child needs treatment (Caldwell, 1989: 106; Caldwell et al., 1990: 538). Such behaviour alters with female education and with changes in family structure, with important implications for the health of the women and their children (Caldwell and Caldwell, 1985 and 1991). It is important to analyse health behaviour at the individual and family level as well as the community level to see if community perceptions affect the way people make decisions about their health.
I
L
i
l
I ~1'
1,
11
m I
l '
J
I
I
'
, ,
' I
'I
I
I
'
13
have focused on health behaviour but mostly in terms of how modern health treatments are reconciled with indigenous concepts of disease and health treatment. They have not looked at the overall factors affecting health behaviour and how health behaviour has contributed to the mortality decline. An exploration of this area is the aim of this thesis. The following sections review the literature on the role of medicine on Sri Lanka's mortality decline, and anthropological evidence in Sri Lankan health behaviour.
1.5 The role of health services in Sri Lanka's mortality
decline: a literature review
In Sri Lanka mortality levels began to fall in the 1920s, and this decline accelerated after 1945 (see Table 1.2). Mortality rates seemed to increase after 1900 but Sarkar argued that this was an artefact of improved registration (Sarkar, 1957: 22). Although there has been a vital registration system in Sri Lanka since 1867, the coverage of vital events was poor until the middle of the twentieth century. In 1953, when an investigation was carried out to test the completeness of birth and death registration, the registration of births was found to be 88.1 per cent complete and the death registration 88.6 per cent complete (United Nations, 1976: 378-379). It has been estimated that in 1967 the registration of births in the country was 98.7 per cent complete and the registration of deaths was 94.5 per cent complete (Gaminiratne, 1984: 4, Table 1.1). A survey carried out by the Department of Census and Statistics in 1981 to assess the extent of under-registration of vital events found that birth under-registration was 98.8 per cent and death registration 94.5 per cent complete (Gaminiratne, 1989: 10-11).
' I ~ I '' · I ' I I I I~ I! JI 14 births which had normally occurred 7-10 days after birth now tended to occur about three months after birth. The authors suspected that, if the infant died before the birth had been registered, then both events went unregistered. However, over 80 per cent of births in Sri Lanka take place in institutions and these births are supposed to be registered at the hospital before discharge. Only about 40 per cent of deaths take place in hospitals, but the required burial formalities ensure the registration of deaths, except in a few rural areas and estates (Gaminiratne, 1989: 11-12). Although earlier death rates were under-reported, the available mortality statistics provide a good basis for studying present mortality levels and trends in Sri Lanka as shown in Table 1.2.
Table 1.2 Trends in mortality measures and expectation of life at birth
in Sri Lanka.
Period 1901-05 1906-10 1911-15 1916-20 1921-25 1926-30 1931-35 1936-40 1941-45 1946-50 1951-55 1956-60 1961-65 1966-70 1971-75 1976-80 1980 1982 1983 1984 1982-87 1988
Crude Infant Death Rate Mortality
Rate
26.7 171
30.8 189
30.6 201
30.1 190
27.8 190
25.1 175
24.6 183
21.4 160
19.9 131
14.3 101
11.2 75
9.5 63
8.4 54
7.9 51
8.2 46.6
6.9 39.1
6.2 34.4
6.1 29.9
6.1 27.4
6.5 23.1
25.4
6.0 32.0
Maternal Period Mortality Rate 1893-1901 1910-12 1920-22 1945-47
20.1 1946
19.4 1947
21.0 1948
19.2 1949
14.6 1950
9.3 1951
5.0 1952
3.6 1953
2.6 1962-64
1.7 1964
1.2 1965
0.8 1966
0.9 1967
0.6
1971 1979 1985 1988a
Notes: a Refers to 1980-87
Sources: United Nations, 1976: Appendix 1; Ministry of Health, 1984: 10;
Department of Census and Statistics, 1986b; UNICEF, 1990: Tables 1, 5 and 7;
Department of Census and Statistics (1988): Table 6.1. e0
male e0
female
36.4 34.2
33.4 29.3
35.4 31.0
47.8 44.8
43.6 41.6
52.7 51.0
54.9 53.0
56.1 54.8
56.4 54.8
56.1 54.0
57.6 55.5
58.8 57.5
63.3 63.7
63.0 63.6
63.7 65.0
63.6 65.0
64.8 66.9
64.2 66.7
66.1 70.2
15
I
1.6 Causes of high mortality and mortality decline
~j, The causes of the mortality decline have been much debated, but
I
I I
n
'
11
I
I I
II
I
I
J
'
I
unfortunately most studies have been solely concerned with the contribution
of malaria eradication. The most dramatic mortality decline in Sri Lanka
coincided with a successful DDT campaign to control malaria, a severe
problem in Sri Lanka's dry zone. The sections below, drawing on Meegama's
work, discuss the causes of high mortality in Sri Lanka in the early
twentieth century and then examine the contribution of various health
services in reducing mortality in the preceding years.
The main reasons cited by Meegama (1986) for high mortality in the
past were famines, epidemics, poor sanitation, lack of prenatal and
postnatal care, improper feeding practices and malaria. Some of the
problems were brought under control with the improvement of medical
technology while others needed more structural changes such as those
concerned with the economy.
Before we go into the details of Meegama's analysis I should point out
that it is evident from Table 1.2 that mortality decline in Sri Lanka,
partcularly after 1960, had been favourable for women. The maternal
mortality level had already come down and female life · expectancy had
exceeded that of males. Langford and Storey (1993) have highlighted the
impact of sex-selectivity iri mortality in Sri Lanka. They show that from at
least the first census in 1871 until recent years mortality was higher
amongst females than males. This situation remains true in other parts of
South Asia including North India, Bangladesh and Pakistan, where female
status and autonomy are low, but is not true of South India where the
status of women is comparatively high. Yet South India is part of the South
Asian region which Sri Lanka, according to observers, most closely
I
I
I
r/J
'
I
1 I
l
I
I
I
1,
a l,
11
./
l 1
I
I'
16
is contrary to the argument of Caldwell and Caldwell (1986), and of this
thesis, · that a major factor in the decline of mortality in Sri Lanka is Sri
Lanka's comparatively high female status, a characteristic also referred to
by Langford and Storey ( 1993: 265 ).
Langford and Storey (1993: 276) argue that Sri Lanka's high level of
female mortality was due not to what they term a 'culture against females ',
but to malaria and hookworm which combined to exacerbate anaemia. For
women affected by menstruation and maternal depletion this could prove
fatal. Sri Lanka suffered from very high levels of maternal mortality earlier
this century: 2,100 per 100,000 live births in 1921 (Langford and Storey,
1993: 276), while hookworm and malaria were unusually prevalent, even in
comparison to elsewhere in South Asia. On balance, Langford and Storey's
argument seems convincing, though data discussed in Chapter 5 from the
Sri Lanka Demographic Change Project suggest that there may be other
factors. For example, breastfeeding was found to be of shorter duration for
girls than for boys, even though other forms of treatment such as health
behaviour did not appear to vary by sex.
1.6.1 Famine and malnutrition
Famines were a major cause of high mortality in Sri Lanka in the
nineteenth century and Meegama (1986: 11) argued that the creation of a
commercial economy which allowed the importation of food (see Table 1.3)
helped overcome the problem of famine. He notes that
I
"
,I
I
J,
;l
i''
le. I
I
I
I
' I
II
I
I
I!
j
I
I
'
I
I I
I
I
'
, I I.
17
Table 1.3 Selected food imports to Ceylon (Sri Lanka), 1870-1932 (cwt
per million population)
Year Rice Potatoes Dried fish Sugar
1870-1872 1, 141, 060 3,919 33,959 6,005
1880-1882 1,234,100 6,399 33,172 7,772
1890-1892 11,729 60,775 19,829
1900-1902 1,488,409 23,920 77,352 52,223
1920-1922 1, 397, 194 22,494 76,195 95,503
1930-1932 1,685,321 41,832 75,548 249,859
Source: Meegama, 1986: 11, Table 11.
The potential nutritional problems associated with famines were largely reduced through the provision of imported food. However, Meegama noted that the lack of reliable vital statistics for the period means that it is not possible to estimate the precise contribution of the famines to mortality levels (Meegama, 1986: 10-11).
In the mid-twentieth century the government began a food subsidy program under which rice was distributed in the rice-deficit areas of the country. This program was extended to the other areas of the country and the ration was widened to include wheat flour and sugar (Gavan and Chandrasekera, 1979: 14-29). The food subsidy program was replaced by a food stamp scheme in 1979 (Edirisinghe, 1987: 9). What would have happened in the absence of food imports is essentially a matter of conjecture, but evidence of what could happen is provided by the consequences of the 1974 decision to halt food imports. There were widespread food shortages, especially in areas such as the estates where most people lacked access to land to grow their own food such as yams and jackfruit, leading to a reversal in the mortality decline that had been
l
,,
,I
L
i
'l
l~·
'
I!
I I
l !
I
",,
I
"
C
j I
i
u
" I
I
[image:35.788.21.724.49.829.2]18
Table 1.4 Comparison of age-specific mortality rates per 1000
population in the famine year (1974) and in a normal year (1973), the estate sector of Sri Lanka.
Males Females
Age groue Normal J'.'.ear Famine J'.'.ear % increase Normal J'.'.ear Famine J'.'.ear % increase
0-1 114.0 171.0 50 92.0 154.0 67
1-4 8.1 10.4 28 9.6 12.4 29
5-14 1.8 2.5 39 2.0 3.3 65
15-34 1.9 3.4 79 3.0 3.3 10
35-44 3.3 8.6 161 5.3 7.7 45
45-54 7.4 15.6 111 9.6 14.4 50
55-64 16.8 36.8 119 20.4 33.7 65
65+ 130.8 258.6 98 148.5 241.0 62
Source: Meegama, 1982: Table 8.
Table 1.5 Neonatal and post-neonatal mortality per 1,000 live births in
the estate sector and in the rest of Sri Lanka, 1972-1976.
Neonatal mortality Post-neonatal mortality
Year Estate Rest of the Estate sector Rest of the
sector country country
1972
67
25
30
17
1973
65
25
32
17
1974
6~
19
86
23
1975
57
21
40
20
1976
60
22
41
17
Source: Meegama, 1986: 11, Table 10.
1.6.2 Cholera epidemics
I I j
l
'
r 1·1 : I Ill' I I i,, I ,, I! I J iI I ' I' l• '1
I
i I
n,
'
I
I
I
1/ I
I
I 1
.,
~
[image:36.788.66.715.60.1124.2]19 quarantine camps fled to other areas as soon as they realized they had contracted the disease, thus spreading it (Meegama, 1986: 14).
Table 1.6 Cholera deaths in Sri Lanka, 1841-1950
Year 1851-60 1881-90 1891-1900 1901-11 1912-20 1921-30 1931-40 1941-50
No. of cases
35,811 3,868 6,127 1,718 1,104 424 94 242
Source: Meegama, 1986: Table 14.
No.of deaths
24,254 2,452 3,765 1,064 763 280 79 164
Whatever the problems encountered by the quarantine arrangements, quarantine was one of the major instruments that succeeded in controlling cp.olera: hospital treatment was of limited value as the essential treatment, rehydration, was not available in the early days. The gradual development of health services in Sri Lanka eventually brought cholera under control and it is no longer a major contributor to mortality (Meegama, 1986: 16).
The massive nature of the public health activities over a long period of time must have had the following effects: creation of public health infrastructure, including awareness and positive predisposition in a decentralized system; creation of popular expectations about public health activity, and a predisposition towards health seeking behaviour.
1.6.3 Poor sanitation
I
,' ~'
I I
Ill
I
I
I
'
, ,
I I
I 1
I
1,
I,
20
This is reflected not only in the levels of mortality but also in the causes of death: smallpox, typhus, typhoid, cholera and scarlet fever, all resulting from poor sanitation (United Nations, 1973: 145).
Similarly, Meegama (1986:16-18) argued that poor sanitary conditions in Sri Lanka, especially in Colombo and the estates1, led to the spread of various infectious diseases, such as dysentery, diarrhoea and typhoid, and consequently, to high death rates. Diarrhoeal diseases such as diarrhoea, dysentery and enteritis, and hookworm were the major infectious diseases that caused high death rates in the estates. Langford and Storey (1993: 275-278) argue that hookworm and malaria were major causes of female mortality. They note that before the control of these diseases female mortality exceeded male mortality, but with their control this situation was reversed.
With the growth of Colombo as a centre for shipping, trading and administration due to the import-export-based economy, the city became very crowded. The sanitary facilities, nevertheless, remained in a poor state both in Colombo and in the other crowded areas, the plantations. Most people did not have piped water and a proper sewage disposal system. The wells were very shallow and unprotected, and often temporary lavatories were built very close to the wells. The estate people had no lavatories and had to use the surrounding areas. Children often used the compounds and during the nights even adults did so. Consequently, domestic well water was often contaminated (Meegama, 1986: 16-19). A survey of water in Colombo in the period 1903-05 revealed that water in 77 per cent of the wells examined was unsuitable for human co:qsumption (Report on the Sanitation of Colombo, 1907: 25 in Meegama, 1981: 150).
1 ' Estates' is the usual term in Sri Lanka for plantations where tea (coffee , rubber etc) is
I :1 I' I l ;~' I !
, 1 I I I ' I I I I I I ' I ' ' ' 1,
I I
I
I I
" I,
1,.
!
21
[image:38.788.26.716.412.1068.2]The provision of a proper sewage disposal system and piped water in the early twentieth century in Colombo was partly responsible for reducing mortality due to diarrhoeal diseases (Meegama, 1981: 147-148). Meegama argued that poor sanitation affected mortality rates in the estates. In the estate sector, it was only after the Indian government passed a law in 1922 requiring evidence of the provision of proper sanitary facilities on the estates for the recruitment of Indian labourers, that the planters gave much attention to sanitary conditions. Meegama (1986: 18-20) argued that improved facilities were responsible for reducing the estate crude death rate from 35.2 per 1000 in 1924 to 21.1 per 1000 in 1934. Table 1.7 shows crude death rates and the death rate from diarrhoea in Colombo, and the crude death rate and death rates from diarrhoea and hookworm in the estates for selected years. Table 1.7 Year 1901 1911 1921 1924 1925 1930 1931 1935 1940 1941 Note: Sources:
Death rate per 1000 from all diseases, diarrhoeal diseases, and hookworm on estates and Colombo
Colombo Estates
CDR Diarrhoeal Year CDR Diarrhoeal Hookworm
diseases diseases
32.3-35.2 6.5
30.9 5.1
28.8 3.4
- - 1924 35.2 7.7 2.2
- - 1925 31.2 7.1 2.5
- - 1930 22.1 2.8 1.6
18.9 2.2 1931 - -
-1935 26.7 2.3 1.6
1940 17.9 1.1 0.8
1941 15.4 0.8 0.7
Diarrhoeal diseases include diarrhoea, dysentery and enteritis.
Meegama, 1981: Table 5; 1986 Tables 19, 21, 25 and 26.
'
I
I
Ill
I
11
I
I
I
!
I
I
I
J !
I
I•
i
I
I
)
''
I·!
22
most areas of Sri Lanka, piped water is not available and the main source of water is wells. Similarly most areas in the country do not have a centralized sewerage system. According to the 1981 census, only 17. 7 per cent of the households in the country had piped water and 33.5 per cent of the housing units did not have toilet facilities (Department of Census and Statistics, 1986a: 225-226), and very few would have been connected to sewerage pipes. Consequently, while improved sanitation may have been a factor in the mortality decline in rural areas it does not seem to have been the major factor.
1.6.4 Lack of prenatal and postnatal care, and infant and
maternal mortality
As Meegama (1985) pointed out, improper birth practices adopted by traditional midwives during and after delivery were responsible for much of the infant mortality, particularly the neonatal mortality from tetanus, and maternal mortality due to sepsis in the nineteenth century. The Civil Medical Officer of the colony (Ceylon) reported in 1879 that infant deaths were very numerous because of neonatal tetanus, which resulted from the practices of traditional birth attendants:
The excessive mortality among children is due to bad midwifery and the absence of medical assistance at hand in case of difficulty, imperfect tying of the umbilical cord of the child so that it not infrequently bleeds to death (Ceylon, 1879: 182 cited in Nadarajah, 1976: 138).
In 1906, in a survey of mortality patterns in the city of Colombo, the Registrar of the Ceylon Medical College observed that one important reason for infant mortality was tetanus neonatorum: