Immunophenotypes of pancreatic ductal adenocarcinoma:
Meta-analysis of transcriptional subtypes
Ines de Santiago1, Christopher Yau2, Lara Heij3,4, Mark R. Middleton5,6, Florian Markowetz1, Heike I. Grabsch3,7, Michael L. Dustin8,9and Shivan Sivakumar 5,8
1Cancer Research UK Cambridge Institute, University of Cambridge, Cambridge, United Kingdom
2Centre for Computational Biology, Institute of Cancer and Genomic Sciences, University of Birmingham, Birmingham, United Kingdom
3GROW School for Oncology and Developmental Biology, Department of Pathology, Maastricht University Medical Center, Maastricht, The Netherlands 4Department of Surgery and Transplantation, University Hospital RWTH Aachen, Aachen, Germany
5Department of Oncology, University of Oxford, Oxford, United Kingdom
6Oxford NIHR Biomedical Research Centre, Oxford University Hospitals NHS Foundation Trust, Oxford, UK
7Division of Pathology and Data Analytics, Leeds Institute of Medical Research at St James’s, University of Leeds, Leeds, United Kingdom 8Kennedy Institute of Rheumatology, University of Oxford, Oxford, United Kingdom
9Department of Pathology, New York University School of Medicine, New York, NY
Pancreatic ductal adenocarcinoma (PDAC) is the most common malignancy of the pancreas and has one of the highest mortality rates of any cancer type with a5-year survival rate of <5%. Recent studies of PDAC have provided several transcriptomic classifications based on separate analyses of individual patient cohorts. There is a need to provide a unified transcriptomic PDAC classification driven by therapeutically relevant biologic rationale to inform future treatment strategies. Here, we used an integrative meta-analysis of353patients from four different studies to derive a PDAC classification based on immunologic parameters. This consensus clustering approach indicated transcriptomic signatures based on immune infiltrate classified as adaptive, innate and immune-exclusion subtypes. This reveals the existence of microenvironmental interpatient heterogeneity within PDAC and could serve to drive novel therapeutic strategies in PDAC including immune modulation approaches to treating this disease.
Introduction
Despite on going improved understanding of the genetics and molecular biology of Pancreatic Ductal Adenocarcinoma (PDAC), prognosis remains strikingly poor with five-year survival rate
<5%.1Improving outcomes may be achieved through accurate
subtyping upon detection to better tailor therapeutic strategies. Using transcriptomics is an attractive option to sub classify cancers. For example, most notably researchers in colorectal can-cer have developed a consensus classification has four subtypes
with biological and therapeutic relevance.2Gene expression
pro-files of tumours are a combined readout of the tumour’s genetic
and epigenetic status, as well as the composition of other cells in
the microenvironment that are sampled in the biopsy. The micro-environment includes tumour stroma, host connective tissue cells that change in response to signals from the tumour cells, and
innate and adaptive immune system cells.3,4
Several recent studies have described the transcriptomic land-scape of PDAC and identified different subtypes with different
clinical outcomes and drug sensitivities.5–8Table 1 summarises
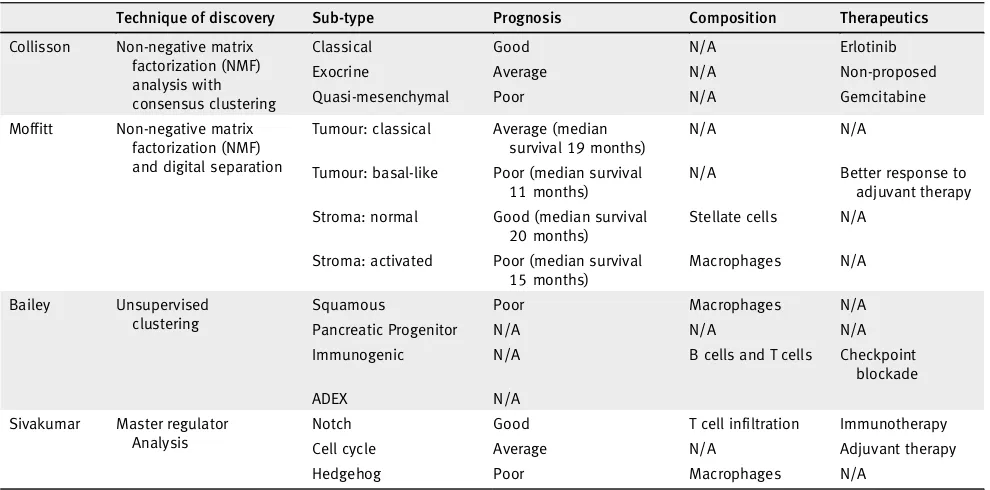
several notable studies. Collissonet al. proposed the first
classifi-cation in 2011 by using unsupervised clustering methods on
tran-scriptomic data.5 This had identified three subtypes: classical,
quasimesenchymal and exocrine-like, which have different prog-noses and different responses to treatment. This classification has
Key words:pancreatic cancer, tumour microenvironment, T cells, adaptive immunity, innate immunity, subtypes Additional Supporting Information may be found in the online version of this article.
Ines de Santiago’s current address is: SBG Discovery UK Ltd., 101 Euston Road, London NW1 2RA, United Kingdom
Grant sponsor:NIHR Oxford Biomedical Research Centre;Grant sponsor:UK Medical Research Council Research;Grant number:MR/ P02646X/1;Grant sponsor:Wellcome Trust;Grant number:100262Z/12/Z;Grant sponsor:NIHR Academic Clinical Lecturership
DOI:10.1002/ijc.32186
This is an open access article under the terms of the Creative Commons Attribution-NonCommercial License, which permits use, distribution and reproduction in any medium, provided the original work is properly cited and is not used for commercial purposes.
History:Received 1 Jan 2019; Accepted 21 Jan 2019; Online 5 Feb 2019
Correspondence to:Ines de Santiago, Cancer Research UK Cambridge Institute, University of Cambridge, Cambridge, United Kingdom, Tel.: +447942568241, E-mail: ines.desantiago@cruk.cam.ac.uk; or Shivan Sivakumar, Department of Oncology, University of Oxford, Oxford, United Kingdom, Tel.: +7912482716, E-mail: shivan.sivakumar@oncology.ox.ac.uk
Tumor
Immunology
and
subsequently been challenged and revised, with newer
classifica-tions being put forward.6–8 Moffitt et al. identified 4 groups:
2 stroma and 2 non-stroma tumour groups.6Moffitt subtyped
PDAC‘classical’and‘basal-like’based on the pancreatic tumour
cells and‘normal stroma’and‘activated stroma’based on the
vir-tually micro-dissected stroma cell population. Baileyet al.
demon-strated 4 subtypes with different characterisations and different
prognoses:‘squamous’,‘pancreatic progenitor’,‘immunogenic’and
‘aberrantly differentiated endocrine exocrine’(ADEX).7Sivakumar
et al. used a master regulator approach based on the transcriptional
effects of oncogenicKRASto determine 3 subtypes that showed
dif-ferent prognoses, characteristics and treatment strategies.8
Other studies that have derived prognostically significant
transcriptional classifiers include Birnbaum et al. who
per-formed a previous meta-analysis of the Collisson, Moffitt and Bailey classifications showing concordance between the Collis-son and Moffitt tumour gene lists and concordance between
the Moffitt stroma gene lists and Bailey classification.9Further
transcriptome analysis from Mao et al. in a small cohort of
10 patients has shown there is a differential transcriptome in
pancreatic cancer.10 A smaller gene expression study showed
there were three subtypes using a gene expression microarray
that has prognostically significant groups.11 Another smaller
master regulator study by Jankyet al. demonstrates there are
four prognostically significant subtypes.12 Further studies by
Haider et al.,13 Kirby et al.14 and Stratford et al.15 all
eluci-dated prognostic transcriptomic signatures of 36, 19 and
6 genes, respectively. Donahue et al. using various cohorts
performed an integrative analysis that identified 171 genes
that elicited another prognostic signature.16 A study by
Con-nor et al. used mutational signatures to derive four subtypes: age related, double-strand break repair, mismatch repair, and one with unknown aetiology with the double-strand break repair and mismatch repair groups were associated with CD8
T cells activation and increased T regs.17 In two papers by
Witkiewicz and colleagues, a relationship between the immune status and genomics was described and classified PDAC into four subtypes: mutationally cold, hot, mutationally active and
cold with cold having the best prognosis.18,19
These studies suggest that it is possible to categorise PDAC through transcriptomics, mutational signatures or immunologi-cal status. However, this has not become the accepted cliniimmunologi-cal
approach because of problems inherent with the approach–too
[image:2.595.52.547.475.720.2]many non-overlapping signatures, inadequate clinical relevance
Table 1.Pancreatic ductal carcinoma and cancer subtyping signatures and studies used in this study
Technique of discovery Sub-type Prognosis Composition Therapeutics
Collisson Non-negative matrix factorization (NMF) analysis with consensus clustering
Classical Good N/A Erlotinib
Exocrine Average N/A Non-proposed
Quasi-mesenchymal Poor N/A Gemcitabine
Moffitt Non-negative matrix factorization (NMF) and digital separation
Tumour: classical Average (median survival 19 months)
N/A N/A
Tumour: basal-like Poor (median survival 11 months)
N/A Better response to adjuvant therapy
Stroma: normal Good (median survival 20 months)
Stellate cells N/A
Stroma: activated Poor (median survival 15 months)
Macrophages N/A
Bailey Unsupervised clustering
Squamous Poor Macrophages N/A
Pancreatic Progenitor N/A N/A N/A
Immunogenic N/A B cells and T cells Checkpoint blockade
ADEX N/A
Sivakumar Master regulator Analysis
Notch Good T cell infiltration Immunotherapy
Cell cycle Average N/A Adjuvant therapy
Hedgehog Poor Macrophages N/A
What’s new?
While several transcriptomic classifications of pancreatic adenocarcinoma (PDAC) have been proposed, a unified classification would be valuable to inform future treatment strategies. Through an integrative meta-analysis of353patients from four different studies, the authors found that the greatest prognostic value in independent cohorts could be achieved through stratification by gene expression signatures associated with tumour-infiltrating immune cells across different pancreatic cancer subtypes. Recognising the existence of different tumour escape mechanisms (and indeed phenotypes) in pancreatic cancer may guide immunotherapeutic treatment plans and improve patient stratification for maximization of therapeutics.
Tumor
Immunology
and
and poor mechanistic underpinning. It would thus be valuable to consolidate different stratification schemes into a novel classi-fication of pancreatic cancer and develop reliable and robust biomarkers to better predict outcomes and rationalise therapeu-tic strategies.
In response to this unmet need, we have developed an immu-nological classification scheme from four notable transcriptomic
PDAC sub typing studies (Table 1).5–8 PDAC has previously
been shown to have different immune populations in its
microenvironment.20In light of the tumour having a complex
immune composition, the tumour microenvironment can be immunosuppressive or tolerant and this can be due to immune
dysfunction.21,22 However, immunotherapy approaches have
not yet had an impact on pancreatic cancer survival.23,24 Our
meta-analysis reveals that the greatest prognostic value in inde-pendent cohorts could be achieved through stratification by gene expression signatures associated with tumour infiltrating immune cells across different PDAC subtypes. Recognising the existence of different tumour escape mechanisms (and indeed phenotypes) in PDAC may guide distinct immunotherapeutic treatment plans and improve patient stratification for maximisa-tion of therapeutic effect.
Methods
Data download: gene expression profiles, clinical and mutations datasets
The PACA-AU gene expression data (n= 269) plus clinical and
mutational profiles were obtained from ICGC data portal (https:// dcc.icgc.org/releases/release_24/Projects/PACA-AU). TCGA raw
counts files for RNA-seq data (n= 177) were obtained from the
GDC portal (https://portal.gdc.cancer.gov/). Clinical metadata and Mutation annotation files (MAF) for the TCGA cohort was obtained from the GDC legacy archive (https://portal.gdc.cancer. gov/legacy-archive/) with the UUIDs: a9f29dc4-6a6a-42f3-b06d-9e6ded926b55 (clinical metadata) and
faf50bd9-bfc8-4dfa-b0ca-9184e44fb07f (MAF file). The UNC gene expression data (n= 132)
plus clinical profiles were obtained from gene expression omnibus (GEO) archive under the accession number GSE21501. Out of 132, in the UNC cohort, 30 were excluded due to unavailability of survival time in the clinical table.
Processing of gene expression data
Batch effects were removed by applying the ComBat algorithm.25
TCGA RNA-seq data was transformed with the
variance-stabilising transformation method26 prior to removing batch
effects. Batch IDs for the TCGA cohorts were obtained from the
sample barcode, namely the‘plate’id as described in https://wiki.
nci.nih.gov/display/TCGA/TCGA+Barcode.
Classification of PACA-AU and TCGA cohorts according to five previous classification schemes
The R package ConsensusClusterPlus27was employed to subtype
PDAC samples according to the expression signatures defined in
Moffittet al.6and Collissonet al.5(Supporting Information Fig. S1).
The number of clusters was confirmed by examining cumulative dis-tribution function (CDF). We confirmed the existence of
well-separated clusters for Moffittet al. classification based on tumour (two
clusters: basal-like and classical) and stroma signatures (2 clusters:
stroma and activated stroma). For the Collisonet al. classification we
confirmed the existence of evident 3 clusters (classical, exocrine-line
and quasimesenchymal). Baileyet al. cluster labels were directly
down-loaded from (PACA-AU cohort)7and TCGA cohort).28Sivakumar
et al. cluster labels were directly downloaded from.8
Identification of immunophenotypes
To identify a meaningful agreement of the multiple clustering labels we used consensus clustering and the partition around medoids (PAM) algorithm to cluster the PACA-AU and TCGA cohorts according the similarity of their labels. For the PACA-AU cohort, we only included tumours that were classified as
‘Pancreatic Ductal Adenocarcinoma’ according to the tumour
histological type classifications and were also labelled by all 5 clas-sification schemes, which corresponded to 204 PDAC tumours. For the TCGA cohort we included only the filtered PDAC cases
according to Raphael et al., this corresponded to 149 TCGA
tumours.28The Hamming distance was used as a measure of
sim-ilarity between PDAC tumours. The robustness of sample classifi-cation was analysed by examining cumulative distribution function (CDF) of the proportion of times in which 2 samples are
clustered together across the resampling iterations (1,000×).29
For varying number of clusters (K = 2 to K = 7), we examined the area under the curve of the consensus distribution function (CDF) plot (Supporting Information Figs. S2 and S3) and identi-fied three robust novel subtypes in both cohorts.
Survival analysis
Multivariate Cox regression, log-rank test and Kaplan–Meier
estimators were implemented using the R package survival.
For the PACA-AU cohort (Fig. 2c), we adjusted the survival
differences for age, gender, and tumour stage and tumour
grade. For the TCGA cohort (Fig. 2e), we adjusted for age,
gender, tumour stage, tumour grade and targeted therapy indicator (yes/no). Tumour stage refers to the TNM Staging System based on the extent of the tumour (T). The targeted therapy indicator refers to whether the patient had adjuvant and/or postoperative pharmaceutical therapy. More specific information about the treatment regime was not available. The
correlation between immune cell scores and survival (Fig. 3c)
was performed using a multivariate cox regression model adjust-ing for age, gender, tumour grade and stage (PACA-AU and TCGA cohorts) and adjusting for tumour stage (TMN T stage) for the UNC cohort. For the TCGA cohort we only included cases with no targeted therapy.
Analysis of immune infiltrates and tumour purity
Two main methodologies were used to identify immune cell types enriched in the tumour microenvironment. For three
Tumor
Immunology
and
of the gene signatures30–32 we used single-sample gene set enrichment analysis (ssGSEA) method implemented in the
GSVA R package.33For the Aran gene signatures we used the
xCell method implemented in R.34 The xCell method also
relies on ssGSEA analysis but contains an additional step,
which uses a reference matrix of‘spillovers’between cell types.
The‘spillover’step is thought to better eliminate dependencies
between closely related cell types (e.g. such as between CD8+ T-cells and NK cells). Log2(TPM + 1) gene expression levels from the TCGA cohort were used to estimate the enrichment with the ssGSEA method, and TPM levels were used with the xCell method. Normalised microarray gene expression levels (Illumina Expression BeadChIPs) from the PACA-AU cohort were used directly in both methods.
ESTIMATE was used to gauge the degree of leukocyte
infiltration, stromal content and tumour purity.3 Data was
summarised per PDAC subtypes in the PACA-AU and TCGA
cohorts (Fig. 5e; Supporting Information Fig. S5).
Histopathology analysis
TCGA H&E Slides were viewed on the NCI data portal https://portal.gdc.cancer.gov/. Two pathologists reviewed the slides and assessment of tumour cellularity and dominant immune cell type (lymphocyte versus neutrophils) were made.
Mutation analysis
Mutational signature analysis was performed using the
Decon-structSigsR Package.35 We determined the contribution of
30signatures defined in COSMIC (http://cancer.sanger.ac.uk/ signatures/)to explain each pancreatic cancer mutational pro-file. Normalisation was relative to the number of times each trinucleotide context is observed in the exome. The output was aset of weights specifying the estimated contribution of each of the 30known signatures to the mutation profile. MAF
files were parsed with maftools36 (Supporting Information
Fig. S7). Number of neoantigens per tumour in the TCGA cohort was retrieved from The Cancer Immunome Atlas
data-base (https://tcia.at/home).31
Statistical analysis
All statistical analyses: Fisher’s exact test, Chi-square test,
Wil-coxon rank sum test, hypergeometric test, and hierarchical
clustering, were performed using R.37 Multiple test correction
was performed using the R functionp.adjust and the Benjamini
and Hochberg (FDR) method. Jaccard coefficients were com-puted using the R package rules. Differential expression analysis
between the groups was carried out using the Welch’s test
implementation in R and by comparing each group against all
others. Welch’s test is a variant of the classical Student test,
whose goal is to test the equality between two means taking assuming different variances between two groups. When neces-sary, Ensembl or Entrez IDs were mapped to human HUGO identifiers using Ensembl version 89 biomart (http://www. ensembl.org/biomart). R code, sample IDs and final sample cluster
memberships for the TCGA and PACA-AU cohorts are provided as a Supporting Information file (Additional File 1) and in Sup-porting Information Table S1.
Results
PDAC meta-analysis
We used published exemplar gene signature for data from
Collisonet al. and Moffittet al. to cluster 242 PDAC primary
tumour cases from the PACA-AU cohort (Supporting Infor-mation Fig. S1). We further obtained and applied clustering
labels identified by Baileyet al. and Sivakumaret al. also from
the PACA-AU cohort. Figure 1asummarises the workflow of
our analysis.
To identify a meaningful accordance of the multiple clus-tering labels we used consensus clusclus-tering and the partition around medoids (PAM) algorithm to cluster the 204 PDAC tumours according to the similarity of their labels and
identi-fied three robust novel subtypes (Fig. 1b; Supporting
Informa-tion Fig. S2). VisualisaInforma-tion of the similarity network between tumour labels revealed that consensus samples remained grouped between the three large primary network hubs
(Fig. 1b). We used 150 TCGA samples that were previously
classified to perform the same classification using the PAM algorithm in an independent cohort (Supporting Information Fig. S3). Notably, the same three subtypes were identified in
the TCGA cohort (Fig. 1c) with the three main subtypes
showing a stable and consistent pattern of co-associated labels
(Fig. 1d; Supporting Information Fig. S4). The subtype 1
clus-ter overlapped between Moffitt basal-like, Bailey squamous, Collisson QM-PDA and Moffitt activated stroma subtypes
(Fig. 1d). The subtype 2 cluster consisted of a statistically
signifi-cant overlap between the Bailey ADEX, Collisson exocrine-like, Sivakumar Notch and Moffitt normal-stroma subtypes. Finally, the subtype 3 cluster overlapped with the classical subtypes identified by Moffitt and Collison studies and cell-cycle group
identified by Sivakumaret al. (overlaps were considered
signifi-cant at hypergeometric FDR adjusted p≤0.05 in both cohorts;
Fig. 1d).
Clinicopathological characteristics of PDAC subtypes
Clinical features, including age, gender, tumour grade and TNM, were statistically compared between the three clusters. Two-way contingency table analysis showed significant association between grade and cluster subtype, with subtype 1 tumours more likely to
be grade 3 (Chi-square testp= 0.002 PACA-AU cohort; Fig. 2a)
and subtype 2 tumours more likely to be grade 1 (Chi-square
testp =0.033 for the TCGA cohort; Fig. 2b). Tumour stage and
gender did not correlate with the subtypes in any of the cohorts. Similarly, the average age of diagnosis was not significantly
asso-ciated to any cluster subtype (Figs. 2aand 2b; Supporting
Infor-mation Table S2).
To determine whether patients belonging to a certain PDAC cluster have different outcomes, we performed a Cox proportional hazards analysis. We observed differences in
Tumor
Immunology
and
prognosis of different PDAC subtypes, with subtype 1 tumours
associated to worst overall survival and higher HR (Figs. 2c–2f;
Supporting Information Table S3) in multivariable analyses, after adjustment for several clinicopathological features, including age, gender, tumour stage and grade. This difference was only statistically significant in the PACA-AU cohort
(sub-type 1 vs. subtype 2: p = 1.3 × 10⁻² HR = 1.9; 95%
CI = [1.1–3.0]) and not in the TCGA cohort (subtype 1 vs.
subtype 2: p = 0.2; HR = 1.6; CI = [0.8–3.2]). However, we
noticed a strong influence (p = 5.35 × 10⁻⁷; HR = 4.8;
CI = [2.6–9.0]) of ‘targeted therapy’ variable in overall survival
(Fig. 2e) and this might explain our inability to completely
repro-duce survival results observed in the PACA-AU cohort. Differen-tial prognosis associated with the stroma type were also evident, as Moffitt classical tumour subtypes with normal stroma (enriched in subtype 2) had the best prognosis, while Moffitt
Figure1.Identification of the consensus subtypes of PDAC. (a) Analytical workflow of the PDAC subtyping: (1) subtype classification using methodology from five different classification schemes; (2) concordance analysis of the five subtyping labels and application of PAM clustering algorithm to identify consensus clusters; (3) analysis of clinicopathological and immunophenotypes of PDAC consensus subtypes and identification of immune cell signatures with prognostic value in independent PDAC cohorts. (b) Patient similarity network. Each node represents a single patient sample in the PACA-AU cohort (n=204). Network edges correspond to highly concordant (at least5of6) subtyping calls between samples. Nodes are coloured according to the three clusters identified from the PAM consensus clustering algorithm. (c) Circular heatmap representing sample overlap for consensus PDAC subtypes and mRNA subtypes from Baileyet al., Sivakumaret al., Collissonet al., or Moffittet al. (from inside to outside, respectively). Significance of sample overlap was assessed with the hypergeometric test, adjustedpvalues for each pairwise comparison are depicted in Supporting Information Figure S4. (d) Association of consensus PDAC subtypes identified by PAM clustering (red refers to this study: Type1, Type2, Type3) with tumour labels across five classification systems. Each node corresponds to a single subtype (circles are coloured according to classification study; red diamonds correspond to the consensus subtypes). Edge width corresponds to the overlap between labels assessed by the Jaccard coefficient in the PACA-AU cohort, only significant edges are depicted (hypergeometric P≤0.05. The three grey rectangles delineate clusters of tumour labels that overlap the three PDAC consensus groups (Type1–3) with FDR adjusted P≤0.05. [Color figure can be viewed at wileyonlinelibrary.com]
Tumor
Immunology
and
basal-like tumour subtypes with activated stroma (enriched in subtype 1) had the worse prognosis. Patients in the Sivakumar Notch group (enriched in subtype 2) also displayed the best
overall survival rates.8
Immuno-phenotypes of pancreatic adenocarcinoma
Analysis of the tumour microenvironment has revealed that populations of tumour infiltrating immune cells have
signifi-cant prognostic value in a variety of solid tumours.3,38,39
1 2 3 1 2 3 1 2 3 1 2 3
1 2 3
(a)
(b)
(c) (d)
(e) (f)
Figure2.Legend on next page.
Tumor
Immunology
and
Analysis in melanoma, breast cancer and colorectal cancer has shown that tumour progression is characterised by distinct
immune patterns40–43 and that assessment of this ‘
immuno-phenotype’may predict patients prognosis better than beyond
that predicted by traditional staging.44
To further explore the composition of different immune infiltrates in the different tumour microenvironments of PDAC cancers, we used single sample gene set enrichment analysis (ssGSEA) to score each tumour based on gene signatures
repre-sentative of different cell types.45To test the consistency of the
results, we performed the analysis in the PACA-AU and the TCGA cohorts. We used four published signatures from
indepen-dent studies30–32,34and focused on 7 immune cell types (NK cells,
Neutrophils, Macrophages, Dendritic cells, CD4+ T-cells, CD8+ T-cells and B-cells). We observed that immune signatures are dif-ferentially enriched in the tumour microenvironment of PDAC
subtypes (Fig. 3a).
Subtype 1: ‘innate immune’. Our subtype 1 PDAC group
showed an enrichment of Natural Killer (NK) cells and neu-trophils, and an exclusion of other tumour infiltrated lympho-cytes such as activated CD4+ T cells, CD8+ T cells and activated B-cells. Activation of primary drivers of EMT such
as transforming growth factor-β(TGFβ)7and the Twist1 gene
and de-regulation of developmental signalling pathways such
as Hedgehog (Hh) and Wnt–β-catenin signalling6,8 have also
been associated to tumours in this category by previous stud-ies. We confirm such findings by showing marked up-regulation of Twist1 (EMT markers), and down-up-regulation of
Ptch1 in samples of this subgroup (Fig. 3b; Welch’st-test FDR
adjusted p = 1.73 × 10⁻⁶ and 5.47 × 10⁻¹⁰ for Ptch1 and
Twist1, respectively). Ptch1 is a receptor for Hedgehog (Hh) ligands and a tumour suppressor in the Hh pathway. Differential gene expression analysis also showed several
de-regulated pathways related to‘extracellular matrix
organi-zation’,‘cell adhesion’and‘developmental processes’(Supporting
Information Table S3). The Wnt–β-catenin developmental
pathway signalling, which was found to be up-regulated this
PDAC group,8 is known to correlate with T-cell exclusion
across solid tumours.46,47This relationship was then validated
recently in a clinical setting making the therapeutic strategy of beta-catenin inhibitors with immunotherapy a potential
strat-egy for T-cell deficient tumours.48 Baileyet al. also identified
gene programmes that included inflammation, hypoxia response
and autophagy, and associated to the‘squamous’tumours, which
are enriched in this group.
Type 1 tumours were associated with the worse survival
(Figs. 2dand 2f). Therefore, the desmoplastic stromal compartment
and its interactions with tumour cells have clearly important roles in the poor outcomes for this group of PDAC tumours. This is a very difficult topic to dissect though as there is evidence to
demon-strate that the stroma can both restrain and promote the tumour.49
We performed multivariable survival analysis adjusting for clinicopathological features, including age, gender and tumour stage when available, and identified a negative relationship between neutrophil enrichment scores and survival in PDAC
(Fig. 3c). We validate this prediction using three cohorts:
PACA-AU, TCGA and an additional cohort of 102 PDAC tumour samples obtained from the University of North Caro-lina (UNC). The results of the enrichment of the immune infiltrates showed associations of neutrophils with survival in
independent cohorts (Fig. 3c) highlighting their potential as
clinical biomarkers and therapeutic targets.
Subtype 2: ‘T cell dominant’. The second PDAC cluster is characterised by PDAC tumours that displayed enrichment of many tumour infiltrating immune subpopulations related to adap-tive immunity including activated CD8+ and CD4+ T-cells, and
B-cells (Fig. 3a). Subtype 2 samples exhibited a gene expression
profile compatible with increased expression of genes associated
with an‘immune response’,‘positive regulation of immune system
process’and‘cell activation’(Supporting Information Table S4).
This immune subtype of PDAC is characterised by marked upre-gulation of genes known to play roles in immune checkpoint
inhi-bitions (e.g. CTLA4 and BTLA)50; B-cell receptor and T-cell
receptor genes (e.g. CD3D, CD79A and CD79B) (Fig. 3band
Sup-porting Information Fig. S5; Welch’st-test FDR adjustedp<< 0.01
in both cohorts).‘Normal stroma’,‘Exocrine-like’,‘ADEX’ and
‘Notch’PDAC tumour samples are also over-represented in this
cluster (Fig. 1b). Sivakumaret al. also observed enrichment for T
cell–related pathways, such as those pertaining to T cell activation,
proliferation, and differentiation, adaptive immune response and a significant prevalence of infiltrating CD8+ T cells in tumour samples enriched in this group.
Subtype 2 is the most immunogenic subtype with signifi-cantly better survival when compared to samples of subtype
Figure2. Clinicopathological and prognostic associations of consensus PDAC subtype groups. (a,b) Clinicopathological and prognostic associations of consensus PDAC subtype groups in the PACA-AU (a) and TCGA (b) cohorts. Distribution of histopathological grade;, TNM system tumour stage at diagnosis, gender, and age at diagnosis, across the three consensus subtypes, represented by the coloured violin plots subtype1(green); subtype2, (orange); subtype3(violet). Red asterisks represent significant codes for Chi-square testpvalues: p <0.01‘**’;p <0.05‘*’. (c,e) Multivariate Cox proportional hazards regression analysis for the PACA-AU (c) and TCGA (e) cohorts, with covariates including patient age at diagnosis, tumour stage (TMN system) and tumour grade. Squares represent the hazard ratio (HR) and the horizontal bars extend from the lower limit to the upper limit of the95% confidence interval of the estimate of the hazard ratio. The plot also shows the number of considered events (N) andpvalues (p) for the interaction between survival and any covariate. Detailed statistics are in Supporting Information Tables S1and S2. CI, confidence interval; HR, hazards ratio; p, Wald testpvalue. (d,f) Prognostic value of subtype 1,2and3PDAC groups in the PACA-AU (d) and the TCGA (f) cohorts with Kaplan–Meier overall survival analysis. [Color figure can be viewed at wileyonlinelibrary.com]
Tumor
Immunology
and
1. It has been shown before that higher levels of CD8+ T cell
infiltration correlate with a better survival with Tumeh et al.
showing that CD8 T cell infiltration is needed for PD-1
ther-apy to work.20,51,52 Together these findings indicate that this
subtype is potentially amenable to therapy based on immune-check point inhibitors.
Subtype 3: ‘tumour dominant’. Subtype 3 tumours exhibit
lower enrichment scores for immune signatures, which suggests a lack of tumour-infiltrating lymphocytes in the microenvironment
(Fig. 3a). This group is enriched for PDAC tumours that have
been characterised by high expression of adhesion-associated and
epithelial genes5and genes with distinct roles in the control of
cell-cycle, essential mitotic checkpoint functions, chromosomal
stability, and DNA repair.8 We confirmed that GATA6 gene
expression is high in the subtype 3 group and low expression in
subtype 1 (Fig. 3band Supporting Information Fig. S5; Welch’s
t-test FDR adjustedp= 1.54 × 10⁻⁶ and p= 2.71 × 10⁻⁴ for
PACA-AU and TCGA cohorts, respectively), which is expected given the overlap between subtype 3 and classical subgroups
defined by Collisonet al. and Moffittet al. Similarly, it has been
recently shown that GATA6 expression inhibits the epithelial–
mesenchymal transition (EMT)in vitroand cell dissemination
in vivoand is associated to suppression of basal-like (like the one
activated in subtype 1) molecular phenotype in PDAC tumours.53
Collisonet al. compared PDA cell lines representative of the
clas-sical and QM-PDA subtypes and described that the clasclas-sical PDA cell lines are enriched in a KRAS-addiction gene expression
sig-nature and more dependent on KRAS than QM-PDA lines.5We
found a strong enrichment for multiple metabolism signatures (Supporting Information Table S3) in this group indicating prominent metabolic adaptation.
Histopathology analysis of immunophenotypes
We have established clear transcriptional immunophenotypes though this analysis cannot be provided routinely in the clinic.
Figure3.Tumour-infiltrating subpopulations of immune cells are associated with distinct PDAC subtypes. (a) Heat map of row scaled immune infiltrated scores per immune cell type. Angelova, Charoentong and Tirosh represent single-sample GSEA scores of signatures for cell types from the corresponding manuscripts. Aran is the inferences produced using xCell algorithm.21(b) Boxplots showing markers of special interest in PDAC subtypes differentially expressed between groups from the PACA-AU cohort. Similar trends were observed in the TCGA cohort (Supporting Information Fig. S5). EMT–Epithelial-mesenchymal transition; Eh–Hedgehog; CAF–Cancer Associated Fibroblasts; TCR–T-cell receptor; BCR –B-cell receptor. Asterisks represent significant codes for Welch’st-test FDR adjustedpvalues:p <0.01‘**’;p <0.001‘***’. Welch’st-test was used to test for differential expression of a particular gene in a given subtype compared to all other subtypes. (c) Correlation of tumour infiltrating immune cells with patient overall survival. For three independent cohorts (PACA-AU, TCGA and UNC), a multivariate Cox proportional hazards regression analysis was performed, with covariates including the enrichment scores of six immune cell types, and when available, patient gender, age at diagnosis, tumour stage and tumour grade. Squares represent the hazard ratio (HR) and the horizontal bars extend from the lower limit to the upper limit of the95% confidence interval of the estimated of the hazard ratio. The colour scale reflects–log10(pvalue) and is shown in blue for HR <1(good prognosis) and in red for HR >1(bad prognosis). [Color figure can be viewed at wileyonlinelibrary.com]
Tumor
Immunology
and
(a) (b)
Figure4.Histopathology in the TCGA cohort. (a) Pathologist assessment of dominant immune cell presence and (b) tumour surface area across the three PDAC consensus subtypes. [Color figure can be viewed at wileyonlinelibrary.com]
Figure5.Mutation analysis. (a) Heatmap showing the relative contribution of mutation signatures1,6and15. (b) Tumour mutational burden and neoantigen load for different tumour subtypes of the TCGA cohort (c) OncoPrint displaying frequency of mutated genes in different PDAC subtypes of the TCGA cohort (d) Distribution of activating KRAS mutations across the three PDAC subtypes in the TCGA and PACA-AU cohorts (e) Tumour purity (ESTIMATE scores) across subtypes of the TCGA cohort. [Color figure can be viewed at wileyonlinelibrary.com]
Tumor
Immunology
and
Haematoxylin and Eosin (H&E) staining of the pathology of the specimen can provide a robust and quick assessment of the tran-scriptional status of the tumour. H&E sections of the cases in the TCGA were provided by TCGA so we were able to assess the rela-tionship of transcriptional immunophenotype to the pathology. We were able to classify each PDAC sample from the TCGA cohort according to their predominant cell type. 149 H&E slides were reviewed in relation to the 149 transcriptomes we analysed from TCGA. We considered three classes: lymphocytes (T cells);
neutrophils; or‘none’for when no particular immune cell was
found. We found that there was no significant difference in the number of neutrophil-predominant cases in the three immuno-phenotypes (27% in subtype 1, 18% in subtype 2, and 18% in
sub-type 3; Fisher testp= 0.15). In the first immunophenotype, there
was a larger proportion of cases classified as‘none’(21% in
sub-type 1vs.4% and 10% in subtype 2 and subtype 3; Fisher test
p= 0.03; Fig. 4a) and a smaller proportion of samples with
lym-phocytes as their predominant immune cell type (51% in subtype
1, 77% in subtype 2, 78% in subtype 3; Fisher test p = 0.01;
Fig. 4a). Subtype 1 is the innate subtype so even though on
pathology, assessment of macrophages could not be provided, it was clear that there was a smaller proportion of lymphocyte-predominant samples on histopathology, while in both subtypes 2 and 3, there was an association with lymphocytes.
While reviewing all 149 available TCGA slides to classify the immunophenotypes; the area percentage of tumour in the slide was estimated concurrently. Furthermore, tumour cellu-larity was significantly different between subtype 2 and
sub-type 3; median tumour cellularity was 0.2 (range: 0.05–0.8)
and 0.35 (range: 0.05–0.9) in subtype 2 and subtype 3, respectively
(Wilcoxon rank sum testp= 9.3×10⁻³, Fig. 4b). Similarly, the
number of cases classified as lymphocyte-predominant was dif-ferent between subtype 2 (40 out of 52; 77% in subtype 2) and
subtype 3 (47 out of 60; 78% in subtype 3). The‘type 3’tumours
which we originally called‘immune exclusion’has a much higher
tumour cellularity compared to‘type 2’. This could be due to the
exact number of immune cells present and one of the limitations of the study is that we do not have a ratio of immune cells to tumour.
Mutational signature analysis
Multiple mutation signatures have been established through
pan-cancer analysis of cancer genomes.54These have established
mutational signatures for pancreatic cancer including a signature associated with failure of double strand break repair by
homolo-gous recombination (Signature 3).54Using a panel of thirty
muta-tional signatures from COSMIC, we established the contribution of each signature to the cohort of pancreatic cancers and sought to identify if any signature that is enriched for the immunophe-notypes we have described in this manuscript. We found three
major contributory signatures in these pancreatic cancers (Fig. 5a
and Supporting Information Fig. S6) but none of these were enriched for a particular subtype. These were signatures 1, 6 and
15.54Signature 1 correlates with the ageing process and 6 and
15 are tied to DNA repair. The signature analysis does not help explain the difference in subtypes but does reinforce that certain cases of pancreatic cancer may benefit from treatment with thera-peutics against DNA repair.
Mutational burden
Evidence suggests that the degree of mutagenesis within a tumour may represent a biomarker for response to immunotherapy. It is thought that highly mutated tumours are more likely to harbour neo-antigens, which make them targets for adaptive immunity. Tumour mutation burden has been shown, in several tumour types, to correlate with patient response to both CTLA-4 and
PD-1 inhibition.55,56We did not find any difference in tumour
muta-tional burden (number of mutations / Mb) and neoantigens
between the three subtypes (Fig. 5b). The most frequently
mutated pancreatic cancer genes (KRAS, CDKN2A, SMAD4 and
TP53) are equally distributed across the three subtypes (Fig. 5c),
except for KRAS and SMAD4, which are observed in lower fre-quency in subtype 2 (73 and 17%, respectively) when compared
to subtype 1 (KRAS: 97%; Fisher exact testp= 0.003) and
sub-type 3 (SMAD4: 32%; Fisher exact testp= 0.03). We also
ana-lysed the status of the activating KRAS mutation, namely G12D, G12R, G12 V and other (A11T, G12A, G12C, G12 L, G12S, G13C, G13P, GQ60GK, Q61H and Q61R) and verified that KRAS mutations are spread out equally over the three
subtypes in both cohorts (Fisher exact test p= 0.76 and
p= 0.65 for PACA-AU and TCGA, respectively; Fig. 5d). In
summary, smaller frequency of mutations of key pancreatic cancer driver mutations are observed in the subtype 2 PDAC subtypes. However these results are inconclusive because it is highly possible that the level of purity across tumour samples
affects the interpretation of genomic analyses.57In fact, in agreement
with the tumour cellularity observations in Figure 4b, we observed
striking differences in estimated promotion of tumour cells in the
samples between PDAC subtypes (ANOVA p = 5.4 × 10⁻⁶), in
particular subtype 2 displayed the lowest purity (Fig. 5e;
Sup-porting Information Fig. S8). This variability confounds the interpretation of genomic analysis results when comparing between PDAC subtypes.
Discussion
In this study, we propose a novel immune clustering of PDAC into three major subtypes that have different molecular and clinical characteristics and may respond differently to selected therapies. We suggest that PDAC subtypes should be consid-ered when stroma and immune modulating therapies are studied in the future. The identified immunophenotypes applies to tumour samples from four independent cohorts, demonstrating the robust nature of this new subtype classifi-cation in PDAC. It is important to notice the strong presence of stromal components in subtypes 1 and 2, but also distinct prognosis for each group. However, while the subtype 1 group of
Tumor
Immunology
and
tumours is characterised by a reactive desmoplastic stroma and an inflammatory microenvironment with possible epithelial-to-mesenchymal transition (EMT) events; the stromal compart-ment in subtype 2 is enriched in infiltrated CD8+ and CD4+ T-cells.
Subtype 1 suggests that the functional role of EMT regulators and innate immune cells in immune evasion is complex. The biological link between the inflamed immune subtype and EMT is consistent with the finding that the stroma of subtype 1 tumours is infiltrated not only with innate immune cells, but also markers typically found in activated cancer-associated-fibroblasts such as FAP which is significantly over-expressed in
subtype 1 tumours in both cohorts (Welch’st-test FDR adjusted
pPACA-AU= 1.04×10⁻⁵andpTCGA= 6.65×10⁻⁸; Fig. 3b) and
ACTA2 in the TCGA cohort (Welch’s t-test FDR adjusted
p= 7.3×10⁻⁴; Supporting Information Fig. S5). In addition, it
suggests that the worse outcomes seen in the subtype 1 may be partially linked to a pro-metastatic immune evasive microenvi-ronment. Tumour samples in this group have been characterised
by infiltration of desmoplastic stroma (‘activated-stroma’such as
in Moffittet al.) and high expression of mesenchyme associated
genes (‘basal-like’such as in Collisonet al.). These results
cor-roborate initial findings by Guerraet al., and others that
inflam-mation increases both EMT and cancer cell invasion21,22 and
that the presence of IL-6 pro-inflammatory marker in the serum of patients with pancreatic cancer has been associated with
worse survival.23 A better definition of the tumour-expressed
ligands recognised by these myeloid cell subsets and their role in driving tumour progression and anti-tumour immunity will facilitate more detailed functional analyses and identify possibili-ties for therapeutic intervention. We had demonstrated on H&Es provided to us that the presence of lymphocytes is the major phenotypic feature, if there are no T cells in the tumour the patient does poorly.
Another challenge that arises is the definition of better pre-clinical models that recapitulate these subtypes. The interplay between the stroma and the immune components are difficult to model. Previous research suggests that traditional pancreatic cancer cell lines from the Broad Institute Cancer Cell Line Encyclopaedia only recapitulate the two of the three subtypes
and do not represent the immunogenic lines5,8 and PDX
models are not able to recapitulate the‘normal-like’subtype.6
Current tumour models such as the KPC mice do not accu-rately reflect variations in sub-types of pancreatic cancer and there is generally difficulty at obtaining high quality primary samples. Less then 20% of patients undergo a resection and most of the tumour is infiltrated with a desmoplastic stromal reaction that is composed of collagen, fibroblasts and immune cells. Studies so far have tried to enrich as best as possible the tumour compartment including the ones we have used.
Several lines of evidence suggest differential drug response
sensitivity between the different subtypes. Moffittet al. has
shown that patients with ‘basal-like’ (subtype 1) tumours
showed a strong trend toward better response to adjuvant
therapy when compared to patients from the‘classical’
(sub-type 3) sub(sub-type group6and that QM-PDA cell lines were, on
average, more sensitive to gemcitabine and less sensitive to
erlotinib than the classical cell lines.6Additionally, it has been
shown that patients with GATA6high PDAC tumours have
better response to 5-FU when compared to ‘basal-like’
GATA6low patients.53 Together these results suggest that
KRAS-directed therapies or therapies targeting growth path-ways such as EGFR-targeted therapy might be best deployed in this subtype 3 classical PDAC subtype when compared to the other PDAC subtypes. The regulatory contribution of the immune system should be assessed more thoroughly in human PDAC cancer to guide new therapeutic interventions tailored to patients with different tumour subtypes.
We think that the pancreatic cancer subtypes identified in our study provide further insights necessary for the under-standing of the immunogenicity of PDAC. Being able to deter-mine which PDAC cases are immunogenic or not and what other characteristics they may have, could facilitate develop-ment of potential strategies to remove immune suppression. Following on from our current analysis, future work should characterise the immune cell populations in these tumours including their activation status and spatial relationship with the tumour cells. Such investigations required prospective col-lection of appropriate material from a sufficiently large patients cohort using techniques such as single cell sequencing, CyTOF and multiplexed immunofluorescence imaging with advanced image analysis technology.
Additional work needs to be performed to assess the degree of responsiveness of those infiltrating lymphocytes when the suppression is removed. Our work has already alluded to suppression with macrophages and neutrophils and it will be worth characterising the nature of Tregs in the tumour in subsequent studies as a further immunosuppressive mechanism. An additional issue is that even if we removed the immunosuppression with therapeutics; as the mutational bur-den of the tumour is low, there is a lower chance a neoantigen will be created that will be recognised by T-cells. Further strate-gies will have to be investigated in creating neoantigens such as using radiation therapy or using chemotherapy or to use adop-tive T cell strategies to help fight the cancer. Understanding PDAC subtypes could be used improve better patient stratifi-cation for clinical drug trial enrichment schemes to better select patients to make detection of a treatment effect more likely. However, more detailed immune characterisation of PDAC tumours is needed before instigating novel therapeu-tic strategies.
Acknowledgements
This study was supported by the NIHR Oxford Biomedical Research Cen-tre. CY is supported by a UK Medical Research Council Research Grant (MR/P02646X/1). MLD is funded by Wellcome Trust grant 100262Z/12/Z. SS is funded by a NIHR Academic Clinical Lecturership.
Tumor
Immunology
and
References
1. Ilic M, Ilic I. Epidemiology of pancreatic cancer. World J Gastroenterol2016;22:9694–705. https:// doi.org/10.3748/wjg.v22.i44.9694.
2. Guinney J, Dienstmann R, Wang X, et al. The consensus molecular subtypes of colorectal cancer. Nat Med2015;21:1350–6. https://doi.org/10.1038/ nm.3967.
3. Yoshihara K, Shahmoradgoli M, Martinez E, et al. Inferring tumour purity and stromal and immune cell admixture from expression data.Nat Com-mun2013;4:2612. https://doi.org/10.1038/ ncomms3612.
4. Newman AM, Liu CL, Green MR, et al. Robust enumeration of cell subsets from tissue expression profiles.Nat Methods2015;12:453–7. https://doi. org/10.1038/nmeth.3337.
5. Collisson EA, Sadanandam A, Olson P, et al. Subtypes of pancreatic ductal adenocarcinoma and their differing responses to therapy.Nat Med2011;17:500–3. https://doi.org/10.1038/nm. 2344.
6. Moffitt RA, Marayati R, Flate EL, et al. Virtual microdissection identifies distinct tumor- and stroma-specific subtypes of pancreatic ductal ade-nocarcinoma.Nat Genet2015;47:1168–78. https:// doi.org/10.1038/ng.3398.
7. Bailey P, Chang DK, Nones K, et al. Genomic analyses identify molecular subtypes of pancreatic cancer.Nature2016;531:47–52. https://doi.org/10. 1038/nature16965.
8. Sivakumar S, de Santiago I, Chlon L, et al. Master regulators of oncogenic KRAS response in pancre-atic cancer: an integrative Network biology analy-sis.PLoS Med2017;14:e1002223. https://doi. org/10.1371/journal.pmed.1002223.
9. Birnbaum DJ, Finetti P, Birnbaum D, et al. Vali-dation and comparison of the molecular classifica-tions of pancreatic carcinomas.Mol Cancer2017; 16:168. https://doi.org/10.1186/
s12943-017-0739-z.
10. Mao Y, Shen J, Lu Y, et al. RNA sequencing ana-lyses reveal novel differentially expressed genes and pathways in pancreatic cancer.Oncotarget 2017;8:42537–47. https://doi.org/10.18632/ oncotarget.16451.
11. Kim S, Kang M, Lee S, et al. Identifying molecular subtypes related to clinicopathologic factors in pan-creatic cancer.Biomed Eng Online2014;13(Suppl 2):S5. https://doi.org/10.1186/1475-925X-13-S2-S5. 12. Janky R, Binda MM, Allemeersch J, et al.
Prog-nostic relevance of molecular subtypes and master regulators in pancreatic ductal adenocarcinoma. BMC Cancer2016;16:632. https://doi.org/10.1186/ s12885-016-2540-6.
13. Haider S, Wang J, Nagano A, et al. A multi-gene signature predicts outcome in patients with pan-creatic ductal adenocarcinoma.Genome Med 2014;6:105. https://doi.org/10.1186/ s13073-014-0105-3.
14. Kirby MK, Ramaker RC, Gertz J, et al. RNA sequencing of pancreatic adenocarcinoma tumors yields novel expression patterns associated with long-term survival and reveals a role for ANGPTL4.Mol Oncol2016;10:1169–82. https:// doi.org/10.1016/j.molonc.2016.05.004. 15. Stratford JK, Bentrem DJ, Anderson JM, et al. A
six-gene signature predicts survival of patients with localized pancreatic ductal adenocarcinoma.
PLoS Med2010;7:e1000307. https://doi.org/10. 1371/journal.pmed.1000307.
16. Donahue TR, Tran LM, Hill R, et al. Integrative survival-based molecular profiling of human pan-creatic cancer.Clin Cancer Res2012;18:1352–63. https://doi.org/10.1158/1078-0432.CCR-11-1539. 17. Connor AA, Denroche RE, Jang GH, et al.
Associ-ation of distinct mutAssoci-ational signatures with corre-lates of increased immune activity in pancreatic ductal adenocarcinoma.JAMA Oncol2017;3: 774–83. https://doi.org/10.1001/jamaoncol.2016. 3916.
18. Hutcheson J, Balaji U, Porembka MR, et al. Immunologic and metabolic features of pancreatic ductal adenocarcinoma define prognostic subtypes of disease.Clin Cancer Res2016;22:3606–17. https://doi.org/10.1158/1078-0432.CCR-15-1883. 19. Knudsen ES, Vail P, Balaji U, et al. Stratification of pancreatic ductal adenocarcinoma: combinato-rial genetic, stromal, and immunologic markers. Clin Cancer Res2017;23:4429–40. https://doi. org/10.1158/1078-0432.CCR-17-0162. 20. Ino Y, Yamazaki-Itoh R, Shimada K, et al.
Immune cell infiltration as an indicator of the immune microenvironment of pancreatic cancer. Br J Cancer2013;108:914–23. https://doi.org/10. 1038/bjc.2013.32.
21. Sinha P, Clements VK, Ostrand-Rosenberg S. Interleukin-13-regulated M2 macrophages in combination with myeloid suppressor cells block immune surveillance against metastasis.Cancer Res2005;65:11743–51. https://doi.org/10. 1158/0008-5472.CAN-05-0045.
22. Chen ML, Pittet MJ, Gorelik L, et al. Regulatory T cells suppress tumor-specific CD8 T cell cytotox-icity through TGF-beta signals in vivo.Proc Natl Acad Sci U S A2005;102:419–24. https://doi. org/10.1073/pnas.0408197102.
23. Royal RE, Levy C, Turner K, et al. Phase 2 trial of single agent Ipilimumab (anti-CTLA-4) for locally advanced or metastatic pancreatic adenocarci-noma.J Immunother2010;33:828–33. https://doi. org/10.1097/CJI.0b013e3181eec14c.
24. Brahmer JR, Tykodi SS, Chow LQ, et al. Safety and activity of anti-PD-L1 antibody in patients with advanced cancer.N Engl J Med2012;366: 2455–65. https://doi.org/10.1056/
NEJMoa1200694.
25. Johnson WE, Li C, Rabinovic A. Adjusting batch effects in microarray expression data using empir-ical Bayes methods.Biostatistics2007;8:118–27. https://doi.org/10.1093/biostatistics/kxj037. 26. Anders S, Huber W. Differential expression
analy-sis for sequence count data.Genome Biol2010;11: R106. https://doi.org/10.1186/gb-2010-11-10-r106. 27. Wilkerson MD, Hayes DN. ConsensusClusterPlus: a class discovery tool with confidence assessments and item tracking.Bioinformatics2010;26:1572–3. https://doi.org/10.1093/bioinformatics/btq170. 28. Network CGAR, Weinstein JN, Colisson EA, et al.
The cancer genome atlas pan-cancer analysis pro-ject.Nat Genet2013;45:1113–20. https://doi. org/10.1038/ng.2764.
29. Monti S, Tamayo P, Mesirov J, et al. Consensus clustering: a resampling-based method for class discovery and visualization of gene expression microarray data.Mach Learn2003;52:91–118. https://doi.org/10.1023/A:1023949509487.
30. Angelova M, Charoentong P, Hackl H, et al. Characterization of the immunophenotypes and antigenomes of colorectal cancers reveals distinct tumor escape mechanisms and novel targets for immunotherapy.Genome Biol2015;16:64. https:// doi.org/10.1186/s13059-015-0620-6.
31. Charoentong P, Finotello F, Angelova M, et al. Pan-cancer immunogenomic analyses reveal genotype-immunophenotype relationships and predictors of response to checkpoint blockade. Cell Rep2017;18:248–62. https://doi.org/10.1016/j. celrep.2016.12.019.
32. Tirosh I, Izar B, Prakadan SM, et al. Dissecting the multicellular ecosystem of metastatic mela-noma by single-cell RNA-seq.Science2016;352: 189–96. https://doi.org/10.1126/science.aad0501. 33. Hanzelmann S, Castelo R, Guinney J. GSVA: gene
set variation analysis for microarray and RNA-seq data.BMC Bioinf2013;14:7. https://doi.org/10. 1186/1471-2105-14-7.
34. Aran D, Hu Z, and Butte AJ. xCell: digitally por-traying the tissue cellular heterogeneity landscape. Genome Biol2017;18:220.
35. Rosenthal R, McGranahan N, Herrero J, et al. DeconstructSigs: delineating mutational processes in single tumors distinguishes DNA repair defi-ciencies and patterns of carcinoma evolution. Genome Biol2016;17:31. https://doi.org/10.1186/ s13059-016-0893-4.
36. Mayakonda A, Koeffler HP. Maftools: Efficient analysis, visualization and summarization of MAF files from large-scale cohort based cancer studies. bioRxiv2016. https://doi.org/10.1101/052662. 37. Team RC.R: a language and environment for
sta-tistical computing. Vienna, Austria: R Foundation for Statistical Computing, 2014.
38. Fridman WH, Pages F, Sautes-Fridman C, et al. The immune contexture in human tumours: impact on clinical outcome.Nat Rev Cancer2012; 12:298–306. https://doi.org/10.1038/nrc3245. 39. Galon J, Mlecnik B, Marliot F, et al. Validation of
the Immunoscore (IM) as a prognostic marker in stage I/II/III colon cancer: results of a worldwide consortium-based analysis of 1,336 patients.J Clin Oncol2016;34:3500.
40. Bindea G, Mlecnik B, Tosolini M, et al. Spatio-temporal dynamics of intratumoral immune cells reveal the immune landscape in human cancer. Immunity2013;39:782–95. https://doi.org/10. 1016/j.immuni.2013.10.003.
41. Natrajan R, Sailem H, Mardakheh FK, et al. Microenvironmental heterogeneity parallels breast cancer progression: a histology-genomic integra-tion analysis.PLoS Med2016;13:e1001961. https:// doi.org/10.1371/journal.pmed.1001961. 42. Ali HR, Chlon L, Pharoah PD, et al. Patterns of
immune infiltration in breast cancer and their clinical implications: a gene-expression-based ret-rospective study.PLoS Med2016;13:e1002194. https://doi.org/10.1371/journal.pmed.1002194. 43. Rosenberg SA, Packard BS, Aebersold PM, et al.
Use of tumor-infiltrating lymphocytes and interleukin-2 in the immunotherapy of patients with metastatic melanoma. A preliminary report. N Engl J Med1988;319:1676–80. https://doi. org/10.1056/NEJM198812223192527.
44. Mlecnik B, Tosolini M, Kirilovsky A, et al. His-topathologic-based prognostic factors of colo-rectal cancers are associated with the state of
Tumor
Immunology
and
the local immune reaction.J Clin Oncol2011;29: 610–8. https://doi.org/10.1200/JCO.2010.30. 5425.
45. Barbie DA, Tamayo P, Boehm JS, et al. System-atic RNA interference reveals that oncogenic KRAS-driven cancers require TBK1.Nature 2009;462:108–12. https://doi.org/10.1038/ nature08460.
46. Spranger S, Bao R, Gajewski TF. Melanoma-intrinsic beta-catenin signalling prevents anti-tumour immunity.Nature2015;523:231–5. https://doi.org/10.1038/nature14404.
47. Ding Y, Shen S, Lino AC, et al. Beta-catenin stabi-lization extends regulatory T cell survival and induces anergy in nonregulatory T cells.Nat Med 2008;14:162–9. https://doi.org/10.1038/nm1707. 48. Luke JJ, Bao R, Spranger S, et al. Correlation of
WNT/-β-catenin pathway activation with immune exclusion across most human cancers.J Clin Oncol2016;34:3004.
49. Vennin C, Murphy KJ, Morton JP, et al. Reshap-ing the tumor Stroma for treatment of pancreatic cancer.Gastroenterology2018;154:820–38. https:// doi.org/10.1053/j.gastro.2017.11.280.
50. Turnis ME, Andrews LP, Vignali DA. Inhibitory receptors as targets for cancer immunotherapy. Eur J Immunol2015;45:1892–905. https://doi. org/10.1002/eji.201344413.
51. Ene-Obong A, Clear AJ, Watt J, et al. Activated pancreatic stellate cells sequester CD8+T cells to reduce their infiltration of the juxtatumoral com-partment of pancreatic ductal adenocarcinoma. Gastroenterology2013;145:1121–32. https://doi. org/10.1053/j.gastro.2013.07.025.
52. Tumeh PC, Harview CL, Yearley JH, et al. PD-1 blockade induces responses by inhibiting adaptive immune resistance.Nature2014;515:568–71. https://doi.org/10.1038/nature13954.
53. Martinelli P, Carrillo-de Santa Pau E, Cox T, et al. GATA6 regulates EMT and tumour
dissemination, and is a marker of response to adjuvant chemotherapy in pancreatic cancer.Gut 2017;66:1665–76.
54. Alexandrov LB, Nik-Zainal S, Wedge DC, et al. Signatures of mutational processes in human can-cer.Nature2013;500:415–21. https://doi.org/10. 1038/nature12477.
55. Rizvi NA, Hellmann MD, Snyder A, et al. Cancer immunology. Mutational landscape determines sensitivity to PD-1 blockade in non-small cell lung cancer.Science2015;348:124–8. https://doi. org/10.1126/science.aaa1348.
56. Snyder A, Makarov V, Merghoub T, et al. Genetic basis for clinical response to CTLA-4 blockade in melanoma.N Engl J Med2014;371:2189–99. https://doi.org/10.1056/NEJMoa1406498. 57. Aran D, Sirota M, Butte AJ. Systematic
pan-cancer analysis of tumour purity.Nat Commun 2015;6:8971. https://doi.org/10.1038/ncomms9971.