An Assessment of
2
An Assessment of Skill Needs in Post-16 Education and Training
Research for the Skills Dialogue undertaken by
Andrew Maginn and Mathew Williams Author Mathew Williams
THE INSTITUTE FOR EMPLOYMENT STUDIES Mantell Building
Falmer Brighton BN1 9RF
UK
Skills Dialogue consultation facilitated by John Rodger
York Consulting Smithfield House
3
Contents
FOREWORD 7
EXECUTIVE SUMMARY 8
Introduction 8
Background to the study 8
Drivers of change (Chapter 1) 9
Current employment in post-16 education and training sector (Chapter 2) 10
Employment trends and projections (Chapter 3) 11
Workforce demographics (Chapter 4) 12
Workforce development and qualifications (Chapter 5) 12
Skills issues and recruitment (Chapter 6) 13
Sector responses to the skills challenge: issues and plans (Chapter 7) 14
1. INTRODUCTION AND BACKGROUND 15
1.1 Background to the study 15
1.2 Drivers of change 16
1.3 Definitions of the sector 18
2. CURRENT EMPLOYMENT IN POST-16 EDUCATION AND TRAINING SECTOR 21
2.1 Introduction and summary 21
2.2 Employment in post-16 education and training 22
2.3 Employment by occupation 22
2.4 Employment by sub-sector 22
2.5 Employment by region 25
3. EMPLOYMENT TRENDS AND PROJECTIONS 26
3.1 Introduction and summary 26
3.2 Historic trends 27
3.3 Future projections 28
3.4 Changing occupational balance 32
3.5 Replacement demand 32
4
4. WORKFORCE DEMOGRAPHICS 36
4.1 Introduction and summary 36
4.2 Gender 37
4.3 Age 37
4.4 Ethnicity 38
4.5 Disability 39
4.6 Staff record data 40
5. WORKFORCE DEVELOPMENT AND QUALIFICATIONS 42
5.1 Introduction and summary 42
5.2 Extent of training 42
5.3 Qualifications 44
6. SKILLS ISSUES AND RECRUITMENT 47
6.1 Introduction and summary 47
6.2 Recruitment and vacancies 48
6.3 Recruitment difficulties and skills shortages 48
6.4 Skills gaps 54
6.5 Future skills issues 59
7. SECTOR RESPONSES TO THE SKILLS CHALLENGE: ISSUES AND PLANS 62
7.1 Introduction 62
7.2 Context 62
7.3 Increasing basic skills teaching and training 63
7.4 Transferability of qualifications across the sector 64 7.5 Measuring and delivering a more equal and diverse workforce 64 7.6 Supporting professional development of teaching and research staff,
including mandatory qualifications where appropriate to sub-sector 65 7.7 Encouraging more and better management development 66 7.8 Improving take-up and use of information and learning technology 67
7.9 Developing support staff 68
7.10 Improving data and intelligence 68
7.11 Improving adult literacy, numeracy and English for Speakers of
Other Languages (ESOL) skills for manual staff 69
7.12 Technician training 69
5
Index of Figures and Tables
Table 2.1: Employment in the post-16 education and training sector,
Spring 2001, UK 21
Table 2.2: Occupational employment in the post-16 education and training
sector, Spring 2001, UK 23
Table 2.3: Employment in work-based learning and training (Employment NTO),
Spring 2001, UK 23
Table 2.4: Employment in post-16 education and training sector by region,
Spring 2001, UK 24
Figure 3.1: Employment trends for post-16 education and training establishments,
1995-2000, GB 27
Figure 3.2: Employment trends for post-16 education and training establishments,
1971-1999, UK 28
Figure 3.3: Employment projections for post-16 education and training
establishments, 1999-2010, UK 29
Figure 3.4: Output projections for post-16 education and training establishments,
1999-2010, UK 30
Figure 3.5: Productivity projections for post-16 education and training
establishments, 1999-2010, UK 31
Table 3.1: Employment projections for work-based learning and training,
1999-2010, UK 31
Table 3.2: Changing occupational employment in post-16 education and
training sector, 1999-2010, UK 32
Table 3.3: Net replacement demand analysis for post-16 education and training,
1999-2010, UK 33
Figure 3.6: Replacement demand and net requirements by occupation for post-16 education and training sector, 1999-2010, UK (absolute numbers) 33
Table 3.4: Projections of economically active by higher qualification, UK (thousands) 35
Table 4.1: Employment in post-16 education and training sector by sex,
Spring 2001, UK 37
Table 4.2: Employment in post-16 education and training sector by age,
Spring 2001, UK 38
Table 4.3: Employment in post-16 education and training sector by ethnicity,
Spring 2001, UK 38
Table 4.4: Employment in post-16 education and training sector by disability,
Spring 2001, UK 40
Table 5.1: Whether post-16 education and training workers participated in
6
Figure 5.1: Proportion of UK HEI staff who received training or development in
last 12 months, by occupational group, 2001 44
Table 5.2: Types of off-the-job training arranged by post-16 education and training
establishments, 2000/2001, England 45
Table 5.3: Highest qualification of workers in post-16 education and training
sector, Spring 2001, UK 46
Figure 6.1: Vacancies reported by post-16 education and training establishments,
July 1995-Oct 2000, Great Britain 48
Table 6.1: Vacancies in post-16 education and training establishments,
2000/01, England 49
Table 6.2: Skills found difficult to obtain in relation to skills shortage vacancies,
post-16 education and training establishments, 2000/01, England 49
Table 6.3: Main causes of skills shortage vacancies, post-16 education
and training establishments, 2000/01, England 50
Figure 6.2: Average gross weekly earnings for all employees in post-16 education
and training sectors, GB, 1997-2001 51
Table 6.4: Effects of skills shortage vacancies, post-16 education and training
establishments, 2000/01, England 52
Table 6.5: Responses to skills shortage vacancies, post-16 education and
training establishments, 2000/01, England 52
Table 6.6: Skills reported as lacking in internal skills gaps among post-16
education and training establishments, 2000/01, England 55
Table 6.7: Causes of internal skills gaps among post-16 education and training
establishments, 2000/01, England 56
Table 6.8: Implications of a lack of proficiency among post-16 education and
training establishments, 2000/01, England 56
Table 6.9: Responses to internal skills gaps among post-16 education and
training establishments, 2000/01, England 57
Table 6.10: Barriers to maintaining a fully proficient workforce in post-16
education and training establishments, 2000/01, England 59
Table 6.11: Future skill needs of post-16 education and training establishments,
7
Foreword
Skills Dialogues are commissioned and funded by the Skills Intelligence Team at the
Department for Education and Skills (DfES). They are high level strategic discussions grouping sectors with similar agendas. The Further Education National Training Organisation (FENTO) has led on this particular dialogue and worked with the Employment National Training
Organisation (EmpNTO), the Higher Education Staff Development Agency (HESDA) and PAULO to look at issues in wider, non-compulsory education and training, bringing together views from further, higher, community and work based training sectors/organisations.
Working with the DfES, the Learning and skills Council (LSC) and other government agencies, we commissioned the Institute for Employment Studies (IES) to consolidate existing data from each sector and draft a report. The draft report was considered at five focus group meetings held around the United Kingdom to which practitioners from the above sectors were invited to make their comments. This skills dialogue report is based on all the available statistical evidence and takes full account of the discussions and views expressed at each of the focus groups.
We would formally thank the practitioners in our sectors who attended and contributed to the focus group events. We are indebted to them as without their input this skills dialogue report would not have been possible.
David Hunter Tony green
FENTO EmpNTO
Sally Neocosmos Phil Denning
8
Executive Summary
Introduction
This report summarises the most up-to-date information about skills issue in the post-16 education and training sector. In particular, it seeks to draw together common themes that affect employers and employees working in further and higher education, community and adult education, and training and workforce development.
Background to the study
At least 1.05 million people work in post-16 education and training: in further education, higher education, and in the community, workplace, private and voluntary sectors. They play a vital role in providing the skills and qualifications required by society and employers, but they can only fulfil this role if they themselves are able to recruit, retain and develop the human resources they need.
The Department for Education and Skills (DfES) joined forces with four National Training Organisations (NTOs) to assess the future skills needs of the post-16 Education and Training Sector across the UK as a whole. For the first time all the key players are working together to:
q
map out the skills that are most needed across the entire sector;q
communicate common needs to agencies that can help deliver the workforce that thepost-16 education sector requires (eg the Learning and Skills Council and Regional Development Agencies).
Four NTOs are taking the lead in representing the sector:
q
FENTO, representing Further Education.q
HESDA, representing Higher Education.q
PAULO, representing community-based learning and development.q
Employment NTO, representing personnel, training and development professionals,trade union professional officers, advice, guidance and counselling workers, and occupational health and safety officers who span across all industrial sectors.
Data on skills issues in the education and training sector has traditionally been weak because of, among other things, the plethora of agencies representing interests within the sector, and problems mapping the sector onto existing industrial and occupational classifications.
9
Drivers of change (Chapter 1)
Post-16 education and training serves many purposes and needs, and produces a wealth of benefits that are not economic or even measurable in quantifiable terms. However, it also serves directly measurable economic and social needs in equipping adults with the skills, knowledge and qualifications required to sustain and develop a thriving economy and society. The government set out its own perspective on this in its The Learning Age green paper (1998):
‘Learning is the key to prosperity - for each of us as individuals, as well as for the nation as a whole. Investment in human capital will be the foundation of success in the knowledge-based global economy of the twenty-first century. This is why the Government has put learning at the heart of its ambition.’
The thrust of policy is towards:
q
a culture and practice of lifelong learning, in which the state, employers andindividuals share responsibility. Put simply, the policy is for everyone to learn, and to carry on learning, throughout and even beyond their working life;
q
stimulate demand for learning, and target such stimuli particularly at groupsand individuals least likely to participate.Aside from social cohesion and fairness issues, such a policy pragmatically recognises that in saturated education and training markets, the only means of growth is to reach out to non-traditional learners and excluded groups;
q
improve the basic skills of adults with literacy and numeracy problems.The DfES Adult Basic Skills Strategy unit is working to implement the recommendations of the Moser report and Skills for Life to improve basic skills levels among the seven million adults with literacy or numeracy problems;
q
develop more capacity but also enhanced capability of supply, throughenhanced quality amongst all providers of post-16 education and training.
New inspection regimes for higher, further and work-based education and training are evidence of the commitment of government to sharpen and improve the role of inspection and quality assurance;
q
an increase in earmarked government funds for post-16 education and training,to support increased participation. The government has set and retains an ambitious aim of increasing participation in higher education from a third to half of young people;
q
the progressive implementation or further development of many recommendationsarising out of the National Skills Task Force,including vital work on labour market and skills intelligence that the new Sector Skills Councils have a key role in delivering;
q
development of a coherent and relevant vocational qualification systemthathelps reward individual learners (through the increased mobility a national qualification facilitates) whilst recognising employer antagonism to expensive, irrelevant or
bureaucratic qualification systems that ultimately may lead to excessive staff turnover.
The government’s proposed 14-19 agenda will have a significant impact on the further education sector, if not on the other sub-sectors. Although the implications are not fully understood, there are likely to be issues in terms of accommodating and responding to younger age groups, and new relationships between FE and both schools and the higher education sector, which in turn may have implications for the image of FE and the skill needs of the sector.
10
Funding for post-16 education and training has a big influence on the sector, not only the level of, but also the nature of funding. Much funding is provided on a short-term, bid-by-bid basis, which can distort activity and constrain long-term planning, innovative response and flexible operation.
One issue should be underlined above all others: quality. Improved quality and systematic use of quality assurance systems will create considerable demands for the specific skills in the post-16 education and training system, and strongly reinforce the drive towards
professionalisation and mandatory qualifications for staff in some areas.
In its Workforce Development Report (2001) the Cabinet Office’s Performance and Innovation Unit (PIU) makes a strong argument for increasing the demand-led nature of post-16 education and training. This project is very important to this Dialogue group (despite explicitly excluding Higher Education from its remit) as it provides clues for future developments in the areas of further, adult and workplace education and training. The project goals are that ‘in 2010, the UK will be a society where Government, employers and individuals actively engage in skills development to deliver sustainable economic success for all’, and it observes that:
‘The quality of provision available from publicly funded FE colleges and private training providers is variable and there is a need to raise standards further across the board.’
The PIU report cites work by the Employment NTO in developing occupational standards as an example of work to increase quality in work-based training and learning contexts, and the DfES/LSC Standards Fund in supporting staff development in further education.
The situation for higher education is more complex, with the whole area of quality assurance having been under review. However, whilst the HE system appears to be moving away from external inspection as a key tool of quality, the requirements for internal and self-assessing measures are, if anything, increasing over time. In that sense there is a common theme running throughout the post-16 education and training sector, of quality assurance becoming more important and requiring higher and different types of skills from some staff.
Current employment in post-16 education and
training sector (Chapter 2)
This Chapter presents information on the current level of employment in the post-16 education and training sector, looking at the total employment level, employment by occupation and in the individual sub-sectors, and the regional distribution of post-16 education and training employment. Data is from the Spring 2001 Labour Force Survey.
The key points are:
q
In Spring 2001 the post-16 education and training sector employed 1.05 millionworkers, and accounted for 3.7 per cent of total employment in the UK.
q
The higher education sector makes up nearly 40 per cent of this total,some 413,000 workers.
q
Employment is concentrated at the higher end of the occupational scale. Some twothirds of the workforce are employed in professional and associate professional occupations, generally requiring qualifications at degree level, and the largest group outside these occupations is managers and administrators.
q
There are occupational differences between the sub-sectors within post-16 education11
q
Over half of total employment in further and higher education is in professionaloccupations.
q
The community-based learning and development sector has proportionately fewerprofessional workers, and proportionately more managers and administrators and associate professionals than further and higher education.
q
The work-based learning and training sector is defined as specific managerial andassociate professional occupations.
q
The largest numbers of post-16 education and training workers are in Londonand the South East, while the highest concentrations by region are in London, Merseyside, and Wales.
Employment trends and projections (Chapter 3)
This Chapter describes the changing numbers and patterns of demand for workers, both historic and projected, in the post-16 education and training sector. Data on historic trends and future projections are from Cambridge Econometrics and the Institute for Employment Research. The key points are:
q
Employment in the post-16 education and training sector has grown at a faster ratethan overall employment during the last three decades.
q
This faster than average employment growth is projected to continue over the nextdecade. By 2010 the employment level in the sector is expected to have increased by 195,000.
q
Employment growth is expected to be faster in the work-based learning and trainingsector than in post-16 education and training establishments in the further, higher and other adult education sectors.
q
By occupation, the largest increases in employment are projected for professional andassociate professional occupations, while the numbers of clerical and secretarial workers and elementary staff are projected to decrease.
q
The sector will also need to replace people who leave the sector, in addition torecruiting for expansion. The number of people the sector will need to recruit to replace leavers is likely to be 60 per cent higher than the level of employment growth in the sector, at 325,000. Thus, over the next decade the sector will need to recruit 520,000 new workers.
q
As with expansion demand, the largest levels of replacement demand will be forprofessional and associate professional occupations, and over the next decade the sector will need to recruit around 600,000 professional and associate professional workers.
q
Recruitment on this scale represents a significant problem for the sector. Moreemphasis needs to be put on staff retention, clearer career structures, and improved reward packages.
q
The number of highly skilled people (degree level or equivalent or higher) in theeconomy is projected to grow by at least 2.3 million to 2010. and
q
The increase in the supply of highly skilled people is only four times greater than thehighly skilled recruitment needs of the post-16 education and training sector; therefore the sector is likely to find itself in competition with other sectors for this highly
12
Workforce demographics (Chapter 4)
This Chapter looks at the demographic characteristics, including sex, age, ethnicity and disability of the post-16 education workforce, using data from the Spring 2001 Labour Force Survey. Key points are:
q
Women make up 56 per cent of the post-16 education and training workforce,compared with 45 per cent of overall employment.
q
The work-based learning and training sector has the highest proportion of women,at 63 per cent, while the higher education sector has the lowest, at 51 per cent.
q
Among the higher level occupations, the over-representation of women is less marked,indeed there are slightly more male professional workers than female.
q
The proportion of women in the post-16 education and training workforce hasincreased in recent years, and is projected to continue to do so, so that by 2010 women may comprise 62 per cent of total employment in the sector.
q
The post-16 education and training sector has an older age profile than overallemployment. Workers aged under 30 make up 19 per cent of post-16 education and training staff, compared with a quarter of all workers.
q
The work-based learning and training sector has a younger age profile than the otherthree sectors.
q
The proportion of both young and old workers in the post-16 education and traininghas increased in the last five years, although the average age of workers in the sector has remained static.
q
The proportion of ethnic minorities in post-16 education and training, at 5.3 per cent,is very close to the national average of 5.1 per cent. However, there are issues about the level to which staff from ethnic minority groups have risen in the hierarchies.
q
However, the proportion of ethnic minorities among the population aged 16 to 34,the main client group for the sector, is much higher at 10 per cent. Therefore in many organisations there is a mismatch between the ethnic profile of teachers and learners.
q
The community-based learning and development and higher education sectors havethe highest proportions of ethnic minority workers.
q
There may be an under-representation of Asian workers in the post-16 education andtraining sector.
q
The proportion of people with a disability in the post-16 education and training sectoris the same as the proportion of disabled people in total employment, at 12 per cent. The proportion is highest in the further education sector, and lowest in the community-based learning and development sector.
Workforce development and qualifications (Chapter 5)
This Chapter examines the training and development received by the workforce of the post-16 education and training sector, and broadly at the qualification base of those working in the sector. The chapter draws on a number of data sources including the Spring 2001 Labour Force Survey, the 2000/01 Employer Skills Survey, and a HESDA survey of higher education institutions. The key points are:q
Workers in the post-16 education and training sector are more likely than average to13
q
The further education sector is most likely to train its workforce, with 27 per cent ofworkers receiving training, while the work-based learning and training sector is least likely, with 20 per cent of the workforce being trained.
q
The likelihood of receiving training is greater for staff in professional and associateprofessional occupations than for those in managerial, administrative, clerical, secretarial and elementary occupations.
q
Post-16 education and training establishments are much more likely than average tohave arranged or funded training for their workforce in the last year, with 64 per cent of post-16 education and training establishments arranging training compared with 37 per cent of all establishments.
q
Post-16 education and training establishments are also more likely to train themajority of their workforce than are establishments across all sector.
q
Looking at the types of training arranged or funded, post-16 education and trainingestablishments are more likely than average to arrange supervisory training, induction training, and soft and generic skills training, and less likely than average to arrange training in new technologies.
q
The post-16 education and training workforce is very highly qualified, with nearly 60per cent having a first degree or equivalent, or higher qualification. Across all sectors only 27 per cent of workers are qualified at this level or above.
q
Within the post-16 education and training sector, the highest qualification levels arefound in the higher education sector. Two thirds of higher education workers have at least first degree level qualifications.
q
The proportion of highly qualified workers in the further education and other adulteducation sectors is 62 per cent and 58 per cent respectively.
q
The lowest qualification levels are in the work-based learning and training sector,with 49 per cent of workers being qualified to at least first degree level or equivalent, although this is still well above the average for the entire workforce.
Skills issues and recruitment (Chapter 6)
This chapter considers the extent and nature of skills shortages and skills gaps within the education sector based on the available evidence on recruitment difficulties and hard-to-fill vacancies, and employer views about the proficiency of their workforce. The main data source for this chapter is the 2000/01 Employer Skills Survey. Key points of the chapter are:
q
Vacancies in the post-16 education and training sector have increased slowly butsteadily over the last few years, while nationally vacancies have remained stable.
q
Nearly four out of ten vacancies in post-16 education and training are hard-to-fill,compared with nearly half of vacancies across all sectors.
q
However, the proportion of post-16 education and training vacancies that arehard-to-fill for skill related reasons is the same as the national average, at one in five.
q
The skills which are difficult to obtain are predominantly general technical and practicalskills, advanced IT skills, communication skills and management skills. These are common across all the sub-sectors within this Dialogue project.
q
Reasons for skills shortages included low numbers of skilled applicants, low numbersof applicants generally, and lack of qualifications and work experience among applications.
q
However, low pay may be a cause of skills shortages in some sub-sectors14
q
The most common response to skills shortage vacancies was to increase recruitmentefforts, by expanding recruitment channels or spending more on advertising and recruiting.
q
Skills gaps were reported among professional, technical, managerial, and clerical andsecretarial staff. The skills most commonly reported as lacking were communication skills, advanced IT or software skills, and management skills.
q
High staff turnover and the inability of staff to keep up with change were the mostcommonly reported reasons for a lack of proficiency among the workforce, and the main implications of a lack of proficiency were problems introducing new work practices, problems meeting required quality standards, and problems meeting customer service objectives.
q
The most common response to skills gaps was to provide further training, followed bychanging working practices, relocating work within the organisation, and expanding trainee programmes.
q
The most significant barriers to maintaining a fully proficient workforce among post-16education and training establishments are lack of time for training, lack of cover for training, and a lack of funding for training. The effects of a lack of funding may be exacerbated by the short-term nature of funding arrangements.
q
It is the skills in which post-16 education and training establishments are currentlyexperiencing gaps, i.e. IT, communication and management skills, that are going to become more important in the future. In other words, these are issues that show no signs of going away.
Sector responses to the skills challenge:
issues and plans (Chapter 7)
In this chapter we review the main thrust of thinking emerging from the sector to date as a response to labour market and skills data. Sector Workforce Development Plans (SWDPs) have been drawn up by NTOs to marshal the priorities of sector institutions and other stakeholders in workforce development. This chapter draws together key findings from these SWDPs, thematically for the whole post-16 education sector. The key priority areas are:
q
Increasing basic skills teaching and training.q
Transferability of qualifications across the sector.q
Measuring and developing a more equal and diverse workforce.q
Supporting professional development of teaching and research staff, includingmandatory qualifications.
q
Encouraging more and better management development.q
Improving take-up and use of information and learning technology.q
Developing support staff.q
Improving labour market and skills data and intelligence.q
Improving adult literacy, numeracy and English for Speakers of Other Languages(ESOL) skills for manual staff.
15
1. Introduction and Background
This report summarises the most up-to-date information about skills issue in the post-16 education and training sector. In particular, it seeks to draw together common themes that affect employers and employees working in further and higher education, community and adult education, training and workforce development.
1.1 Background to the study
At least 1.05 million people work in post-16 education and training: in further education, higher education, and in the community, workplace, private and voluntary sectors. They play a vital role in providing the skills and qualifications required by society and employers, but they can only fulfil this role if they themselves are able to recruit, retain and develop the human resources they need.
The Department for Education and Skills (DfES) joined forces with four National Training Organisations (NTOs) to assess the future skills needs of the post-16 Education and Training Sector. The NTOs have responsibility for their sectors across the whole of the United
Kingdom. For the first time all the key players are working together to:
q
map out the skills that are most needed across the entire sector;q
communicate common needs to agencies that can help deliver the workforce that thepost-16 education and training sector requires (eg the Learning and Skills Council and Regional Development Agencies).
Four NTOs are taking the lead in representing the sector;
q
FENTO, representing Further Education.q
HESDA, representing Higher Education.q
PAULO, representing community-based learning and development.q
Employment NTO, representing personnel, training and development professionals,trade union professional officers, advice, guidance and counselling workers, and occupational health and safety officers, who span across all industrial sectors. Data on skills issues in the education and training sector has traditionally been weak, because of the:
q
plethora of agencies and bodies representing various interests within the varioussectors and sub-sectors;
q
blurred boundaries between institutions, sectors and occupations that can limit theutility of major national datasets (e.g. some surveys cannot distinguish higher and further education staff, while in others these two groups cannot be compared);
q
a focus on academic staff, which has tended to distract attention from the skills issuesfor other staff within educational institutions (e.g. the so-called ‘support staff’ in further education and ‘non-academic’ staff in higher education).
Improving labour market and skills data and intelligence has been identified as a priority for action by some of the NTOs to help overcome some of these weaknesses.
16
1.2 Drivers of change
Post-16 education and training serves many purposes and needs, and produces a wealth of benefits that are not economic or even measurable in quantifiable terms. However, it also serves directly measurable economic and social needs in equipping adults with the skills, knowledge and qualifications required to sustain and develop a thriving economy and society. The government set out its own perspective on this in its The Learning Age green
paper (1998):
‘Learning is the key to prosperity - for each of us as individuals, as well as for the nation as a whole. Investment in human capital will be the foundation of success in the knowledge-based global economy of the twenty-first century. This is why the Government has put learning at the heart of its ambition.’
The drivers of changing skills requirements (of staff) in post-16 education and training are primarily the same as those driving national policy to help develop and deliver education and training to all who need it. The government is the single most noteworthy ‘driver’ here, although in many senses it co-ordinates, exhorts and assists rather than delivers or requires. For example, a large majority of work-based training is funded by employers rather than the state, and quite significant sums of the higher and further education budgets are provided by individuals and companies as customers, rather than the state in grant-aid.
In the area of labour market and skills policy, governments have traditionally consulted and compromised with key stakeholders including employer groups, professional bodies, trades unions, universities and learned societies, and the associated bodies and agencies that in one way or another support the infrastructure of post-16 education and training. That is not to say that there is always consensus or even agreement on specifics: for example,
government policy on qualifications (e.g. NVQs) has arguably been so ambitious and formal that some employers have simply said ‘not for us’. However, and increasingly in recent years, there is now a powerful coherence in policy-making that assists in planning of areas such as the one this Dialogue is concerned with - what skills do the post-16 education and training workforce need in the future, and in what quantities.
The importance of stakeholders is hard to exaggerate, and it is vital to recognise that while HE and FE institutions are of course important centres of formal learning, a huge amount of learning (formal and informal, and not all leading to qualifications) is delivered elsewhere and by others in a range of innovative models, such as trades union workplace learning representatives. As a recent example of the type of activity driving change, Littlewoods has signed a lifelong learning agreement with USDAW and the GMB, formalising company support for Union Learning Representatives. Under this agreement, eighteen union reps have been trained to date and have received paid time for training.
The thrust of relevant government policy is towards:
q
a culture and practice of lifelong learning, in which the state, employers andindividuals share responsibility.Put simply, the policy is for everyone to learn, and to carry on learning, throughout and even beyond their working life. Specific instruments have been created by government in response to perceived market failure or deficiencies, e.g. learndirect, Ufi and Individual Learning Accounts. This policy objective underpins everything else, and is essentially permissive in nature:
government will try to help make lifelong learning a reality - in any constructive ways that are within its powers, resources and responsibilities;
q
stimulate demand for learning, and target such stimuli particularly at groups17
q
improve the basic skills of adults with literacy and numeracy problems.The DfES Adult Basic Skills Strategy unit is working to implement the recommendations of the Moser report and Skills for Life to improve basic skills levels among the seven million adults with literacy or numeracy problems;
q
develop more capacity but also enhanced capability of supply, throughenhanced quality amongst all providers of post-16 education and training.
New inspection regimes for higher, further and work-based education and training are evidence of the commitment of government to sharpen and improve the role of inspection and quality assurance;
q
an increase in earmarked government funds for post-16 education and training,to support increased participation. The government has set and retains an ambitious aim of increasing participation in higher education from a third to half of young people;
q
the progressive implementation or further development of manyrecommendations arising out of the National Skills Task Force,including vital work on labour market and skills intelligence that the new Sector Skills Councils have a key role in delivering;
q
development of a coherent and relevant vocational qualification systemthathelps reward individual learners (through the increased mobility a national qualification facilitates) whilst recognising employer antagonism to expensive, irrelevant or
bureaucratic qualification systems that ultimately may lead to excessive staff turnover. A recent development which will have implications for at least the further education sector, if not the other areas of post-16 education and training, is the government’s 14 to 19 agenda, outlined in the Green Paper ‘14-19: extending opportunities, raising standards’. Although the implications for the sector are not fully understood, there are likely to be issues, for example, in terms of accommodating and responding to a younger age group, and the new relationships between FE, schools and the higher education sector which may have implications for the image of FE, and the skill needs of the sector.
The devolved administrations in Wales, Scotland and Northern Ireland have an important role to play in supporting the development of the education and training sectors in their areas.
There are many other important policies, instruments and measures, not just those of government, but of other agencies (e.g. the Learning and Skills Council) that are relevant, although ultimately they tend to cohere with the ‘big picture’ aims agreed with government and summarised above: more people learning, better targeting of provision to address labour market needs, and a network of higher quality providers operating coherent qualification frameworks.
One further issue, touched upon in more depth in the next section of this chapter, should be underlined above all others: quality. Improved quality and systematic use of quality
assurance systems will create considerable demands for the specific skills in the post-16 education and training system, and strongly reinforce the drive towards professionalisation and mandatory qualifications for staff in some areas.
18
Workforce development strategy
In its Workforce Development Report (2001) the Cabinet Office’s Performance and Innovation Unit (PIU) makes a strong argument for increasing the demand-led nature of post-16 education and training. This project is very important to this Dialogue group (despite explicitly excluding Higher Education from its remit) as it provides clues for future developments in the areas of further, adult and workplace education and training. The project goals are that ‘in 2010, the UK will be a society where Government, employers and individuals actively engage in skills development to deliver sustainable economic success for all.’
The PIU argue for more local flexibility and discretion to meet needs (principally but not exclusively labour market needs), and acknowledge that the use of such flexibility and discretion will create skills demands on those working in post-16 education and training. In terms of future delivery this has implications for outreach activity, the size and scale of workplaces, and delivery mechanisms.
The report endorses the recent Learning and Skills Council (LSC) strategy for quality, noting again that this will require improved opportunities for staff development amongst those working for education and training providers.
The PIU report observes that:
‘The quality of provision available from publicly funded FE colleges and private training providers is variable and there is a need to raise standards further across the board.’
The report also raises the need for providers to face-up to management challenges that the need for rapid change and raised quality imply, and recognises the difficulties with this that private and voluntary providers may face due to limited funds.
The PIU report cites work by the Employment NTO in developing occupational standards as an example of work to increase quality in work-based training and learning contexts, and the DfES/LSC Standards Fund in supporting staff development in further education.
The situation for higher education is more complex, with the whole area of quality assurance having been under review. However, whilst the HE system appears to be moving away from external inspection as a key tool of quality, the requirements for internal and self-assessing measures are, if anything, increasing over time. In that sense there is a common theme running throughout the post-16 education and training sector, of quality assurance becoming more important and requiring higher and different types of skills from some staff.
The national workforce development plan of the PIU should not be confused with the
sectoral workforce development plans that were being taken forward by NTOs and which are referred to in the last chapter of this report. They are complementary but different.
1.3 Definitions of the sector
In this section we describe the definition of the post-16 education and training sector that is used throughout the Dialogue.
1.3.1 Post-16 education and training sector
We listed above the four NTOs that are participating in this Dialogue project. We now define them in terms of the standard classifications used in labour market information. Industrial sectors in the official datasets are classified according to the Standard Industrial
19
Occupational Classification (SOC) 2000. SIC describes the activity of an establishment, and SOC describes the task or role of individuals in their work.
Definitions of the four sub-sectors and any issues concerning their definition, are given in turn. Throughout the report the sector is referred to as the post-16 education and training sector. The term ‘sub-sector’ is generally used to describe areas served by individual NTOs, e.g. higher education.
Further education
The further education sector is defined as the following two SIC categories:
q
SIC 80.22 — Technical and vocational secondary education.q
SIC 80.301 — Sub-degree level higher education.It should be noted that this definition does not encompass all further education
establishments. Some will fall into the SIC category 80.21 General secondary education, although this category includes all pre-16 secondary education. Therefore the sector we are examining in this Dialogue project contains only FE establishments, but will not contain all FE establishments.
Higher education
The higher education sector is defined as the following SIC category:
q
SIC 80.302/3 — First- and post- degree level higher education.This category is a direct match with the higher education sector.
Community-based learning and development (PAULO)
The PAULO sector is defined as the following SIC category:
q
SIC 80.42 — Adult and other education not elsewhere classified.It should be noted that this category includes private training providers. Also, some establishments in the PAULO sector will fall outside this category, and into social work activities categories, although to include social work establishments would give a misleading picture of the sector.
Work-based learning and training (Employment NTO)
The Employment NTO sector is defined in terms of occupations and the jobs people do, rather than industrial sectors as is the case with the other three sectors. The Employment NTO Skills Foresight report maps the area onto the old Standard Occupational Classification 1990, and we have used that mapping as the basis of our definition of the sector based on the new Standard Occupational Classification 2000. The Employment NTO covers the following occupations defined in SOC 2000:
q
SOC 1135 — Personnel, training and industrial relations managers.q
SOC 3562 — Personnel, training and industrial relations officers.q
SOC 3563 — Vocational and industrial trainers and instructors.q
SOC 3567 — Occupational hygienists and health and safety officers.20
1.3.2 Other definitions used
Certain data sources do not allow us to present information for the whole post-16 education and training sector, and therefore we have to use modified definitions of the sector.
In some cases, data is only available by industrial sector. This is the case for information on employment trends and projections in Chapter 3, and in data from the Employer Skills Survey in Chapters 5 and 6. In these instances the data refers to establishments in the further education, higher education, and community-based learning and development sectors, and are referred to as post-16 education and training establishments. This data will include some work-based learning and training staff that are employed within these establishments, but will not include such staff employed in other industrial sectors.
21
2. Current Employment in Post-16 Education and
Training Sector
2.1 Introduction and summary
This chapter presents information on the current level of employment in the post-16
education and training sector in the United Kingdom, looking at the total employment level, employment by occupation and in the individual sub-sectors, and the regional distribution of post-16 education and training employment. This chapter draws on data from the Labour Force Survey for Spring 2001 for the whole of the UK.
The key points of the chapter are:
q
In Spring 2001 the post-16 education and training sector employed some 1.05 millionworkers, and accounted for 3.7 per cent of total employment in the UK.
q
The higher education sector makes up nearly 40 per cent of this total, some 413,000workers.
q
Employment is concentrated at the higher end of the occupational scale. Sometwo-thirds of the workforce are employed in professional and associate professional occupations, generally requiring qualifications at degree level. The largest group outside these occupations is managers and administrators.
q
There are occupational differences between the sub-sectors within post-16 educationand training:
q
over half of total employment in further and higher education is in professionaloccupations;
q
the community-based learning and development sector has proportionately fewerprofessional workers, and proportionately more managers and administrators and associate professionals in further and higher education;
q
the work-based learning and training sector is defined as specific managerial andassociate professional occupations.
q
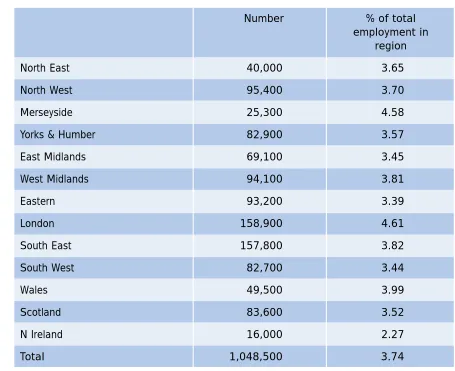
The largest numbers of post-16 education and training workers are in London and [image:21.595.50.483.575.798.2]the South East, while the highest concentrations by region are in London, Merseyside, and Wales.
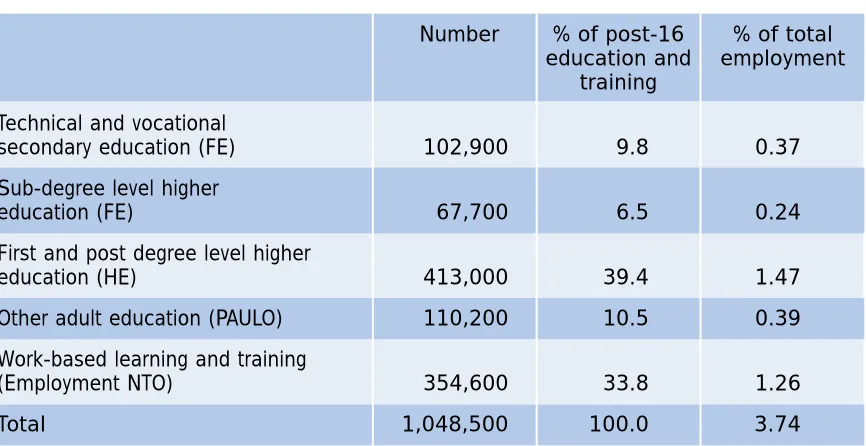
Table 2.1: Employment in the post-16 education and training sector, Spring 2001, UK Number % of post-16 % of total
education and employment training
Technical and vocational
secondary education (FE) 102,900 9.8 0.37
Sub-degree level higher
education (FE) 67,700 6.5 0.24
First and post degree level higher
education (HE) 413,000 39.4 1.47
Other adult education (PAULO) 110,200 10.5 0.39
Work-based learning and training
(Employment NTO) 354,600 33.8 1.26
Total 1,048,500 100.0 3.74
22
2.2 Employment in post-16 education and training
According the sectoral and occupational definitions described in Section 1.3, estimates from the Labour Force Survey (LFS) show that the post-16 education and training sector employed 1.05 million people in the United Kingdom in Spring 2001 (Table 2.1). This includes both employees and the self-employed. The self-employed make up significant minorities of the workforces in technical and vocational secondary education, and in other adult education. Overall the post-16 education and training sector accounts for 3.7 per cent of total employment in the UK.
The sector employs a large part-time workforce, with 26 per cent of people employed in the sector working part-time.
Higher education is the largest component, accounting for nearly 40 per cent of the post-16 education and training workforce, while work-based learning and training accounts for one-third of the total, further education accounts for 16 per cent, and other adult education for 11 per cent.
2.3 Employment by occupation
Table 2.2 shows the breakdown by occupation of employment in the post-16 education and training sector. Professional and associate professional workers make up two-thirds of total employment. Professional workers are the larger group, numbering 366,000 and accounting for 35 per cent of total post-16 education and training employment, while the 337,000 associate professional workers make up 32 per cent of total employment in the sector.
Other major groups include managers and administrators (14 per cent of total employment), clerical and administrative workers (nine per cent) and elementary workers (five per cent). Elementary occupations are those which do not require formal qualifications and include elementary office workers, porters, cleaners, security staff, car park attendants etc.
2.4 Employment by sub-sector
2.4.1 Higher education
In Spring 2001 there were 413,000 workers in higher education (Table 2.1). The largest occupational group in HE in Spring 2001 was professionals - 222,000 workers or 54 per cent of the total (Table 2.2). There were 46,000 associate professionals (11 per cent), 62,000 administrative and clerical workers (15 per cent), and 19,000 managers and administrators (five per cent). Twenty-seven per cent of higher education staff work part-time.
2.4.2 Further education
Estimates from the LFS show 171,000 workers in further education in the UK in Spring 2001 (Table 2.1).
Turning to the occupations employed in FE, over half (56 per cent) of the workforce are in professional occupations, a higher proportion than in higher education or other adult
23
Table 2.2: Occupational employment in the post-16 education and training sector, Spring 2001, UK
All All FE HE PAULO Emp NTO -sector -sector
Number % % % % %
Managers and administrators 147,400 14.1 4.2 4.7 10.2 31.0
Professional occupations 366,000 34.9 56.2 53.7 43.7 — Associate professional occupations 337,300 32.2 11.6 11.3 23.6 69.0
Clerical and secretarial occupations 93,500 8.9 10.0 15.2 12.5 —
Personal service occupations 32,800 3.1 8.6 3.3 4.0 —
Elementary occupations 53,700 5.1 6.7 9.0 4.8 —
Other occupations 17,700 1.7 2.9 2.9 1.1 —
Total 104,850 100 100 100 100 100
Source: LFS, Spring 2001
2.4.3 Community-based learning and development sector
In Spring 2001 we estimate that there were 110,000 people employed in community-based learning and development (Table 2.1). However, in addition to paid workers, voluntary
workers are very important in this sector; the PAULO Skills Foresight report estimates there may be one million people working in an unpaid or voluntary capacity. The sector also has the highest part-time workforce within post-16 education and training, with 44 per cent working part-time.
[image:23.595.43.483.126.366.2]There are relatively fewer professionals, and relatively more associate professionals, in the other adult education sector compared with further and higher education. However, these two groups combined to make up around two-thirds of employment in the sector, comparable with the other two sectors. There are also proportionately more managers and administrators in the other adult education sector. This may be a reflection of smaller establishment size in this sector, and thus a higher ratio of managerial to professional staff within such establishments.
Table 2.3: Employment in work-based learning and training (Employment NTO), Spring 2001, UK
Outside post-16 Total education and training
Number % Number %
Personnel, training and IR managers 109,800 31.0 118,500 30.4 Personnel, training and IR officers 117,800 33.2 121,200 31.1 Vocational and industrial trainers/instructors 96,300 27.1 117,600 30.2 Occupational hygienists and H&S officers 30,800 8.7 32,100 8.2
Total 354,700 100 389,400 100
24
2.4.4 Work-based learning and development
The level of employment in the work-based learning and training sector in Spring 2001 was estimated to be 355,000 (Table 2.1). Because the sector is defined in terms of occupations rather than industrial sectors, all of the employment is in managerial and administrative, and associate professional occupations (Table 2.2).
Table 2.3 shows the breakdown by occupational group for those employed outside of post-16 education and training establishments, and for all workers. The table shows that
personnel, training and industrial relations officers comprise one-third of employment outside the post-16 education and training sector, while there are slightly fewer personnel, training and industrial relations managers (31 per cent). The work-based learning and training sector has the lowest proportion of part-time workers among the post-16 education and training workers, at 14 per cent.
There were 35,000 workers in the work-based learning and training sector employed in post-16 education and training establishments in Spring 2001. Vocational and industrial trainers and instructors are most likely to be employed in the post-16 education and training sector, particularly the ‘other’ adult education sector.
[image:24.595.99.554.409.780.2]Work-based learning and training workers are found across all industrial sectors, although they are most commonly found in the business services sector, and in public administration.
Table 2.4: Employment in post-16 education and training sector by region, Spring 2001, UK
Number % of total employment in
region
North East 40,000 3.65
North West 95,400 3.70
Merseyside 25,300 4.58
Yorks & Humber 82,900 3.57
East Midlands 69,100 3.45
West Midlands 94,100 3.81
Eastern 93,200 3.39
London 158,900 4.61
South East 157,800 3.82
South West 82,700 3.44
Wales 49,500 3.99
Scotland 83,600 3.52
N Ireland 16,000 2.27
Total 1,048,500 3.74
25
2.5 Employment by region
26
3. Employment Trends and Projections
3.1 Introduction and summary
This chapter describes the changing numbers and patterns of demand for workers, both historic and projected, in the post-16 education and training sector. Section 3.2 looks at past trends in the numbers employed in the sector, while the rest of the chapter presents forecasts to 2010 of employment and output (Section 3.3), employment by occupation (Section 3.4), employment needed to replace leavers from the sector (Section 3.5),
and the numbers of highly qualified people in the labour market (Section 3.6). This Chapter draws heavily on projections produced by Cambridge Econometrics and the Institute for Employment Research.
The key points of the chapter are:
q
Employment in the post-16 education and training sector has grown at a faster ratethan overall employment during the last three decades.
q
This faster than average employment growth is projected to continue over the nextdecade. By 2010 the employment level in the sector is expected to have increased by 195,000.
q
Employment growth is expected to be faster in the work-based learning and trainingsub-sector than in the further, higher and other adult education sub-sectors.
q
By occupation, the largest increases in employment are projected for professional andassociate professional occupations, while the numbers of clerical and secretarial workers and elementary staff are projected to decrease.
q
The sector will also need to replace people who leave the sector, in addition torecruiting for expansion. The number of people the sector will need to recruit to replace leavers is likely to be 60 per cent higher than the level of employment growth in the sector, at 325,000. Thus over the next decade the sector will need to recruit 520,000 new workers.
q
As with expansion demand, the largest levels of replacement demand will be forprofessional and associate professional occupations, and over the next decade the sector will need to recruit around 600,000 professional and associate professional workers.
q
Recruitment on this scale represents a significant problem for the sector. Moreemphasis needs to be put on staff retention, clearer career structures and improved reward packages.
q
The number of highly skilled people (degree level or equivalent or higher) in theeconomy is projected to grow by at least 2.3 million to 2010.
q
The increase in the supply of highly skilled people is only four times greater than thehighly skilled recruitment needs of the post-16 education and training sector; therefore the sector is likely to find itself in competition with other sectors for this highly
27
3.2 Historic trends
Employment in the post-16 education and training sector has grown at a faster rate than overall employment in recent years. Employment trends are presented separately for the post-16 education and training establishments (that is, further, higher and other adult education), and for work-based learning and training.
3.2.1 Post-16 education and training establishments (excluding
work-based learning and training)
The recent trends since 1995 in employment in post-16 education and training establishments are shown in Figure 3.1, along with the trends in all education
establishments and total employment in the national workforce. The increase in employment in post-16 education since 1995 is very similar to the outturn for all education
establishments, and employment in education has increased at a faster rate than overall employment. There have been slightly different trends among the post-16 education sectors, with employment in further and higher education rising steadily, and employment in other adult education rising rapidly to 1999, and then falling between 1999 and 2000.
[image:27.595.49.487.450.656.2]Information on longer term historic trends and projections for the education sector are only available for all education establishments, including pre-16 education establishments as well as post-16 education and training. However, as the recent trends in employment in post-16 education and training establishments have been very similar to the overall trend in the employment sector, we can be moderately confident that historic trends and projections in all education establishments will provide a reasonable indication of trends in post-16 education and training.
Figure 3.1: Employment trends for post-16 education and training establishments, 1995-2000, GB
Source: ABI/IES
Figure 3.2 shows that employment in post-16 education and training has grown at a much faster rate than overall employment during the last three decades, although the post-16 education and training sector has been subject to the changing cyclical fortunes of the economy as a whole. Thus the rapid growth occurred in two periods, during the early 1970s, and during the mid to late 1980s, while employment fell during the early 1980s and the early 1990s.
90 95 100 105 110 115 120 125 130 135 140
1995 1996 1997 1998 1999 2000
1995 = 100
28
[image:28.595.117.544.174.370.2]Employment in the sector in 1999 was nearly 50 per cent higher than the level in 1971, while for overall employment the increase over this period was 12 per cent.
Figure 3.2: Employment trends for post-16 education and training establishments, 1971-1999, UK
Note: based on trends in all education establishments, and assumes post-16 education and training sector has performed in line with overall education employment trend
Source: CE/IER
3.2.2 Work-based learning and training sector
Employment trend information for the work-based learning and training sub-sector is not available on the same basis as for the remainder of the post-16 education and training sector. However, the Employment NTO Skills Foresight report presents information on employment in their sector for 1991, from the 1991 Population Census, and also trends since the previous Census in 1981. Employment stood at 185,000 in 1991, up from 133,000 in 1981. This represents an increase of 38 per cent over this period.
Employment growth in the work-based learning and training sector has increased over the last decade. The LFS suggests that total employment in the sector (that is, including those people employed in post-16 education and training establishments) was 389,000 in 2001. This represents an increase of 110 per cent from the 1991 level, an annual increase of eight per cent per year over the last ten years.
3.3 Future projections
Employment in the post-16 education and training sector is projected to continue growing, and at a faster rate than overall employment.
Projections are presented separately for the post-16 education and training establishments (that is, further, higher and other adult education), and for work-based learning and training.
Total employment in the post-16 education and training sector is projected to increase by 195,000 by 2010, an increase of 19 per cent. Employment growth is expected to be greater in work-based learning and training than in post-16 education and training establishments, at 33 per cent compared to 11 per cent.
90 100 110 120 130 140 150
1971 = 100
19721973
1971 19741975197619771978197919801981198219831984198519861987198819891990199119921993199419951996199719981999
29
3.3.1 Post-16 education and training establishments (excluding
work-based learning and training)
Employment
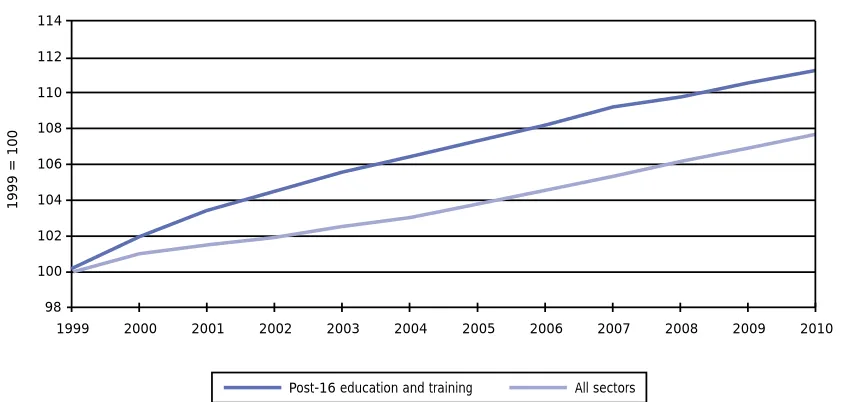
[image:29.595.49.474.284.485.2]Employment in post-16 education and training establishments is projected to grow by 11.2 per cent between 1999 and 2010, or around 1.0 per cent per year. This compares with growth in total employment of 7.6 per cent, or 0.7 per cent per year, over the same period (Figure 3.3).
Thus the employment level in post-16 education and training establishments is projected to increase from 694,000 in 1999 to 772,000 in 2010, an increase of 78,000.
Figure 3.3: Employment projections for post-16 education and training establishments, 1999-2010, UK
Note: based on trends in all education establishments, and assumes post-16 education and training sector will perform in line with overall education employment projections
Source: CE/IER
Output
Output for education and training is less tangible than for other sectors. Nevertheless, the entire education and training sector (including pre-16 education) had, in 1999, an output of £36 billion, representing 5.2 per cent of total UK GDP. Over the past three decades output in post-16 education and training establishments has grown at a fairly steady rate, and has been relatively immune to cyclical changes in the economy, that is remaining stable or declining only slightly during times of recession, and growing steadily but at a slower rate than the economy as a whole during boom times.
Figure 3.4 shows projected output in the economy as a whole, and in post-16 education and training establishments, between 1999 and 2010. The education and training sector is projected to perform in line with the economy as a whole, with only small deviations from the national trend. Overall output growth is expected to be around 2.5 per cent per year.
98 100 102 104 106 108 110 112 114
1999 2000 2001 2002 2003 2004 2005 2006 2007 2008 2009 2010
1999 = 100
30
Productivity
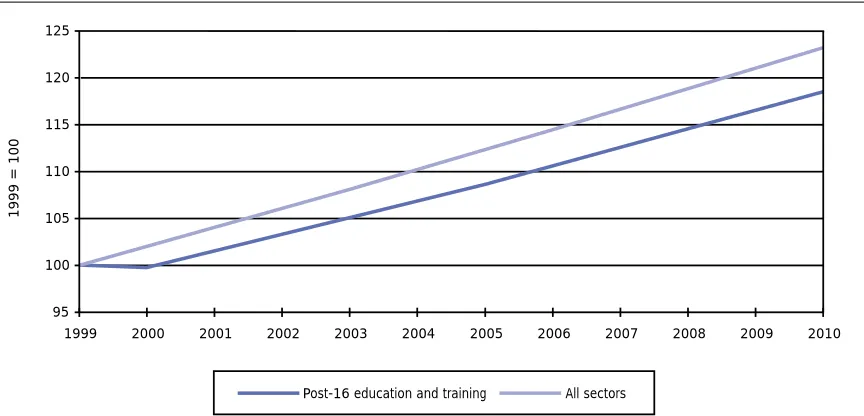
Productivity however, is projected to grow more slowly in the education and training sector. Figure 3.5 shows projections in productivity for post-16 education and training establishments, and for all workers, between 1999 and 2010. After a slight fall in productivity after 1999, average growth in productivity in education and training is projected to be slightly less than the 1.9 per cent per year across all sectors. The stronger than average employment growth is the factor behind the slower than average productivity growth for the education sector.
[image:30.595.120.546.295.492.2]Average productivity per worker in education and training (including pre-16 education) stood at £17,569 in 1999, compared with the figure for all sectors of £24,779, and by 2010 productivity in education is expected to rise to £20,800 compared to £30,478 for all sectors.
Figure 3.4: Output projections for post-16 education and training establishments, 1999 - 2010, UK
Note: based on trends in all education establishments, and assumes post-16 education and training sector will perform in line with overall education output projections
Source: CE/IER
3.3.2 Work-based learning and training sector
Occupational employment projections are produced at a three-digit SOC (Standard Occupational Classification) level. However, this is at one level above the occupational definitions of the work-based learning and training sector. Therefore for the purposes of this forecasting exercise we have assumed that employment in the categories of the definition of the sector will grow at the same rate as the wider occupational group they are in.
Table 3.1 shows the projected employment changes in the relevant occupational groups, and the projected employment figures for the four occupational groups that comprise work-based learning and training in 2010. Employment among the associate professional occupations is expected to grow faster than among the personnel, industrial relations and training managers. Overall employment in the work-based learning and training sector is projected to grow by 33 per cent, or 118,000 by 2010.
95 100 105 110 115 120 125 130 135
1999 2000 2001 2002 2003 2004 2005 2006 2007 2008 2009 2010
1999 = 100
31
Figure 3.5: Productivity projections for post-16 education and training establishments, 1999 - 2010, UK
Note: based on trends in all education establishments, and assumes post-16 education and training sector will perform in line with overall education productivity projections
Source: CE/IER
Table 3.1: Employment projections for work-based learning and training, 1999 - 2010, UK
1999 2010 Change % change
SOC 113 Functional managers 999,300 1,287,200 287,900 28.8
Personnel, training and IR managers 109,800 141,400 31,600 28.8
SOC 356 Public service and other
associate professions 404,400 546,800 142,400 35.2
Personnel, training and IR officers 117,800 159,300 41,500 35.2
Vocational and industrial
trainers/instructors 96,300 130,200 33,900 35.2
Occupational hygienists and
H&S officers 30,800 41,600 10,800 35.2
Total Employment NTO 354,700 472,600 117,900 33.2
Source: CE/IER, and IES calculations in italics
1999 = 100
95 100 105 110 115 120 125
1999 2000 2001 2002 2003 2004 2005 2006 2007 2008 2009 2010
[image:31.595.55.482.436.661.2]32
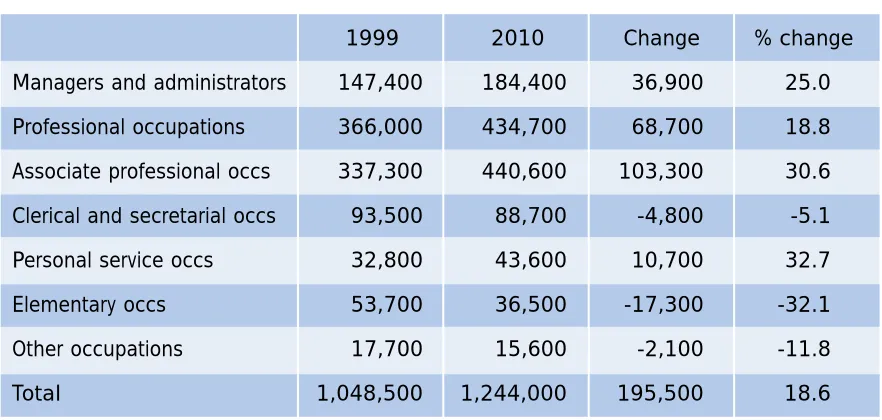
3.4 Changing occupational balance
Having looked at overall employment projections for the post-16 education and training sector, we now go on to look at prospects among the different occupational groups in the sector.
Table 3.2 shows the changing occupational patterns in the post-16 education and training sector to 2010. The major growth areas are among high level non-manual occupations, managerial, professional, and associate professional workers. These have been the areas of rapid growth between 1981 and 1999.
The number of associate professionals is expected to increase by 103,000, so that by 2010 associate professionals outnumber professional workers in the sector. There are large
projected decreases in employment among clerical and secretarial and elementary
[image:32.595.113.554.340.550.2]occupations, continuing the declining trend in these occupations in the post-16 education and training sector.
Table 3.2: Changing occupational employment in post-16 education and training sector, 1999 - 2010, UK
1999 2010 Change % change
Managers and administrators 147,400 184,400 36,900 25.0
Professional occupations 366,000 434,700 68,700 18.8
Associate professional occs 337,300 440,600 103,300 30.6
Clerical and secretarial occs 93,500 88,700 -4,800 -5.1
Personal service occs 32,800 43,600 10,700 32.7
Elementary occs 53,700 36,500 -17,300 -32.1
Other occupations 17,700 15,600 -2,100 -11.8
Total 1,048,500 1,244,000 195,500 18.6
Source: IES calculations from CE/IER and LFS data
3.5 Replacement demand
While growing employment in the post-16 education and training sector will create an additional demand for workers, there will also be a need to replace workers who leave the sector through job changes, retirement or death. The combination of expansion demand and replacement demand provides an indication of the net demand requirement the sector will face, both overall and among the different occupations, taking into account worker turnover and estimates of people moving between occupations.
33
Table 3.3: Net replacement demand analysis for post-16 education and training, 1999 - 2010, UK
Number %
Base year employment 1,048,500 100.0
Expansion demand 195,500 18.6
R