Load-deformation characteristics of minefills with particular reference to arching and stress developments
264
0
0
Full text
(2) LOAD-DEFORMATION CHARACTERISTICS OF MINEFILLS WITH PARTICULAR REFERENCE TO ARCHING AND STRESS DEVELOPMENTS. A Thesis Submitted by. Kandiah PIRAPAKARAN BEng(Hons) in February 2008. for the degree of Doctor of Philosophy. in the School of Engineering James Cook University.
(3) STATEMENT OF ACCESS. I, the undersigned author of this work, understand that James Cook University will make this thesis available for use within the University Library and, via the Australian Digital Theses network, for use elsewhere. I understand that, as an unpublished work, a thesis has significant protection under the Copyright Act and;. I do not wish to place any further restriction on access to this work. _____________________________________ Signature. ______________ Date.
(4) STATEMENT OF SOURCES. DECLARATION. I declare that this thesis is my own work and has not been submitted in any form for another degree or diploma at any university or other institution of tertiary education. Information derived from the published or unpublished work of others has been acknowledged in the text and a list of references is given.. ……………………... …………………... Signature. Date. DECLARATION-ELECTRONIC COPY. I, the undersigned, the author of this work, declare that to the best of my knowledge, the electronic copy of this thesis submitted to the library at James Cook University is an accurate copy of the printed thesis submitted.. …………………….. …………………. Signature. Date. iii.
(5) ACKNOWLEDGEMENTS. I would like to express my deepest gratitude to my research supervisor Associate Prof. Nagaratnam Sivakugan for his guidance and constant support in helping me to conduct and complete this work successfully. Further, I want to thank my associate supervisors Dr. W. Karunasena and R. Rankine for supporting me to complete my PhD work as well as their generous advice. I want to thank my fellow graduate student Shailesh Sign in the Civil and Environmental Engineering for their help in this research. Many thanks to all the people I have come to know at the James Cook University. I especially want to thank Professor. K.G.H.N. Seneviratne, Department of Civil Engineering, University of Peradeniya, Srilanka, for his inspiration and encouragement for my higher studies. Finally, I want to extend my profound appreciation to my wife Birunthagini and beloved parents for their love, affection, and invaluable support during my life and studies.. iv.
(6) Abstract Mining is one of the major export industries in Australia. When the ore is removed from the ground voids are backfilled. There are different types of backfills depending on their nature and usage. Hydraulic and paste fill are most common backfills in industry. The strength and drainage properties of hydraulic fills are required for better design and safety of the mines and miners. Arching is a well known phenomenon identified in geotechnical and mining applications as reduction in the vertical stresses compared to overburden pressure at any depth within the fill. Paste fill is a popular and relatively new minefill that is used for backfilling underground voids created in the process of mining. The binder used in paste fill, typically at dosage of 3% - 5%, contributes significantly to the cost of backfilling. While Ordinary Portland cement (OPC) has been the typical binder in paste fills, there is an increasing trend to replace OPC with blended cements that include OPC mixed with fly ash, slag and lime at different proportions in an attempt to minimize the cost.. This research presents a study that utilizes a laboratory model and the two and threedimensional finite difference packages FLAC and FLAC3D to investigate the arching effects including the consideration of interface elements between rock and backfill, stope geometry and shear strength parameters. An arching effect instrument was developed and was used to investigate the stress developments within circular and square stopes, which were found similar to the results of numerical modeling. Stress values in the circular stopes were approximately 85% of square stopes from the experimental model.. Further, an analytical solution was developed from Marston’s solutions for investigating stress developments within rectangular, square/circular and narrow stopes. The research was extended to develop models for narrow and rectangular stopes using FLAC and FLAC3D, respectively. The improved model of narrow stopes was verified against Aubertin et al. (2003) and extended further by incorporating interface elements between rock and backfill. FLAC axi-symmetric model for circular stopes was compared with Rankine (2004) FLAC3D model. Finally, the findings for narrow stopes were verified with Knutsson’s (1981) in situ measurements.. Blended cements are generally characterised by very slow early strength development, followed by the attainment of good ultimate strength. Blends comprising of 100% OPC, v.
(7) 75% OPC & 25% fly-ash and 30% OPC & 70% slag were tested, adding 3%, 3.5% and 4% binder to tailings having solids contents of 7%, 80% and 81%. The specimens were subjected to uniaxial compressive strength after curing periods of 7, 14, 28, 56 and 90 days. The short-term flow characteristics of 3.5% paste fill mixes with each type of binder were investigated using yield stress tests. The results provided an understanding of the effect of solids contents, binder contents and curing period in the selection of optimal paste fill mixture. It was observed that slag-based paste fill had higher strength compared to the other two paste fills, however after considering the cost of binders, the 3% slag-based binder with 79% solids content in the paste fill and 3.5% Flyash-based binder with 80% solids content in the paste fill were chosen as optimal mixtures for strength and flow properties. Also, long term strength was investigated on Cannington mine tailings using Portland cement, but only for 79% and 83% solids content in the paste fill.. vi.
(8) List of Publications JOURNALS “Optimization of Paste fills using Blended cements with Cannington tailings mines” Pirapakaran, K. and Sivakugan, N. (2008). Canadian Geotechnical Journal (under review). “A Laboratory Model to Study Arching within a Hydraulic Fill Stope” Pirapakaran, K. and Sivakugan, N. (2007). Geotechnical Testing Journal, ASTM, 30 (6), 200-210. “Arching within Hydraulic fill stopes” Pirapakaran, K. and Sivakugan, N. (2007). Journal of Geotechnical and Geological engineering, Springer, 25(1), 25-35.. CONFERENCES “Numerical and experimental studies of arching effects within mine fill stopes” Pirapakaran, K. and Sivakugan, N. (2006). Proceedings of the International Conference on Physical Modeling in Geotechnics (ICPMG), Hong Kong, 555-563. “Geotechnical Characteristics of Australian Mine Fills” Pirapakaran, K, Singh, S., and Sivakugan, N (2006). Proceedings of the Northern Engineering conference, Mackay, Australia. “Investigations into strength of Cannington paste fill mixed with blended cements” Pirapakaran, K. and Sivakugan, N. (2007) Proceedings of the 10th ANZ conference, Australian Geomechanics society, Brisbane, Australia, 144-149. “Hydraulic Fill Research at James Cook University in the new Millennium” Pirapakaran, K., Singh, S., and Sivakugan, N. (2007) Proceedings of the 9th International Symposium on Mining with Backfill, Montreal, Quebec, Canada (CD Rom).. vii.
(9) Contents Statement of Access. ii. Statement of Sources. iii. Acknowledgements. iv. Abstract. v. List of Publications. vii. Table of Contents. viii. List of Figures. xiv. List of Tables. xxi. List of Symbols. xxiii. 1. Introduction. 1. 1.1 General. 1. 1.2 Problem statement. 3. 1.3 Scope of Research. 4. 1.4 Relevance of the Research. 4. 1.5 Thesis Overview. 5. 2. Literature review. 7. 2.1 General. 7. 2.2 A review of mining methods. 8. 2.2.1 Surface mining. 9. 2.2.2 Underground mining. 9. 2.3 A summary of backfill materials. 12. 2.3.1 Hydraulic fills (HF). 12. 2.3.2 Paste fills (PF). 13. 2.4 Concept of arching. 16. 3. Analytical Models and In situ Measurements on Arching Effects. 18. 3.1 General. 18. 3.2 Necessity for Arching Consideration in Backfills. 19. 3.3 Arching in Geotechnical and Mining Applications – Analytical solutions. 21. 3.3.1 Vertical stope. 21. Marston’s theory. 22. Terzaghi’s theory. 22 viii.
(10) Limit equilibrium Wedge. 23. Winch analytical model. 24. Free standing vertical face. 26. Modified Marston’s theory. 27. Extended 3-dimensional Marston theory. 28. Extended solution from Marston theory by the Author. 30. Comparison of analytical solutions. 33. 2-dimensional solutions. 33. 3-dimensional solutions. 35. 3.3.2 Inclined stope. 38. Caceres modified analytical approximation. 39. 3.4 Arching in Geotechnical and Mining Applications – In situ measurements 41 3.5 Summary and conclusions. 45. 4. Experimental Models on Arching Effects. 46. 4.1 General. 46. 4.2 Laboratory tests for friction angles. 47. 4.2.1 Determination of friction angle of hydraulic fills. 47. Direct shear tests. 47. Grain size distribution and grain shape of hydraulic fills. 50. 4.2.2 Determination of interfacial friction angles. 58. Modified direct shear tests. 60. Effect of wall roughness and packing density. 61. 4.3 Arching in geotechnical and Mining Applications - Physical models. 71. 4.4 A laboratory model to study arching within a hydraulic fill stope. 74. 4.4.1 Parametric study of critical stope parameters. 74. Stope geometry. 74. Wall roughness. 75. Filling materials. 75. 4.4.2 Instrument. 76. 4.4.3 Methodology and interpretation. 80. 4.4.4 Proposed models. 81. When completely filled. 82. During filling. 82. 4.4.5 Effect of stope geometry. 82. 4.4.6 Scaling. 88. 4.4.7 Effect of wall roughness. 89 ix.
(11) 4.4.8 Effect of hydraulic fill type. 91. 4.5 Summary and conclusions. 93. 5. Numerical Modelling on Arching In Mine Fill Stopes 5.1 General. 95 95. 5.2 Arching in geotechnical and mining applications – Numerical models 5.3 Proposed FLAC and FLAC. 3D. models. 5.4 Modelling approach. 96 98 101. 5.4.1 Sensitivity analysis. 103. 5.4.2 Boundary conditions. 107. 5.4.3 Initial conditions. 110. 5.4.4 Interfaces. 110. 5.4.5 Constitutive models. 110. 5.5 Modification of a narrow stope FLAC model. 112. 5.6 Interface FLAC model for vertical stopes. 115. 5.6.1 Interface definition. 115. Interfacial properties. 116. 5.6.2 Extended narrow stope FLAC model 5.7 Development an axi-symmetric FLAC model 5.7.1 Comparison of the axi-symmetric FLAC model. 124 127 130. 5.8 3-dimenaional models for general stopes. 134. 5.9 Comparison and verification of arching models. 137. 5.10 Sensitivity analysis. 141. 5.10.1 Sensitivity analysis of stope geometry. 142. Stope geometry in shape. 144. Stope aspect ratio. 144. Narrow stopes. 144. Square stopes. 150. 5.10.2 Effect of shear strength parameters. 153. Internal friction angle. 154. Cohesion. 155. 5.10.3 Effect of type of minefill. 156. 5.10.4 Effect of interfacial properties. 158. 5.11 Summary and conclusions. 161. x.
(12) 6. A Paste Fill Optimization Model. 164. 6.1 General. 164. 6.2 Current state-of-the-art on strength of paste fills. 166. 6.2.1 Paste fills using ordinary Portland and blended cements. 168. Paste fills with ordinary Portland cement. 167. Paste fills with blended cements. 169. 6.2.2 Short-term flow characteristics models. 171. 6.2.3 Cost considerations. 175. 6.3 Details of Experimental Studies Undertaken. 177. 6.3.1 Mine tailings. 177. 6.3.2 Binders. 180. Ordinary Portland cement (OPC). 181. Blended cements. 181. Blast furnace Slag. 182. Fly ash. 184. 6.4 Laboratory Testing Programme. 184. 6.4.1 A model using blended cements for Tailings I Yield stress of blended paste fills. 185 185. Methodology and experimental setup. 187. Results and discussion. 188. Strength and stiffness of blended paste fill. 191. Methodology and experimental setup. 191. Results and discussion. 194. Cost analysis. 207. 6.4.2 Long term paste fill strength analysis on Tailings I 6.5 Summary and conclusions. 210 215. 7. Summary, Conclusion and Recommendations. 217. 7.1 Summary. 217. 7.2 Conclusion. 219. 7.2.1 Physical arching model. 219. 7.2.2 Analytical arching model. 220. 7.2.3 Numerical arching models. 221. 7.2.4 Paste fill models. 222. 7.3 Recommendations for Future Research. 223. 7.3.1 Arching models. 223. 7.3.2 Paste fill model with blended cements. 224. xi.
(13) REFERENCES. 225. APPENDICES APPENDIX A. 237. Figure A1.1. Shear stress versus horizontal displacement curves for fill-fill and fill-sand paper attached interface shear tests on a horizontal plane for A1 with 75% of relative density. 238. Figure A1.2. Interface shear test curves for normal loads of 150 N and 325 N using high surface roughness for A1 with different relative densities. 239. Figure A1.3. Interface shear test curves for normal loads of 150 N and 325 N using medium surface roughness for A1 with different relative densities. 240. Figure A1.4. Interface shear test curves for normal loads of 150 N and 325 N using low surface roughness for A1 with different relative densities. 241. Figure A1.5. Shear stress versus horizontal displacement curves for fill-fill and fill-sand paper attached interface shear tests on a horizontal plane for D2 with 75% of relative density. 242. Figure A1.6. Interface shear test curves for normal loads of 150 N and 325 N using high surface roughness for D2 with different relative densities. 243. Figure A1.7. Interface shear test curves for normal loads of 150 N and 325 N using medium surface roughness for D2 with different relative densities. 244. Figure A1.8. Interface shear test curves for normal loads of 150 N and 325 N using low surface roughness for D2 with different relative densities. 245. Figure A2.1. Variation of Load with Meter Reading (Load Cell) for the 246. tension calibration Table A2.1. Test data, vertical stresses and additional vertical stresses within the model stope for sample A1. 247. Table A2.2. Test data, vertical stresses and additional vertical stresses within the model stope for sample D2. 248. Figure A2.2. Variation of vertical stress at the bottom of the stope while filling with A1. 249. Figure A2.3. Variation of vertical stress at the bottom of the stope while filling withD2. 249. Figure A2.4. σv/γw vs. z/w for experimental results and empirical correlations for circular and square stopes filled with A1. 250. Figure A2.5. σv/γw vs. z/w for experimental results and empirical correlations for circular and square stopes filled with D2. xii. 250.
(14) Figure A2.6. Variation of vertical normal stress against model height for square stope filled with A1 at different surface roughness. 251. Figure A2.7. Variation of vertical normal stress against model height for the circular stope filled with A1 at different surface roughness. 251. Figure A2.8. Variation of vertical normal stress against model height for square stopes filled with D2 at different surface roughness. 252. Figure A2.9. Variation of vertical normal stress against model height for circular stope filled with D2 at different surface roughness. 252. Figure A2.10. σv/γw vs. z/w for experimental results and empirical correlations with medium and high surface roughnesses (A1). 253. Figure A2.11. σv/γw vs. z/w for experimental results and empirical Correlations with medium and high surface roughnesses (D2). APPENDIX B. 253. 254. Figure B1.1. a) Variation of σv/γh vs. h/w b) lateral variation at 1/3 depth; c) half depth; d) 3/4 depth; and e) full depth (15 m width stope). 255. Figure B1.2. a) Variation of σv/γh vs. h/w b) lateral variation at 1/3 depth; c) half depth; d) 3/4 depth; and e) full depth (20 m width stope). 256. Figure B1.3. a) Variation of σv/γh vs. h/w b) lateral variation at 1/3 depth c;) half depth; d) 3/4 depth; and e) full depth (30 m width stope). 257. Program B2.1. FISH code program used to investigate the stress development within narrow stopes. 258. Program B2.2. FISH code program with interface elements used to investigate the stress development within circular stopes. APPENDIX C. 260. 270. Table C.1. Parametric Study Data – 7 Days curing time for 80% solids content in the paste fill. 271. Table C.2. Parametric Study Data – 14 Days curing time for 80% solids content in the paste fill. 272. Table C.3. Parametric Study Data – 56 Days curing time for 80% solids content in the paste fill. 273. Table C.4. Parametric Study Data – 90 Days curing time for 80% solids content in the paste fill. 274. xiii.
(15) ______________________________________________________________________. List of Figures Figure. Details. Page. 1.1. Underground mining at Osborne mine. 2. 2.1. Schematic diagram of surface and underground mining. 8. 2.2. Surface mining operation at Western Kentucky Coal mine. 9. 2.3. Underground mining methods (Brady and Brown, 1993). 10. 2.4. Schematic diagram of Open stoping mining (Hans, 2001). 10. 2.5. Schematic diagram of Cut and Fill mining (Hans, 2001). 11. 2.6. Location of Australian Paste fill systems (Rankine, 2004). 14. 2.7. Major components of paste backfills (Adapted from Belem and Benzaazoua, 2008). 14. 3.1. Schematic diagram of arching within mine stopes. 19. 3.2. Vertical normal stress in a continuous strata (a) cross section of strata (b) vertical stress profile. 20. 3.3. Comparison of arching and non-arching vertical stress profiles. 20. 3.4. Confined block mechanism (Mitchell et al., 1982). 23. 3.5. Winch 3-dimensional model (a) backfilled stope (b) differential element in equilibrium (Adapted from Winch, 1999). 25. 3.6. Design of backfill as a freestanding wall (Grice, 2001). 26. 3.7. (a) Schematic diagram of a 2-dimensional stope and (b) the free body diagram with forces (Aubertin et al., 2003). 27. 3.8. Free body diagram of an element (Li et al., 2005). 28. 3.9. (a) Schematic diagram of a 3-dimensional stope and (b) the free body diagram with forces. 3.10. 31. Variation of vertical normal stress vs. stope depth with different 34. analytical solutions 3.11. Percentage of vertical normal stress transformation vs. stope depth with different analytical solutions. 3.12. 36. Vertical normal stress vs. stope depth for different stope aspect ratios 37. using 3-dimensional solutions 3.13. Schematic diagram of an inclined stope at mine sites (Martin et al., 1999) 38. 3.14. Earth pressure coefficient vs. internal friction angle of backfills. xiv. 41.
(16) ______________________________________________________________________ 3.15. In situ stress measurements and the overburden pressure of backfill at stopes 2FA7 (a) horizontal stress and (b) vertical stress (Adapted from Knutsson, 1981). 3.16. 43. Maximum in situ vertical stress in cemented paste fill versus elevation from the base (Roux et al., 2005). 4.1. 44. Schematic diagram of the direct shear test apparatus (Sivakugan, 2008). 48. 4.2. Direct shear apparatus at James Cook University. 49. 4.3. Grain size distribution for 12 hydraulic fills from three Australian mines. 51. 4.4. Scanning electron microscope at AAC, JCU. 52. 4.5. SEM images of hydraulic fills A1, C3 and D2. 53. 4.6. Correlation between standard penetration resistance and the friction angle (adapted from Peck et al., 1973). 4.7. Friction angle (φ) vs. relative densities of hydraulic fills A1, C3, D2, Skempton (1986), Kulhawy and Manyne (1990) and Meyerhof (1957). 4.8. 56. 57. Influence of relative density on friction and interfacial friction angle (Adapted from Acar et al., 1982). 59. 4.9. (a) Coarse sand paper-CS (b) Fine sand paper-FS. 61. 4.10. Shear stress versus horizontal displacement curves for fill-fill and fill-interfaces shear tests using C3 fill of 45% relative density. 4.11. 62. Shear stress vs. horizontal displacement curves for fill C3-high surface roughness interface shear testing with normal loads of 150 N and 325 N 64. 4.12. Shear stress vs. horizontal displacement curves for fill C3-medium surface roughness interface shear testing with normal loads of 150 N and 325 N. 4.13. 65. Shear stress vs. horizontal displacement curves for fill C3-low surface roughness interface shear testing with normal loads of 150 N and 325 N 66. 4.14. Influence of different surfaces roughness against hydraulic fill samples on interfacial friction angles. 4.15. Variation of dilation angle vs. relative density in the case of high surface roughness using hydraulic fills A1, C3 and D2. 4.16. 69. 71. (a) Schematic diagram of cohesionless sand in trapdoor rig and (b) the pressure distribution. 72. 4.17. Stope geometries with dimensions. 75. 4.18. Scaled diagram of the apparatus. 77. 4.19. Photograph of the Arching apparatus. 78. 4.20. Mechanism of the arching apparatus. 79. xv.
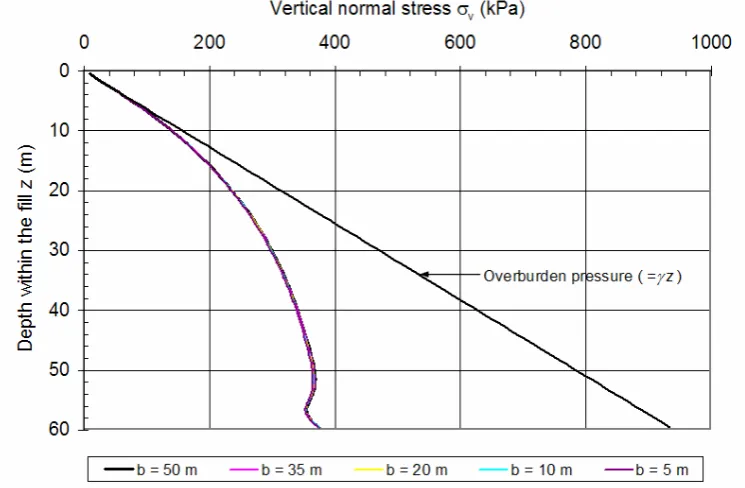
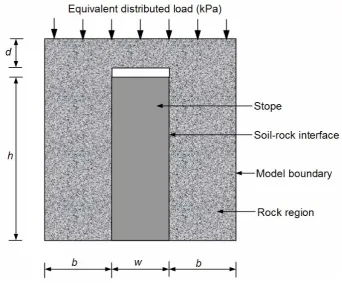
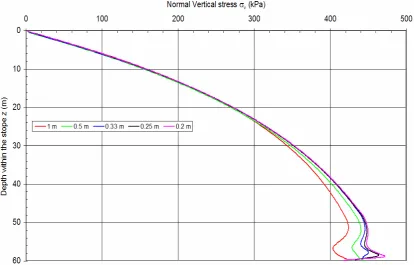
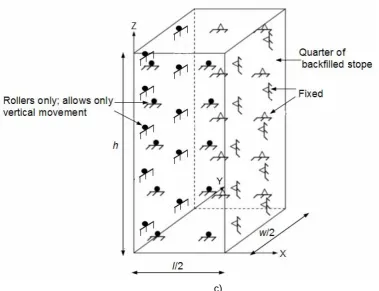
(17) ______________________________________________________________________ 4.21. Photograph of the pouring device. 79. 4.22. Filling as equal layers into (a) square and (b) circular sections during the tests. 81. 4.23. Schematic diagram of weight transfer at the bottom the stope and wall. 82. 4.24. Variation of vertical stress at the bottom of the stope while filling (Sample C3). 4.25. 83. Additional vertical stress at the bottom of the stope due to complete filling (Sample C3). 4.26. 85. σv/γw vs. h/w from experimental results and empirical correlations for circular and square sections (sample C3). 4.27. σv/γw vs. h/w from experimental results and empirical correlations with medium and high surface roughness for C3. 4.28. 89. Variation of vertical normal stress against model height for square stopes. 4.30. 90. Variation of vertical normal stress against model height for circular stopes. 4.31. 90. Vertical normal stress vs. stope height within a circular stope with 100 mm diameter. 4.32. 92. Vertical normal stress vs. stope height within a square stope of 100 mm x 100 mm x 600 mm. 5.1. 87. Variation of z/h versus σv/γh for different stopes sizes and sections with aspect ratio of 6. 4.29. 86. 92. Stresses in cemented rock fill using FLAC3D showing vertical normal stresses along vertical centerline (solid line) and shear stresses at wall (dotted line) (Coulthard, 1999). 97. 5.2. Vertical stopes in underground mines. 100. 5.3. Idealized long narrow stope representation after ore extraction Before backfilling (adapted from www.mininglife.com). 5.4. 101. Idealized long narrow stope representation after backfilling (adapted from www.mininglife.com). 102. 5.5. Schematic diagram of idealized regions with various dimensions. 102. 5.6. Variation of vertical normal stress against stope depth for b=5, 10, 20, 35 and 50 m within 10 m x 60 m narrow stope. 103. 5.7. Approximation of equivalent distributed load to rock region. 105. 5.8. Vertical normal stress vs. stope depth at different grid sizes. 106. 5.9. Idealistic nine-stope grid arrangement (Rankine 2004). 107. xvi.
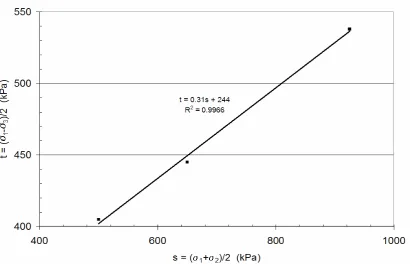
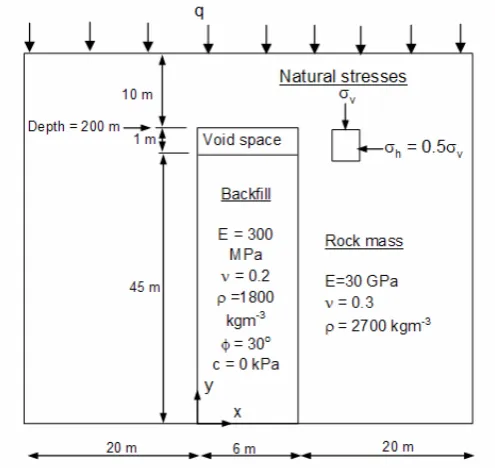
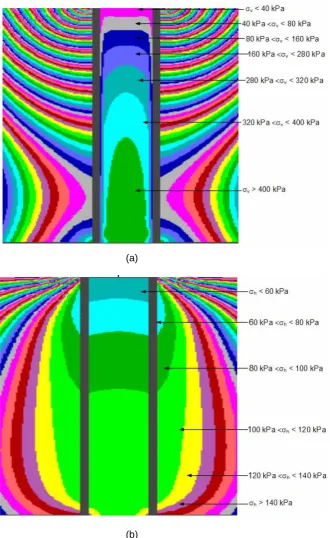
(18) ______________________________________________________________________. 5.10. Schematic diagram of boundary conditions applied (a) two-dimensional plane strain, (b) axi-symmetric models and (c) three-dimensional model. 109. 5.11. Mohr Coulomb failure criterion. 110. 5.12. s-t plot for 6% cement, 78% solids of paste fill sample (56 day UU strength, adapted from Rankine, 2004). 5.13. Vertical stope with backfill (not to scale); the main properties of the rock and backfill are given with geotechnical notations. 5.14. 114. Comparison of vertical normal stresses (σv) along the narrow stope center line by varying filling thickness. 5.16. 113. Normal Stress distribution contours within backfill and surroundings from FLAC (a) Vertical stresses (σv) (b) Horizontal stresses (σh). 5.15. 111. 115. Schematic diagram of the FLAC interface element (adapted from Itasca, 2000). 117. 5.17. Location of interface elements in numerical modelling. 117. 5.18. Zone dimension used in stiffness calculation (Adapted from Itasca, 2000) 119. 5.19. Vertical normal stress along the stope centre line vs. stope depth for different normal and shear interface stiffnesses. 5.20. Shear stress along the left wall vs. stope depth for different normal and shear interface stiffnesses. 5.21. 125. Comparison of vertical normal stress from analytical, numerical solutions and overburden pressure along the vertical stope centre line. 5.24. 122. Vertical normal stress vs. depth within the narrow stope for with and without interface elements. 5.23. 121. Vertical displacement at centre line vs. stope depth for different normal and shear interface stiffnesses. 5.22. 120. 126. Variation of normal vertical stresses across the narrow stope width at four different levels of stope depths with corresponding overburden pressures 127. 5.25. Variation of vertical normal stress with depth from axi-symmetric model and overburden against centre line of the circular stope. 5.26. Comparison of vertical normal stresses (σv) from analytical, Numerical solutions and overburden stress along the circular stope centre line. 5.27. 128. 129. Variation of vertical stresses across the circular stope width at different level of stope heights with corresponding overburden pressures 129. 5.28. Comparison of an axi-symmetric model (FLAC) with Rankine (2004) FLAC3D model. 131. xvii.
(19) ______________________________________________________________________. 5.29. Comparison of normal vertical stress profiles for the 200 m high stope at 40 m above the stope base and at the base. 5.30. Vertical normal stress vs. stope depth for three-dimensional models using FLAC3D. 5.31. 135. Vertical normal stress vs. stope depth for three-dimensional models using analytical solutions. 5.32. 132. 136. (a) Comparison of vertical stresses within 100 mm and 600 mm stope filled with hydraulic fill C3 from experimental, analytical and numerical methods and (b) enlarged version. 5.33. 138. Verification of (a) vertical normal stress against depth and (b) horizontal stress against depth within 6 m x 45 m narrow stope narrow stope. 5.34. Comparison of vertical stress along the stope center for narrow, circular and square stopes. 5.35. 143. Vertical stress profiles of (a) 10 m x 60 m narrow stope and (b) 10 m x 10 m x 60 m square stope. 5.36. 144. Variation of vertical normal stress against depth in a narrow stope for different aspect ratios. 5.37. 145. Stress contour profiles of different narrow stope sections using FLAC. 5.38. 140. 148. a) Variation of σv/γh vs. h/w b) lateral variation at quarter depth; c) half depth d) three-quarter depth and e) full depth for aspect ratio of 6 149. 5.39. Variation of vertical normal stress vs. depth within the square stope for different stope aspect ratios. 5.40. 151. Stress contour profiles of square stopes of different aspect ratios using FLAC3D. 152. 5.41. Plot of σv,max/γh against height to width (h/w) aspect ratios. 153. 5.42. Effect of friction angle of backfills on vertical stress within the circular, square and narrow stopes. 5.43. 154. Effect of fill cohesion (> 100kPa) on vertical stress within circular, square and narrow stopes. 5.44. 155. Effect of fill cohesion on vertical stress within circular, square and narrow stopes. 5.45. 156. Vertical stress variation along the centre of circular stopes by varying fill densities when cohesion = 0 kPa and friction angle = 35o. xviii. 157.
(20) ______________________________________________________________________ 5.46. Vertical stress variation along the centre of circular stopes by varying fill densities when cohesion = 100 kPa and friction angle = 35o. 5.47. 158. Variation of vertical normal stress vs. stope depth when. δ = 20o, 25o and 30o (ψ = 5o). 5.48. 159. Variation of vertical normal stress vs. stope depth when ψ = 0o, 5o and 10o (δ = 25o) within the circular stope for C3. 5.49. 160. Variation of vertical normal stress vs. stope depth when δ = 20 , 25 o. o. and 30o (ψ = 10o) within the narrow stope for C3 5.50. Variation of vertical normal stress vs. stope depth when ψ = 0o, 5o and 10o (δ = 25o) within the narrow stope for C3. 6.1. 161. Typical graduation curves for hydraulic, cemented hydraulic and paste fill tailings. 6.2. 160. 165. 28-day UCS vs. cement content for paste fills and cemented hydraulic fills of different solid densities and grain grades (Landriault, 1995). 168. 6.3. Effect of cement addition on yield stress of paste fills (Smith, 2002). 174. 6.4. Yield stress versus solids contents of zinc tailings obtained by three methods (Gawu and Fourie, 2004). 175. 6.5. Grain size distribution curves for Cannington tailings. 179. 6.6. SEM images for Cannington tailings. 180. 6.7. Binder utilized (Dirige and Souza, 2002). 181. 6.8. Comparison of grain size distribution of Types A, B and C binders and Cannington tailings. 183. 6.9. Usage of slag through out the years in the USA. 184. 6.10. Yield stress apparatus (HBV). 186. 6.11. Yield stress versus percent solids for mixture of Cannington tailings with. B. 3.5% binders. 190. 6.12. Sample mixer at JCU. 191. 6.13. Samples ready for the UCS test. 192. 6.14. Instron machine at the structural laboratory, JCU.. 193. 6.15. Arrangement of sample into the Instron machine. 193. 6.16. UCS versus solid content with 3%, 3.5% and 4% Types A, B and C binders after 28 days of curing. 6.17. 195. Stress-strain relationship for 80% solids content with 3.5% Type A binder mixes at 7, 14, 28, 56 and 90 days curing. 6.18. 199. Stress-strain relationship for 80% solids content with3.5% Type B binder mixes at 7, 14, 28, 56 and 90 days curing. xix. 200.
(21) ______________________________________________________________________ 6.19. Stress-strain relationship for 80% solids content with 3.5% Type C binder mixes at 7, 14, 28, 56 and 90 days curing. 6.20. UCS versus binder contents with 79% and 80% solids of paste fill at 28 days of curing. 6.21. 203. The effect pf binder type on the UCS of paste fills (Lamos and Clark, 1989). 6.22. 201. 204. Young’s modulus vs. binder content for 79% and 80% solids of paste fill at 28 days of curing. 204. 6.23. Variation of E with UCS for paste fills Types A, B and C binders. 205. 6.24. UCS versus curing periods for paste fill mixes of 80% solids contents. 206. 6.25. Binder cost vs. UCS (28 days) relationships for Types A, B and C binders. 6.26. 208. UCS vs. curing time for 79% solids contents of Cannington paste fills with Type A binder (OPC). 6.27. 211. UCS vs. curing time for 83% solids contents of Cannington paste fills with Type A binder (OPC). 6.28. 212. The effect of cement content on UCS of paste fills (Lamos and Clark, 1989). 6.29. 213. UCS against binder content for paste fill mixes of 79% and 83% solids contents with Type A binder from current and previous research. xx. 214.
(22) List of Tables Table. Details. Page. 3.1. Input parameters for analytical solutions. 33. 3.2. Comparison of vertical stress transformation at the bottom of stopes using different analytical solutions. 35. 3.3. Stope geometry. 42. 3.4. Summary of the self-boring pressure meter test results (Roux et al., 2005). 44. 4.1. Measured friction angles for 12 different hydraulic fill samples. 49. 4.2. Density, specific gravity and grain size distribution data for hydraulic fill samples A1, C3 and D2. 50. 4.3. Terzaghi and Peck’s classification (adapted from Skempton, 1986). 55. 4.4. Relative densities for hydraulic fills settled and consolidated under self-weight from previous researchers. 4.5. 57. Ratio between interface friction angle and friction angle for different surface conditions (Ampera and Aydogmus, 2005). 60. 4.6. Relative densities used in the interface shear tests on sample C3. 63. 4.7. Summary of modified direct shear test results for samples (a) A1, (b) C3 and (c) D2. 4.8. 68. The ratio between the friction angle and the interfacial friction angle for different hydraulic fills at different surface conditions. 4.9. Test data, vertical stresses and additional vertical stresses within the model stope for sample C3. 4.10. 85. Determined values of a and b for the proposed empirical solutions for Australian hydraulic fills for low surface roughness. 4.11. 87. Determined values of a and b for the proposed empirical solutions for Australian hydraulic fills for medium and high surface roughness. 4.12. 70. 88. Vertical normal stress ratio of circular to square sections at the bottom of the stope. 91. 5.1. Proposed models in numerical modelling. 100. 5.2. Number of elements, solution time and maximum vertical stress in FLAC 104. 5.3. Number of elements, distributed loads, solution time and maximum. 5.4. vertical stress in FLAC. 105. Grid size, number of elements and solution time in FLAC. 106. xxi.
(23) 5.5. Li et al.’s (2003) input parameters and constitutive models for rock and backfills. 5.6. 112. Solution time and vertical stresses at different locations for different stiffness values for 10 m x 60 m narrow stopes. 5.7. Solution time and vertical stresses at different locations for different stiffness values for 10 m x 60 m circular stopes. 5.8. 125. Summary of input parameters and constitutive models for rock and backfills (Rankine, 2004). 5.10. 130. Vertical normal stress and stress transformation to bottom of the stope at different levels using FLAC3D and FLAC models 3D. 5.11. Proposed stope dimensions for FLAC modelling. 5.12. Comparison of vertical normal stress at different stope levels using analytical solutions and numerical models. 5.13. 123. Stresses at middle and bottom stopes and solution times with and without interface elements. 5.9. 123. 133 134. 136. Comparison of numerical model, in situ measurements and overburden pressure. 142. 5.14. Material properties of hydraulic fills for the sensitivity analysis. 146. 5.15. Stress reduction factor at different stope levels. 151. 6.1. Summary of capital and operating costs for a paste backfill system (Hassani and Archibald, 1998). 176. 6.2. Physical properties of the tailings studied. 178. 6.3. Mix proportions used in the experimental program. 185. 6.4. Dimensions of the vane blades. 186. 6.5. Yield stress measurements for different solid contents with different binders. 6.6. 189. Summary of uniaxial compressive strength and Young’s Modulus after 28 days of curing period. 196. 6.7. Parametric study data-28 days curing time for 79% solids content. 197. 6.8. Parametric study data-28 days curing time for 80% solids content. 198. 6.9. Comparison of the proposed and current paste fill mixes. 209. xxii.
(24) List of Symbols ρ. =. backfill or strata density. φ. =. friction angle of backfill. ψ. =. dilation angle of backfill. μ. =. friction coefficient between rock and fill. δ. =. angle of wall friction or interfacial friction angle. α. =. angle of failure plane from horizontal. β. =. inclination of stope to vertical. γ. =. fill bulk unit weight. γrock. =. unit weight of rock. ν. =. Poisson’s ratio. ∆min. =. the smallest width of an adjoining zone in the normal direction. ∆n. =. displacement normal to the interface. ∆s. =. displacement along the interface. σv. =. average vertical normal stress. σh. =. average horizontal stress. σ. =. normal stress. σv,add. =. additional vertical normal stress. τ. =. shear stress. τpeak. =. peak shear stress. b. =. the distance between rock side-boundaries and stope walls. c. =. fill cohesion or cement bond strength of fill. Ci. =. lateral compressive forces. Cu. =. coefficient of uniformity. Cc. =. coefficient of curvature. d. =. the depth of rock above the stope from the ground surface. D. =. diameter of vane blade. E. =. Young’s modulus of backfills. F. =. factor of safety. G. =. shear modulus. h. =. stope or strata height. k. =. Permeability of soil. kn. =. interface normal stiffness. ks. =. interface shear stiffness. xxiii.
(25) K. =. bulk modulus. Ko. =. Earth pressure coefficient at rest condition. Ka. =. Rankine active earth pressure coefficient. Kp. =. Rankine passive earth pressure coefficient. l. =. Length of stope or length of block. L. =. Length of vane blade. P. =. error analysis factor. R. =. the proportion of active wall length. Si. =. Vertical shearing forces on the fill-wall interface. T. =. Torque. Ti. =. Horizontal shearing forces on the fill-wall interface. V. =. internal vertical forces. w. =. stope width or width of block. W. =. weight of the backfill. dW. =. the weight of the backfill above the layer element. ydisp. =. Vertical displacement. z. =. stope or strata depth. zo. =. height of fill at which arching starts to develop. dz. =. thickness of the backfill element. xxiv.
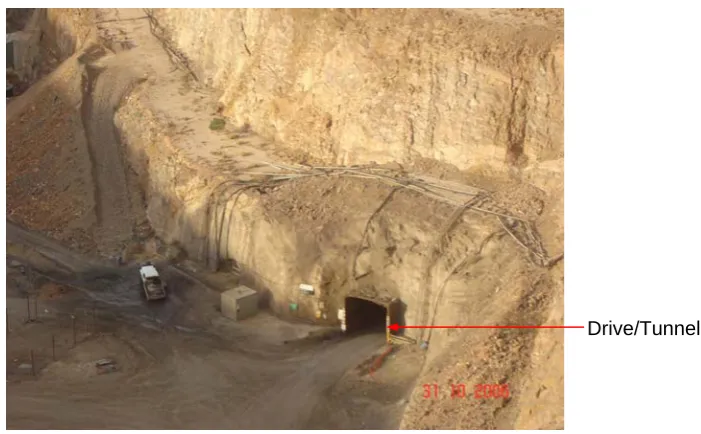
(26) Chapter 1. Introduction. Chapter 1. Introduction 1.1 General Within the earth, it is common to have numerous mineral deposits both close to the surface and deep underground. The development of mining products significantly influences the economies of many countries such as Canada, Australia, China and the USA. In fact, there are several negative aspects in recovering fragments from the ground; such as environmental pollution due to blasting operations and waste materials accrued during excavation and the effect of regional stability due to not properly backfilling the excavated openings. Therefore, the main criterion for the success of a waste management system is to implement and operate a safe and environmentally responsible system at minimum cost.. There are two distinct mining methods available in mining operations. The earliest mining method is called surface mining, which left the openings after the ore had been excavated. The recent and the most popular mining method is the underground mining method. Figure 1.1 shows the underground mine at Osborne mine, Mount Isa, Australia. The large voids created in the process of underground mining operations are generally backfilled by mill tailings that are left over from the processing of mineral ore. The underground voids that are backfilled are known as stopes, and can be approximated as rectangular prisms, which can have heights exceeding 200 meters. Backfill refers to any waste material and soils that is placed into the stopes for the purpose of disposal or in the performance of some engineering function. Hydraulic fills (HF), cemented hydraulic fills (CHF) and paste fills (PF) are some of the more popular backfills currently used world-wide.. Backfill, an increasingly important component of Australian mining operations, refers to any waste material and soils that is placed into voids mined underground not for the purpose of transmitting the rock stresses, but reducing the relaxation of the rock mass so the rock itself will retain its load carrying capacity and will improve load shedding. ______________________________________________________________________ 1.
(27) Chapter 1. Introduction. Drive/Tunnel. Figure 1.1. Underground mining at Osborne mine.. to pillars (Barrett et al., 1978). The voids are backfilled on the completion of ore extraction and the backfills provide local and regional stability of rock while removing the adjacent stopes in order to continue the mining sequence.. Typically, the backfills have to be prepared as engineered materials to ensure the stability of large rock faces when the stopes surrounding the backfill are being mined. To achieve sufficient strength, the binders are mixed with tailings, commonly from 3% to 5% of ordinary Portland cement. Further, the cost of the placed minefill is a primary factor in optimizing the mining process. In the case of cemented fill, the binder cost is the major cost component, which is increased substantially in remote mines due to the transport cost. Therefore, reducing the cement cost is a critical factor in reducing the cement fill costs. However, it is necessary to ensure that the minimum binder content required for static stability of the backfilled stope is utilized when the stope walls are exposed through the mining sequence.. The stopes are connected through drives (tunnels) in order to remove the fragments from the ore body and to supply the backfill materials to the stopes during the backfilling operations (see Figure 1.1). When the fill material enters the stope, all drives must be sealed properly to prevent the leakage of fills through drives. The backfills are commonly in a form of slurry or paste when placed into the stope, and quickly spread to other parts of the underground voids. In the case of hydraulic fill mines, the highly permeable barricades are constructed within the drives to remove the. ______________________________________________________________________ 2.
(28) Chapter 1. Introduction. excess water from the filled stopes and barricades are used while filling with paste backfills.. Recently, there had been several catastrophic accidents due to the barricade failures in Australia and in other parts of the world. To minimize barricade failures, it is necessary to properly understand the stress developments within minefill stope. Anecdotal evidence shows that the stresses at the bottom of the mine stopes are significantly less than what one computes as the product of unit weight (γ) of the fill and the depth (z).. Due to the arching mechanism, at any depth within the fill, the. vertical normal stress is less than γz. In the absence of any rational estimate of the vertical normal stress at a depth, the general tendency is to assume that the vertical stress is equal to the entire overburden pressure (γz). In reality, a significant fraction of the overburden may be transferred to the wall, and therefore the vertical stress can be substantially less.. 1.2 Problem Statement Ore body is divided into separate stopes for mining operations. Solid rock, within each stope, is blasted and removed from the ore body before backfilling the voids created underground. As the mine sequence progresses, the stopes adjacent to the fill are mined, the fill mass is subjected to blasting loads and subsequently exposed. During this time, the fill must remain stable to prevent dilution. van Gool et al. (2006) reported the blasting effects using the finite element software ABAQUS. When the underground voids are backfilled using backfill materials in the form of slurry, especially in hydraulic fills, it introduces substantial quantities of water into the stope. Recently, several underground failures have occurred in Australia and worldwide as a result of poor drainage of excess water from the stope during the backfilling stages of the operation. Rankine (2006) developed 2-dimensional and 3-dimensional models on drainage characteristics of Australian underground hydraulic fills.. This dissertation deals with the static stability of backfilled stopes in particular, with special reference to arching effects for investigating actual stress developments within the stope. This can only be done in the context of a thorough understanding of the effect of arching. Further, the stability of underground barricades is critical to the provision of a safe working environment within the mine. Also, any reduction in the cement content and/or investigation of alternative binders in paste fills for the currently. ______________________________________________________________________ 3.
(29) Chapter 1. Introduction. used Ordinary Portland cement will lead to substantial cost saving and will be well received by the mining industry.. 1.3 Scope of Research The aims of this research are: 1. To develop a laboratory model on arching that will be verified with numerical models and analytical solutions.. 2. To extend the current FLAC model (Li et al., 2003) on arching effects by incorporating interface elements for vertical stopes.. 3. To develop approximate axi-symmetric solutions to 3-Dimensional models (Rankine, 2004).. 4. To develop FLAC3D models on arching for the square and rectangular backfilled vertical stopes.. 5. To investigate mixes of blended cements and Cannington tailings to reduce the binder cost in paste fills.. 6. To investigate the long term strength of paste fills with particular reference to Cannington mine.. 1.4 Relevance of the Research The strength and stiffness of minefills need to be adequately understood as they play a significant role in the safety and economy of underground mining operations. There were several catastrophic stope and barricade failures in underground mines in Australia and elsewhere. These stability problems show the inadequate knowledge of actual stress developments for designing the backfilled materials and barricades.. The primary motivation for this research is to investigate the stress measurements through a thorough analysis of arching effects within the mine stope, and possibility of reducing the cement content and/or selecting an alternative binder for the Ordinary Portland cement in the paste fill. There are very limited physical models to investigate the arching effects in mining that are reported in literature. Development of an arching effect instrument will allow comparison of the results against analytical solutions and numerical models using FLAC and FLAC3D.. Binders have a significant role in backfilling operations, especially in paste fills. As binder is the major cost component in paste, there have been several attempts by researchers world-wide to reduce the percentage of cement and explore the possibilities of offering other pozzolanic materials such as fly-ash, slag and others as. ______________________________________________________________________ 4.
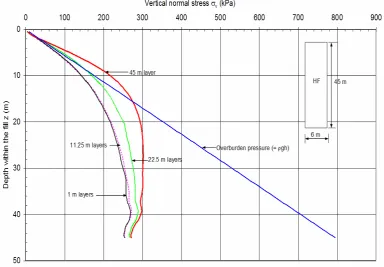
(30) Chapter 1. Introduction. partial or sometimes total substitutes and identify an alternative binder with lower cost. From this research, it may lead to following positive aspects for the mining industry: •. Significant cost savings;. •. Increased safety in mine practices; and. •. Significant reduction in catastrophic failures and increased productivity due to better understanding of stress developments within the fill masses of primary stopes.. 1.5 Thesis Overview Chapter 1 introduces the research problem, objectives and the relevance of the research. An overview of the major issues associated with the mining methods, with the types of backfills available in mining operations, arching effects on hydraulic and paste fills, and blended paste fill designs are given in chapter 2. Chapter 3 gives the previous analytical solutions on arching effects and an analytical solution modified by the author and some of the available in situ stress measurements within the underground mines.. A review of the friction angle of hydraulic fills and interfacial friction angle between the soft materials and stiff surrounding walls including typical values are discussed in chapter 4. Also, internal friction angles of Australian hydraulic fills and interfacial angles between the hydraulic fills and rock regions were investigated using direct shear tests and modified direct shear tests. These values were used for the numerical modelling in chapter 5. The current state-of-the-art for physical models on arching, a newly developed laboratory model, the proposed test methodology and corresponding results from the arching experiments are reported in Chapter 4, while the effects of stope geometry, wall roughness and the filling materials on stress developments within the stopes are reported at the end of this chapter.. Chapter 5 describes the current state-of-the-art of numerical modeling of arching effects, modification of existing numerical models and extension of the modified numerical model with interface elements for vertical narrow stopes using FLAC. Further, an equivalent FLAC axi-symmetric model was developed for verification with laboratory and analytical models for cylindrical stopes. A general solution was developed for general stope sections using FLAC and FLAC3D investigations carried out for narrow, circular, square and rectangular sections. Furthermore, analytical solutions and experimental results were verified against numerical models and in situ measurements in vertical stopes.. ______________________________________________________________________ 5.
(31) Chapter 1. Introduction. Chapter 6 details the previous models on paste fills using ordinary Portland cement and blended cements, short term flow characteristics and cost estimation throughout the world. A cemented paste fill model was developed for Cannington mine in terms of short, medium and long-term strength with blended cements as the binders, and the effect of long-term strength with ordinary Portland cements was also reported. In addition the physical, chemical, and flow properties are reported through numerous laboratory tests. This chapter identifies an alternative binder with suitable strength and flow properties with significant cost savings. A summary of the research and recommendations for future research are presented in Chapter 7.. ______________________________________________________________________ 6.
(32) Chapter 2. Literature Review. Chapter 2. Literature Review 2.1 General Worldwide use of backfill for mine operations continues to increase, with significant changes having been introduced in the design and implementation of different support media during recent decades. Moreover, in the modern era, backfill serves critical purposes, the least of which is provision of adequate support during the primary and secondary mining cycles. However, the recent spate of catastrophic fills barricade failures in Australia and worldwide have led to a need for an increasing understanding into the factors which lead to failure of the fills during underground mining operations.. In the mining industry, a huge amount of fine grained tailings are produced during the mineral processing every day. The largest generator of solid waste in Australia is the mining industry (Boger, 1998). The wastes are generally in the form of a slurry that is deposited hydraulically in the disposal area. The disposal of these wastes effectively, environmentally and economically has become a major challenge for all mining operations. The mine filling techniques, which generally use these by-products, provide ground support to permit removal of adjacent, remaining ore, and are also effective means of disposal of waste materials.. This chapter aims to summarize the review of mining methods, the types, selection and purpose of minefill material that are used in minefill operations. The research undertaken in this dissertation for arching studies within the minefill stopes using laboratory experimental model studies are limited to only hydraulic fills and optimization of paste fills using Portland cement and blended cements for short, medium and long term strength and stiffness studies are for paste fills. The introduction to stress measurements within the stope is discussed. An extended literature review has been provided at the beginning of the chapters 3, 4, 5 and 6. A more extensive review of arching models including the analytical solutions and in situ measurements, physical models and numerical models is given in chapters 3, 4 and 5. ______________________________________________________________________ 7.
(33) Chapter 2. Literature Review. respectively. In chapter 6, a literature review on paste fill models and short term flow characteristic modes are discussed in detail.. 2.2 A review of mining methods In mining, a method of extraction is carried out such that most of the mine waste is used to backfill the mine stopes effectively and efficiently. During the backfill operations, the applied backfilled method must be safe and allow optimum extraction based on field and environmental conditions. The consideration of the following physical properties is a major factor on selecting a stoping method in mining operations: •. Strength of ore and wall rocks. •. Shape, area and volume of the ore body. •. Thickness of the existing deposit. •. Continuity of the ore. There are two broader classes of mining methods such as surface mining and underground mining, which depend on the location of the ore extraction. Grice (2001) reported the usage of both surface and underground mining methods in a number of mines in Australia, mostly in Western Australia. Figure 2.1 shows the schematic diagram of surface and underground mining methods. These methods are briefly explained below.. Figure 2.1. Schematic diagram of surface and underground mining (http://www.coaleducation.org/Ky_Coal_Facts).. ______________________________________________________________________ 8.
(34) Chapter 2. Literature Review. 2.2.1 Surface mining Surface mining is the predominant exploitation procedure worldwide. This is a type of mining in which soil and rock overlying the mineral deposit are removed. This is used when deposits of useful minerals or rock are found near the surface; i.e. surface material covering the valuable deposit is a relatively thin layer of overburden soil and rock. One of the major disadvantages of surface mining is the significant cost while removing larger volumes of soil and rock.. There are two kinds of surface mining such as strip mining and open pit. Strip mining is the mining practice where minerals are removed as long strips of overlying soil and rock. It is most commonly conducted in coal mine operations. The open pit method is also similar to the other types of open-cast mining operation. Typically, there are four basic unit operations common to most open pit mining operations. These are drilling, blasting, loading, and hauling. Figure 2.2 shows the surface mining operations at Western Kentucky Coal mine. Grice and Fountain (1991) and Grice (2001) give further details of surface mining.. Figure 2.2. Surface mining operation at Western Kentucky Coal mine (http://www.coaleducation.org/Ky_Coal_Facts).. 2.2.2 Underground Mining Figure 2.3 shows the comprehensive classifications of underground mining methods by Brady and Brown (1993). Underground mining methods can be divided into three major categories such as naturally supported, artificially supported and unsupported. These are differentiated based on the type of wall and roof supports, size of openings and the direction of mining operations progress. The stopes supported either naturally. ______________________________________________________________________ 9.
(35) Chapter 2. Literature Review. Figure 2.3. Underground mining methods (Brady and Brown, 1993).. or artificially are commonly called stable stopes. The stable stopes mainly include opening stoping, room and pillar and cut and filling mining methods. The unsupported stopes are not a stable form of mining where the ore is allowed to collapse under its own weight through natural cracks and failures. Figures 2.4 and 2.5 show the schematic diagrams of the open stoping and cut and fill mining methods. Hamrin (1982), Budavari (1983) and Brady and Brown (1993) gave comprehensive descriptions of each of the various mining methods.. Figure 2.4. Schematic diagram of Open stoping mining (Hans, 2001).. ______________________________________________________________________ 10.
(36) Chapter 2. Literature Review. Figure 2.5. Schematic diagram of Cut and Fill mining (Hans, 2001).. BHP Billiton’s Cannington mine is one of the largest paste backfilling operations in Australia. Here, they use the open stoping mining method during the backfilling operations. This research is based on the open stoping mining method in conjunction with Australian hydraulic fills (MIM, Osborne and Newmont mines) and paste fills (Cannington mine). Backfill performs many functions in underground mining operations, depending on the type of mining method used and other factors. The selection of backfill operation must be capable of filling underground openings at a required rate without affecting the mining schedule. Backfill is often required to offer some self support properties by adding a required proportion of binders. However, even the strongest backfill is soft when compared to the mechanical properties of the adjacent rock mass, and this difference in stiffness between two materials enhances the effect of arching within the stope, especially for relatively narrow stopes (Li et al., 2003). Dorricott and Grice (2002), and Grice (1998 and 1989) reported backfill performance, system selection, and backfill design issues in detail.. Any uncemented backfill materials must satisfy the static, dynamic and drainage requirements in minefill operations. Rankine (2006) reported briefly of each of these requirements. Furthermore, cemented fills must satisfy the static and dynamic requirements in minefill operation, and these are briefly reported on Rankine (2004).. ______________________________________________________________________ 11.
(37) Chapter 2. Literature Review. 2.3 A summary of backfill materials Mine backfills can be mainly classified into two categories; cemented and uncemented. The names simply suggest that cemented backfills contain a small amount of binders. The binders are normally Portland cement or some other pozzolans. Uncemented fills are similar to soils and can be investigated using soil mechanics theory. There are different types of backfills which fall into categories such as hydraulic fill, cemented hydraulic fills, paste fill, rock fills and composite fills, etc. Here, some of the most popular backfills such as hydraulic fills and paste fills, currently used worldwide are briefly discussed.. 2.3.1. Hydraulic fills (HF). Hydraulic fill is produced directly from coarse sands and/or mill tailings, or by desliming finer tailings by use of hydrocyclone. This is a heterogeneous slurry that is delivered through bore holes and pipe lines to the underground workings. Here, it is necessary to construct approximately 4 m x 4 m cross-sectional barricades within the drives to remove the excess water to reduce the risks associated with significant pore pressure. Cowling (1998) reported the introduction of hydraulic fill at the Southern mine of Broken Hill South Limited, Broken Hill, New South Wales, Australia. Currently, there are nine different underground mining operations using hydraulic fills in Australia. Grice (2001) listed these mines as follows; two in Queensland, two in Western Australia, two mines in Tasmania and three mines located in New South Wales.. Grice and Fountain (1991), Grice et al. (1993), Bloss and Chen (1998) and Grice (1998) recommended design specification for hydraulic fills, especially to ensure that within the hydraulic fills, permeabilities are sufficient to remove the excess water through the permeable barricade.. The definitions of hydraulic fills are adapted from Grice (2001) and are given as follows: •. The maximum grain size is generally less than 1 mm and most of the finest sizes are removed to ensure that not more than 10% weight of less than 10 μm are retained, to ensure enough fill permeability. The 10% limit may need to be reduced at times and its acceptability must always be accompanied by some caution.. ______________________________________________________________________ 12.
(38) Chapter 2 •. Literature Review Typically slurries are prepared at densities from 40 to 50%cv solids by volume. For common mineral processing waste materials this is equivalent to a slurry density greater than 70%cw.. •. The slurry transport regime is heterogeneous and turbulent at average velocities higher than the critical settling velocity.. •. Hydraulic fill has a in situ hydraulic conductivity in the range of 10-5 to 10-6 m/s. Excess water used to deliver the solid components to the stope must drain out of the fill, by vertical gravity drainage through the fill, decantation and through engineered drainage facilities at stope access points.. Rankine (2006) reported on experimental and numerical modelling studies on hydraulic fills and barricade bricks, with particular reference to load-deformation and drainage characteristics. Rankine (2006) also found out that the specific gravity of the 25 Australian hydraulic fills were from 2.8 to 4.5 and the hydraulic fills settled to a porosity of 37% to 48%, void ratio of 0.58 to 0.93 and relative density of between 50% and 80%. In addition, the hydraulic conductivity of these hydraulic fills were determined using constant and falling head tests, and the values ranged from 10 mm/hr to 30 mm/hr. Rankine (2006) gave comprehensive details of current practice of the hydraulic fills, including geotechnical aspects of the hydraulic fills, failure mechanism in underground mine barricades, in situ monitoring of hydraulic fill stopes and laboratory and numerical modelling of hydraulic fill stopes. In this dissertation, three different Australian hydraulic fills were used to develop models on vertical and horizontal normal stresses within the mine stopes. 2.3.2. Paste fills (PF). The concept of paste fills was introduced by Dr. Eli Robinsky in the mid 1970’s and this falls into the category of thickened tailings. In mid 1980, the paste fill was first used in Elura mine in New South Wales which was not successful. The successful paste backfill systems occurred in Canada and Cannington mine in Australia in the late 1990. Currently, there are five major established paste filling systems in Australia; such as in Cannington and Mount Isa in Queensland, Henty in Tasmania and Kanowna Belle and Junction in Western Australia. Figure 2.6 shows the location of the established paste fill systems in Australia.. ______________________________________________________________________ 13.
(39) Chapter 2. Literature Review. Figure 2.6. Location of Australian paste fill systems (Rankine, 2004).. Paste fill is the most recent well-developed mine backfill used to satisfy engineering characteristics required in the mining industry to fill underground openings. It has significant advantages over other methods of disposal so the number of mines employing paste fill is rapidly increasing. The major components of paste backfills are shown in Figure 2.7. As can be seen in Figure 2.7, the paste fills consist of tailings, binding agents and water. Paste fill has high solids contents in the range of 75% to 83% by weight. Furthermore, it is necessary to add sufficient water in order to provide the consistency of the paste fills of around 200 mm of slumps by the standard slump cone tests.. 75%-83%. Figure 2.7. Major components of paste backfills (Adapted from Belem and Benzaazoua, 2008).. ______________________________________________________________________ 14.
(40) Chapter 2. Literature Review. The required strength and stiffness of this fill can be achieved by mixing with low percentage of binders such as ordinary Portland cement and blended cements. Paste fills have been more popular in the past few years due to having several operational and. environmental. benefits. compared. to. other. backfills. (Landriault,. 1995,. Brackebusch, 1994). Bloss (2002) described the following basic characteristics of paste fills: •. Commonly consists of mine tailings as the basic component which can contain sand and rock.. •. Tailings should have at least 15% of fine grains (< 80 μm) by weight (Landriault 1995).. •. The density of the tailings is significantly higher than hydraulic fill.. •. Binders are added to tailings to achieve required strength to avoid the risk of possible liquefaction of paste fill after placements. Due to existing binders, the paste fill have more sticky behaviour than hydraulic fills and thus pipe friction losses are significantly high while being supplied through pipes.. Rankine (2004) reported that the bulk density of Cannington paste fills is 2300 kgm-3 and Rankine (2006) gave the average density for the Australian hydraulic fill as between 1440 kgm-3 and 2040 kgm-3. A major disadvantage of paste fill is the high capital cost. In the economic view point, paste fill presents the highest capital cost of all the possible minefill methods. However, Brackebush (1994) reported that the paste fill has the lowest overall operating cost and in the long term it can provide significant economic benefits. Also paste fill is a relatively new technology; there is limited experience and knowledge in this area. Therefore, the rapid increase in paste fill operations suggest that it is important to conduct more research to gain more knowledge of paste fills and their properties. Rankine (2004) carried out a qualitative assessment of Cannington tailings mineralogy using X-ray diffraction (XRD), coupled with a semi-quantitative X-ray fluorescence (XRF) analysis. The results showed that tailings consist of silver minerals (< 1%), galena (2.4%), spalerite (1.3%), iron sulphides (39.5%), talc (11.1%) and other silicates (40.7%). The silicates are mostly quartz with a small amount of chalcopyrite. In this research, an Australian mine tailings from Cannington mines, 79% to 83% of. ______________________________________________________________________ 15.
(41) Chapter 2. Literature Review. solids contents, were used in order to develop paste fill models for the current mix. The physical and mechanical properties of Cannington mine tailings including grain size distribution, density, specific gravity, etc. are discussed in Chapter 6. 2.4. Concept of arching and available models. In several civil and mining applications, the frictional backfill material is placed into confined narrow openings. The frictional backfill material initially yields and then moves downward in relation to surrounding rigid materials or walls. Shear stresses are generated along the contact interfaces to resist the downward movement. A portion of applied loads or self weight of filling material is thus transferred to adjacent stationary parts (Li et al., 2003). Therefore, the resulting vertical normal stress in the backfill is significantly reduced and this phenomenon is called arching.. Typically, there are four common ways to determine the effect of arching in the geotechnical and mining applications. The methods are; •. Analytical equations. •. In situ measurements. •. Physical models. •. Numerical models. The analytical models on vertical and inclined stopes proposed by previous researchers and in situ measurements at different geotechnical and mining operations in the world are reported in chapter 3. The vertical analytical models such as Marston (1930), Terzaghi (1943), Mitchell et al. (1982), Winch (1999), Free standing vertical face (Grice, 2001) and Modified Marston’s theories (Aubertin et al., 2003 and Li et al., 2003) are discussed in Section 3.3.1. The inclined analytical solution is reported in Section 3.3.2. The limited in situ measurements available on stress measurements in mining applications are discussed in Section 3.4.. The development of a small scale laboratory model is necessary due to limited in situ measurements in the underground mines. This model is also useful to compare and verify with other available methods. The current state-of-the-art physical models on stress measurements in geotechnical and mining applications are discussed in chapter 4 (Section 4.3). The important physical models are the ones used by Terzaghi (1943), Mitchell and Wong (1982), Low et al. (1994), Winch (1999), Take and Valsangkar (2001) and Euler and Aldrich (2002).. ______________________________________________________________________ 16.
(42) Chapter 2. Literature Review. With the development of high powered and more affordable computers, the numerical methods have been significantly utilized in backfill designs for very complex stability problems. The important numerical models using finite different methods and finite difference methods are reported in Chapter 5. The details of Bloss (1992), Coulthard (1999), Pierce (2001), Li et al. (2003), Aubertin et al. (2003) and Rankine (2004) models are given in Section 5.2.. ______________________________________________________________________ 17.
(43) Chapter 3. Analytical Models and In situ Measurements on Arching Effects. Chapter 3. Analytical Models and In situ Measurements on Arching Effects 3. 1 General The mining industry plays a significant part in the economy of countries such as Australia, Canada, South Africa, China and others. In the process of mining, where the objective is to extract the minerals from the ore body, large underground voids are created. These voids have to be backfilled to provide regional stability for adjacent mining activities. In addition, the backfilling of the underground voids provides a means for disposal of the unwanted waste rock generated from the mining operation. The waste rock, often crushed into smaller grains, can be placed back into the underground voids in the form of hydraulic fills, paste fills, and aggregate fill, etc., with or without cement. Hydraulic fills are one of the most popular mine backfills used in Australia and worldwide. Hydraulic filling of underground mines have been discussed in more detail by Sivakugan et al. (2005) and Rankine et al. (2005).. To minimize barricade failures, it is necessary to properly understand the stress development within backfilled stopes. Anecdotal evidence shows that the stresses at the bottom of the mine stopes are significantly less than what one computes as the product of unit weight (γ) of the fill and the depth (z). As the yielding backfill moves between stable unyielding rock walls, the relative movement is opposed by shear resistance along the rock-backfill interface and the shear stress generated along the contacted area tends to retain the yielding backfill in its original position. This phenomenon is called. arching. A schematic diagram of this process is shown in. Figure 3.1.. ______________________________________________________________________ 18.
(44) Chapter 3. Analytical Models and In situ Measurements on Arching Effects. Figure 3.1. Schematic diagram of arching within mine stopes.. Relative sliding between particles is the most important mechanism of deformation within a fill mass. Terzaghi (1943) observed that vertical stress due to the self-weight of the soil is transferred to adjacent soil or containing walls. Geotechnical and mining problems concerning arching have typically been analysed using four different methods: Analytical equations, in situ measurements, physical models, and numerical models. It is very important to investigate the effects of arching comprehensively while doing backfilling in order to be able to estimate the stresses within the backfill realistically.. In this chapter, many previous analytical solutions and in situ measurements for frictional sliding along the side walls and with or without cohesion at the fill-side walls interface are explained. Also, some analytical solutions are investigated for vertical stopes. The discussion of the current state-of-the-art and investigations of physical and numerical models related to arching in minefills are presented in Chapters 4 and 5 respectively. The verification of analytical solutions described in this chapter against numerical modelling and laboratory modelling are included in Chapter 5.. 3.2 Necessity for Arching Consideration in Backfills Within a continuous stratum with no lateral confinement, vertical normal stress (σv) at a point is generally calculated using Eq. 3.1. Figure 3.2a shows a cross section of continuous strata and its corresponding vertical stress profile calculated using Eq.3.1 is shown in Figure 3.2b.. ______________________________________________________________________ 19.
(45) Chapter 3. Analytical Models and In situ Measurements on Arching Effects. σv = γz. 3.1. where γ = unit weight of the fill (kN/m3); and z = strata depth (m). (a). (b). Figure 3.2. Vertical normal stress in a continuous strata (a) cross section of strata (b) vertical stress profile.. Figure 3.3 shows two vertical stress profiles in a narrow model stope with a height of 600 mm and width of 100 mm, calculated using Eq.3.1 and Aubertin et al. (2003) solution, a modified Marston’s (1930) theory that takes arching into account. In Figure 3.3, a density (ρ) of 1650 kgm-3 and friction angle (φ) of 35o for the strata were assumed.. ρ = 1650 kg/m3 φ = 35o ρ = 1650 kgm-3 φ = 35o. Figure 3.3. Comparison of arching and non-arching vertical stress profiles.. ______________________________________________________________________ 20.
(46) Chapter 3. Analytical Models and In situ Measurements on Arching Effects. Vertical normal stress using Eq.3.1 overestimated vertical stress because it fails to consider the influence of arching and approximately 60% of stress reduction occurs due to arching at the bottom of the stope. Overestimating vertical stresses causes backfill to be over designed for strength in minefill operations, resulting in the addition of unnecessary binders and significantly inflated expenditure. Therefore, it is very important to investigate the effects of arching while doing backfilling comprehensively, to be able to estimate the vertical stresses within the backfill accurately.. 3.3 Arching in Geotechnical and Mining Applications – Analytical Solutions Analytical solutions are popular tools for estimating the stresses within the backfilled stopes. Numerical models are able to account for the complexity of the stope geometry and complicated boundary conditions to meet the realistic situations. However, the analytical solutions provide a useful alternative approach for investigating stress magnitudes much more quickly than the numerical solutions. For example, Terzaghi (1943) analytical solution is very simple and quick compared to numerical models using finite element (ABAQUS, TVIS) and finite difference (FLAC, FLAC3D) software for arching investigation. Furthermore, analytical solutions are more suitable way for addressing uncertainty under conditions of limited information. In Section 3.3.1, previous analytical solutions and few extended solutions for vertical stopes are discussed. The modified analytical solution for inclined stopes is given in Section 3.3.2.. 3.3.1 Vertical stope Traditionally, cemented hydraulic fill and paste fill stopes are designed as free standing walls and the requirement at a specific depth is to have significant strength to sustain the overburden pressures due to self-weight. Conservatively the uniaxial compressive strength (UCS), obtained under no lateral confinement, is used as design strength (Grice 2001). However in reality, due to confinement by the surrounding rock and the resulting arching effects, the adjacent rock walls contribute partial support towards the fill, which was clearly explained through a confined block mechanism by Mitchell et al. (1982).. Some arching theories have suggested that when arching occurs, the vertical stress at the bottom of the filled stope is significantly less than that from the self-weight pressure which is obtained by multiplying the depth by unit weight as in Eq.3.1 (Marston, 1930 and Terzaghi, 1943). The following analytical solutions account for frictional sliding along the side walls and/or the existence of cohesion at the fill-side wall interface.. ______________________________________________________________________ 21.
Figure

+7
Related documents
Although MyPHRMachines cannot ensure that genome data is used ethically by the organization performing the initial DNA sequencing, it can be used to protect patient privacy in
Because treatment of mental disorders is critical for reducing homelessness, I explored the ways homeless women with mental illnesses access mental health services and the
8 Attebery, like Irwin, distinguishes between the fantastic and fantasy: the fantastic as a mode of storytelling incorporates the whole of myth, fairy tale, magic realism,
› Teaching practice – establishment of true partnerships between TTI and schools that will include students – future teachers – in the work of every aspect of
Despite the increase in clinical crown height, a potential for pulpal exposure remains because tooth reduction is required to provide sufficient interocclusal space for crowns on
In addition to studying clinical outcomes of parents and sometimes children, several studies have also measured the effects of mindfulness training on mindfulness based measures
As of 1994, 263 physi- cians have completed family practice training in Massachusetts, 31 graduates from the New England Memorial Hospital Program and 232 from the
potential photonics-related research and innovation topics as input to the Societal Challenges work programme or for joint programme activities.?. Aim of the
