Catherine Grant, Becky Hamlyn
Res earch Report DFE-RR026a
Parental Experience
of Services for
Disabled Children:
This research report was written before the new UK Government took office on 11 May 2010. As a result the content may not reflect current Government policy
and may make reference to the Department for Children, Schools and Families (DCSF) which has now been replaced by the Department for Education (DFE).
Table of Contents
1 Introduction ... 1
1.1 Background ... 1
1.2 Development of the indicator ... 1
1.3 Roll-out of the indicator survey ... 1
2 Survey method 2008-09 ... 3
2.1 Development of the screener questionnaire ... 3
2.2 Development of the indicator questionnaire ... 4
3 Fieldwork ... 6
3.1 Main stage mailings ... 7
3.2 Alternative methods of completing the survey ... 9
4 Sampling ... 10
4.1 Target population and sampling frames ... 10
4.2 Sampling procedure ... 11
4.3 Actual Outcomes ... 18
4.4 Weighting ... 23
5 The 2009-10 Indicator survey (Year 2) ... 26
5.1 Stage 1 - The screener questionnaire ... 26
5.2 Stage 2 – The indicator survey ... 26
5.3 Response rate for Fresh and panel sample ... 37
Sampling ... 41
5.4 Alternative methods of completing the survey ... 49
6 Designing and calculating the indicator ... 51
6.3 Treatment of valid and non-valid responses ... 52
6.3.1 Missing answers ... 53
6.3.2 Specific missing answer categories ... 54
1 Introduction
1.1 Background
The Department for Children, Schools and Families (DCSF) commissioned TNS-BMRB to conduct a survey among parents of disabled children.
The survey was primarily designed to generate an overall indicator and set of sub-indicators which measure parental views on the five elements of the Core Offer as set out in the government’s report Aiming High for Disabled Children1. These
comprise: Information; Transparency; Assessment; Participation; and Feedback. Sub-indicators have been calculated for each of these elements within the three service areas of Health, Education and Care & family support2. Thus, there are a
total of 15 sub-indicators which are also combined to form an overall high-level indicator reported at the national and local level.
This technical report details the methodology for the first wave of the research. The methodology was kept largely consistent between year 1 and year 2 but where there were differences these are outlined in Chapter 5.
1.2 Development of the indicator
The methodology for the indicator and the surveys which underpin it was developed by NatCen, who were appointed by the DCSF to conduct the feasibility stage3. To
meet the requirements for a large-scale survey and also the budget constraints, the proposal was for two paper-based questionnaires. The first was a short “screening questionnaire” to identify parents with disabled children. The second was a longer questionnaire, sent only to parents identified as having disabled children, designed to question them on their experiences of local services. The answers to the second would then be used to calculate the indicator. Both questionnaires were subject to detailed testing4.
1.3 Roll-out of the indicator survey
The first wave of the survey conducted by TNS-BMRB was used to calculate a national baseline indicator, together with local authority level indicators in those 30
1
2 In the questionnaire this was abbreviated to Social Care
authorities which have included the indicator in their Local Area Agreement (LAA) or as a local target for 2008-09.
Subsequent waves will provide both national and complete local level (higher level LA and PCT) indicators – and the first of these was carried out by TNS-BMRB in summer/ autumn 2009 and reported in February/March 2010.
Financial Year
Questionnaires sent to parents
Indicator Score published
Spatial level National overall score 2008-09
(baseline)
March/April 2009 May 2009 National and 30 LAs
59
2009-10 September/October 2009
December 2009 National and all local areas
2 Survey method 2008-09
The indicator is based on an intended minimum sample of 200 parents of disabled children in each local area. The definition of a disabled child/ young person used is as defined by the Disability Discrimination Act (DDA) 1995: “a physical or mental impairment which has a substantial and long-term adverse effect on his or her ability to carry out normal day to day activities”.
2.1 Development of the screener questionnaire
Much of the development of the screener and main indicator questionnaires was undertaken by NatCen and details of the piloting and development work can be found in their report5.
The screener questionnaire collected details for up to four children within each household with an instruction that respondents should call the research team to request an additional questionnaire should they have more than four children.
The screener questionnaire collected the following information:
•
Number of children in the household•
For each child aged between 0-19;o Name
o Sex
o Age
o Whether child had difficulties with certain areas of life
o Whether any medication was taken
o Whether child continued to have difficulties even after taking medication
•
Permission to re contact•
Telephone number•
Name of parentThe questionnaire was professionally designed to make the document look eye catching and appealing to parents and thus encourage response.
2.2 Development of the indicator questionnaire
As with the screener questionnaire the main indicator questionnaire was cognitively tested by the National Centre for Social Research. TNS-BMRB reviewed the questionnaire and made a number of minor amendments to the content of the questionnaire. One of the more significant changes made to the questionnaire was the inclusion of three comment boxes inviting parents to write in any additional comments they wished to make about the services they received for their children. A separate comment box was included for each of the three service areas of health, education and care & family support. Respondents were invited to complete the main questionnaire for their child who had been identified as having a disability or health problem through the screener survey.
The main questionnaire covered the following areas:
•
Receipt of Disability Allowance•
Ethnicity•
Areas in which child is affectedAnd for each of the three services areas (Health, Education and Care & Family Support) the following areas were covered:
•
Services used in the last 12 months•
Rating of the services used and whether all services required were received•
Attitudes towards any assessments that had been carried out•
Transparency of any decisions made•
Participation in the decision making process•
Quality of information received•
Any other comments3 Fieldwork
The survey was conducted using two postal self completion questionnaires. For both questionnaires respondents have the option of completing the survey online or via telephone in English or in one of eight community languages. The languages offered to respondents were Hindi, Bengali, Polish, Arabic, Punjabi, Urdu, Gujarati and Somali.
Stage One – Screening Survey
A short four page screener questionnaire was sent to households and used to identify households potentially eligible to complete the indicator survey. The
households included in the screening survey were identified from the National Pupil Database6 which holds details of all school-aged children and includes details of
whether they have a special educational need (these households were over-sampled compared with other households). Fieldwork for the screener survey for the first wave took place between 20th January 2009 and 26th February 2009. Overall
101,328 screener surveys were returned constituting a response rate of 28% at the screener stage.
Stage Two – The indicator survey
Households identified through the screener survey as having one or more children with a disability or health problem were invited to take part in the indicator survey. Fieldwork for the first indicator survey took place between 16th March 2009 and 20th April 2009. There were 12,241 indicator surveys returned by eligible parents, a response rate of 54%.
Screener mailings
The screener survey was based on a three stage mailing strategy. The first mailing consisted of a letter explaining the survey, the screener questionnaire and a pre paid reply envelope. The second mailing to non responding households was identical to the first mailing but the content of the covering letter was amended slightly. The final mailing was a letter reminding respondents to complete and return the screener questionnaire.
6The eligibility criterion for the survey is defined as disabled children aged 0-19. The NPD excludes
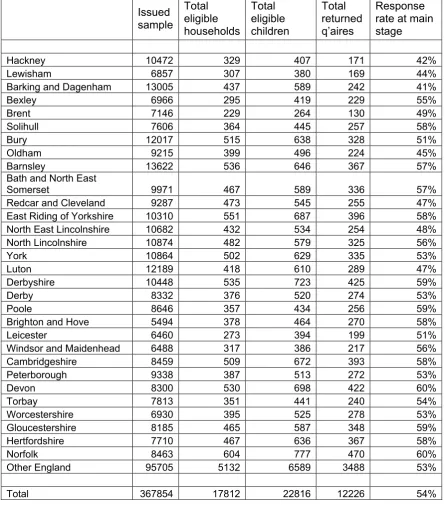
3.1 Main stage mailings
Like the screener survey the main stage survey was also based on a three stage mailing strategy. Respondents were initially sent the 20 page questionnaire
accompanied by a covering letter and reply paid envelope. Households where two or more eligible children were identified in the screener survey were sent two copies of the questionnaire to complete. The child’s name was printed on the front of the questionnaire to enable each survey to be linked back to the information collected at the screener survey. The covering letters were tailored for these households to explain the inclusion of two questionnaires and in cases where there were more than two eligible children to explain how to complete more surveys if they wanted to do so.
Table 3.1 Achieved sample by local area Issued sample Total eligible households Total eligible children Total returned q’aires Response rate at main stage
Hackney 10472 329 407 171 42%
Lewisham 6857 307 380 169 44%
Barking and Dagenham 13005 437 589 242 41%
Bexley 6966 295 419 229 55%
Brent 7146 229 264 130 49%
Solihull 7606 364 445 257 58%
Bury 12017 515 638 328 51%
Oldham 9215 399 496 224 45%
Barnsley 13622 536 646 367 57%
Bath and North East
Somerset 9971 467 589 336 57%
Redcar and Cleveland 9287 473 545 255 47%
East Riding of Yorkshire 10310 551 687 396 58%
North East Lincolnshire 10682 432 534 254 48%
North Lincolnshire 10874 482 579 325 56%
York 10864 502 629 335 53%
Luton 12189 418 610 289 47%
Derbyshire 10448 535 723 425 59%
Derby 8332 376 520 274 53%
Poole 8646 357 434 256 59%
Brighton and Hove 5494 378 464 270 58%
Leicester 6460 273 394 199 51%
Windsor and Maidenhead 6488 317 386 217 56%
Cambridgeshire 8459 509 672 393 58%
Peterborough 9338 387 513 272 53%
Devon 8300 530 698 422 60%
Torbay 7813 351 441 240 54%
Worcestershire 6930 395 525 278 53%
Gloucestershire 8185 465 587 348 59%
Hertfordshire 7710 467 636 367 58%
Norfolk 8463 604 777 470 60%
Other England 95705 5132 6589 3488 53%
3.2 Alternative methods of completing the survey
The survey was offered to parents in various languages at both the screening and the main stage in order to reach a wide range of parents with disabled children.
Respondents were able to complete the survey in a number of different ways; by post, by telephone or via the internet. A survey helpline was available where
respondents could direct any queries they had about the survey and where they also had the option to complete the survey with an interviewer over the telephone. Alternatively a website was set up where respondents could complete the survey online. These options were offered to respondents in English and in eight community languages to encourage participation of people from minority ethnic backgrounds. The languages available were: Polish, Urdu, Punjabi, Arabic, Somali, Bengali, Hindi and Gujarati.
Overall 946 surveys were completed online at the screener stage and 25 were completed online at the main stage. At the screener stage no households were identified who were both eligible for the main survey and willing to be recontacted who had completed the survey in another language, with the exception of Polish and Arabic. Therefore the main survey was only translated into these languages.
Table 3.2 Number of surveys completed online or via telephone
Language Number of surveys completed online
Number of surveys completed by telephone
Screener
English 778 150
Polish 145 2
Urdu 1 3
Punjabi 0 0
Arabic 12 7
Somali 5 0
Bengali 2 0
Hindi 0 0
Gujarati 3 0
Total 946 162
Main Indicator survey
English 25 1
Polish 0 0
4 Sampling
This chapter outlines the sampling approach employed for the survey with some contextual information regarding the rationale for the final approach employed. The sample was drawn from the National Pupil Database (NPD) provided to TNS-BMRB by DCSF. The NPD holds information at the child level but the data was aggregated to a household level to ensure that only one child per household was selected for the screening stage of the survey. Letters were then addressed to the ‘parents of child x’ requesting the information required for screening. Parents were requested to complete information for ALL children not just the named child. In this way information was collected for children included on the NPD and all their siblings (regardless of whether or not they were registered on the NPD). Thus details were collected for children under school age and those past school leaving age. A more detailed explanation of the sample design and rationale is included in section 4.1.
4.1 Target population and sampling frames
The original intention was to generate estimates from a representative sample of households in England (with a target of 200 survey responses to be achieved within each local area) that contained at least one individual aged 0-19 (inclusive) who fulfilled the disability conditions outlined in the Disability Discrimination Act. In the first year of the survey (2008-09) only 30 local areas were to be covered by the survey with an additional national sample included to allow an indicator score to be calculated at the national level.
The original proposed sample design was to utilise three databases: (1) the Child Benefit register,
(2) the National Pupil Database (restricted to those children with special educational needs), and
(3) the Disability Living Allowance register.
It was expected that this combination would provide near 100% coverage of the target population (through the use of the Child Benefit register as a ‘backbone’ sampling frame) as well as relative cost efficiency by employing higher sampling fractions with the NPD-SEN and DLA registers (where survey eligibility was expected to be substantially greater than average).
1: children with no special educational needs 2: children assigned to the ‘School Action’ category 3: children assigned to the ‘School Action Plus’ category 4: children with a statement of special educational needs 5: children attending a special school (NTS categories 26-29)
The drawback to sole use of the NPD is that elements of the target population are only partially covered. Contact details are held for children attending state schools only which means that a number of groups are excluded, primarily children under the age of 5 or over the age of 16 and children attending an independent school. In addition using only the NPD database meant that the screening exercise was of a much larger scale than originally intended.
Although the NPD is presented on a one-case-per-child basis, the target sampling unit is the household with one parent acting as spokesperson. The design called for letters to the ‘parent(s)/guardian(s) of x’ – with x the sampled child – but parents are asked to provide details about all dependent individuals aged 0-19 resident in the household. Consequently, households are only excluded if no individuals are listed on the NPD (for example if ALL children in the household are under school age) . The extent of non-coverage is difficult to assess since few other surveys collect all the relevant details for each child in sampled households. However, TNS-BMRB estimate that around half of households containing children under the age of 5 would be excluded.
How far this level of non-coverage biases the survey estimates is unknown. Nevertheless, so long as (a) the conditions for being listed on the NPD remain the same, and (b) the broad distribution of household types remains stable, the level of non-coverage bias should hold steady across future waves of this survey.
Consequently, any significant changes in performance indicator scores ought to reflect real change in performance rather than issues with the sample frame.
4.2 Sampling procedure
The sampling procedure was conducted in two stages. Firstly the child-level NPD was converted to household level file based on matching address fields. A number of household level aggregate variables were then produced to add to each record for stratification purposes.
Stage 1: Conversion from child-level to household-level database
DCSF converted the child-level NPD into a pseudo household-level database by identifying cases with exactly matching addresses7.
Once linked cases were identified, a small number of ‘aggregate’ variables were derived and the values attached to each linked case:
• The highest ‘special educational needs’ score among children in the household, ranging from 5 (attends a special school) to 1 (has no special educational needs)
• Whether any child in the household is recorded as eligible for free school meals
• The mean age of the children in the household
• Number of children in the household
This allowed DCSF to create a household-level database by deleting ‘duplicates’ because the key household-level data required for stratification was attached to all cases.
Despite the imperfect nature of this conversion from a child-level to a household-level database, the number of cases was reduced substantially, from c. 7.4 million to 5,322,822.
Nevertheless, those households that are erroneously listed more than once on the reduced database will have a higher than desired sampling probability. This effect is partly a function of household size. The more children listed on the NPD the less likely it is that complete linkage will be achieved. This is especially likely if the children attend different schools.
An effort needs to be made to correct for this imbalance although it must be acknowledged that no method will be perfect.
TNS-BMRB suggested collecting data from each participating household about each resident child so that the number of children listed on the NPD could be estimated for each household. This could be compared with the number of children contributing data at the sampling stage and a correction weight applied.
7 It was expected that this procedure would identify only a proportion of cases
resident in the same household because the same address can be recorded in many subtly different ways. However, the NPD is too large to check cases manually and, in this instance, the timetable did not allow for anything beyond this simple
The feasibility study recommended that the sampling strategy should be based on a number of assumptions. However TNS-BMRB felt that the field assumptions in the feasibility study report were over-optimistic, especially as they had not been tested in any way. In order to guard against under-delivery, it was assumed that:
• 6% of sampled households would explicitly opt-out of the survey
• 30% of the remainder would complete the survey qualification questionnaire
• 60% of those qualifying for the survey would complete the main questionnaire This leads to a 17% total conversion rate even among those eligible for the survey. It was expected that eligible households would complete the survey qualification questionnaire at a higher rate than would non-eligible households. Consequently, the eligibility rates derived from the survey qualification questionnaire ought to be higher than would be expected from the general population. However, the magnitude of this effect was entirely unknown so TNS-BMRB did not adjust the eligibility rates from those provided in the feasibility study report.
Stage 2: Stratification of the household-level NPD
TNS-BMRB assigned cases to one of 930 formal strata each comprised of the dimensions below:
• 31 ‘local authority’ strata, comprising 30 key local authorities plus one stratum covering the rest of England;
• 5 ‘SEN’ strata within each ‘local authority’ stratum, based on the highest ‘special educational needs’ score among children in the household
• 6 ‘average age’ strata within each ‘local authority-SEN’ stratum (<7, ≥7<9, ≥9<11, ≥11<13, ≥13<15, ≥15)
An extra level of implicit stratification was to sort cases by ‘free school meals’ status before drawing the sample. This ensured there was no risk of disproportionate sampling among those receiving or not receiving free school meals. TNS-BMRB used the ‘complex samples’ module within the software package SPSS 16.2 to draw the sample.
The household-level NPD was then sorted using the variables described above but specified precise sample targets only for the first two stratification levels (155 strata in total). Cases within each of these strata were sampled proportionately but the sampling fraction itself was allowed to vary between the 155 major strata.
The sample targets were computed based on (a) broad sampling fractions for each of the 5 ‘SEN’ strata, and (b) a scaling factor to ensure an expected total of 200
An additional restriction was to set a cap in which a maximum of 63.5% of cases in any one stratum may be sampled. This was to ensure a pool of cases to draw upon for the 2009-10 and 2010-11 surveys. The logic is as follows:
• 200 completed questionnaires from 2009
• Assume 140 (70%) also complete questionnaires in 2010
• Require 60 completed questionnaires from new cases in 2010 to make 200 total
• Assume 145 (72.5%) also complete questionnaires in 2011 (103/140 from the 2009 sample and 42/60 from the 2010 sample)
• Require 55 completed questionnaires from new cases in 2011 to make 200 total
• Total co-operating cases across 2009,10,11 = 200 + 60 + 55 = 315
• 2009 maximum sample = 200/315 = 63.5% of total pool
This assumes no new cases are added to the population in 2010 and 2011, which is unlikely to be the case, and is therefore conservative.
Where caps produced expected totals short of target (200 in each of the 30 target local authorities and 2,000 in the rest of England), additional cases were sourced by prioritising those in the highest ‘SEN’ strata and moving downwards as cap limits were reached.
The overall objective was to maximise fieldwork efficiency while controlling the degree of disproportionate sampling so that the expected effective sample size was at least 150 per local authority.
In order to estimate the degree of disproportionate sampling, TNS-BMRB needed to make assumptions about the survey eligibility rate for households in each of the 5 ‘SEN’ strata. As noted above, it was expected that eligible households would respond to the survey qualification questionnaire at a higher rate than non-eligible households. However, it was decided not to adjust assumed eligibility rates upwards because there was no evidence of the likely magnitude of this effect.
The feasibility study report contained two relevant statements:
(1) Around 10% of households listed on the CB register contain at least one child who would qualify as disabled under the DDA definition.
(2) Around 30% of children with ‘special educational needs’ (attends special school or does not attend special school but has a statement of SEN or is assigned to ‘School Action Plus’) would qualify as disabled under the DDA definition.
increase from 30% to 40% was intended to reflect the degree of compression from a child-level file to a household level file.
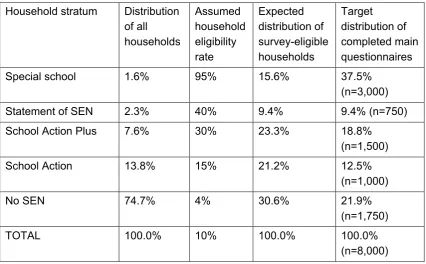
Table 4.1 shows the final eligibility assumptions for each of the five ‘SEN’ strata, together with the overall target distribution of completed main questionnaires. Specific targets were set to (a) maximise the general conversion rate (the number of completed questionnaires expressed as a proportion of the number of sampled cases) while (b) ensuring that the general design effect due to disproportionate sampling was less than 1.308. The design effect is used to calculate the effective
sample size (by dividing the actual sample size by the design effect). The effective sample size is used for statistical tests and takes into account the fact that a complex sample design was employed rather than a simple random design.
[image:19.595.90.517.320.584.2]The targets were rounded to the nearest 250. Table 4.1: Initial sample assumptions
Household stratum Distribution of all households
Assumed household eligibility rate
Expected distribution of survey-eligible households
Target
distribution of completed main questionnaires
Special school 1.6% 95% 15.6% 37.5%
(n=3,000)
Statement of SEN 2.3% 40% 9.4% 9.4% (n=750)
School Action Plus 7.6% 30% 23.3% 18.8%
(n=1,500)
School Action 13.8% 15% 21.2% 12.5%
(n=1,000)
No SEN 74.7% 4% 30.6% 21.9%
(n=1,750)
TOTAL 100.0% 10% 100.0% 100.0%
(n=8,000)
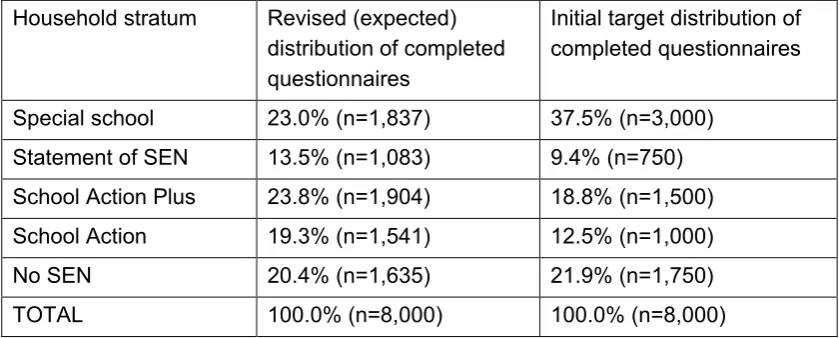
However, combinations of population limits and cap limits necessitated compromise distributions at the local authority level. The main effect was to limit the sample size in the ‘special school’ stratum so that, overall, only 23% of completed questionnaires were expected from this stratum instead of 37.5%.
one local authority was 1.26 with an unweighted average of 1.11. In eleven of the thirty key local authorities all available cases (up to a maximum of 63.5% per
[image:20.595.89.509.164.333.2]stratum) were sampled. Consequently, the sampling design effect was 1.00 in these areas.
Table 4.2: Revised vs initial target distributions of completed questionnaires
Household stratum Revised (expected) distribution of completed questionnaires
Initial target distribution of completed questionnaires
Special school 23.0% (n=1,837) 37.5% (n=3,000) Statement of SEN 13.5% (n=1,083) 9.4% (n=750) School Action Plus 23.8% (n=1,904) 18.8% (n=1,500) School Action 19.3% (n=1,541) 12.5% (n=1,000)
No SEN 20.4% (n=1,635) 21.9% (n=1,750)
TOTAL 100.0% (n=8,000) 100.0% (n=8,000)
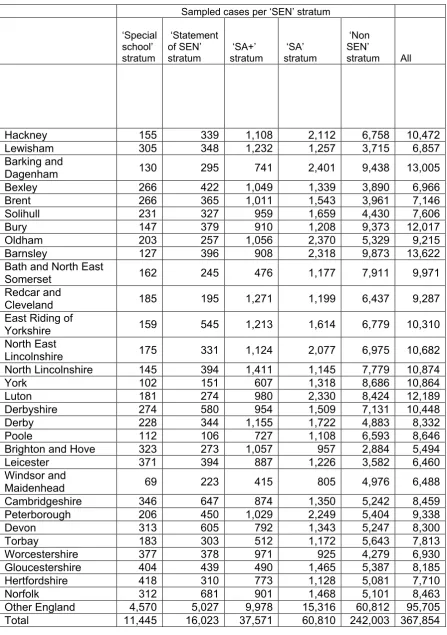
Table 4.3: Final sampling matrix
Sampled cases per ‘SEN’ stratum
‘Special school’ stratum ‘Statement of SEN’
stratum ‘SA+’ stratum ‘SA’ stratum
‘Non SEN’
stratum All
Hackney 155 339 1,108 2,112 6,758 10,472
Lewisham 305 348 1,232 1,257 3,715 6,857
Barking and
Dagenham 130 295 741 2,401 9,438 13,005
Bexley 266 422 1,049 1,339 3,890 6,966
Brent 266 365 1,011 1,543 3,961 7,146
Solihull 231 327 959 1,659 4,430 7,606
Bury 147 379 910 1,208 9,373 12,017
Oldham 203 257 1,056 2,370 5,329 9,215
Barnsley 127 396 908 2,318 9,873 13,622
Bath and North East
Somerset 162 245 476 1,177 7,911 9,971
Redcar and
Cleveland 185 195 1,271 1,199 6,437 9,287
East Riding of
Yorkshire 159 545 1,213 1,614 6,779 10,310
North East
Lincolnshire 175 331 1,124 2,077 6,975 10,682 North Lincolnshire 145 394 1,411 1,145 7,779 10,874
York 102 151 607 1,318 8,686 10,864
Luton 181 274 980 2,330 8,424 12,189
Derbyshire 274 580 954 1,509 7,131 10,448
Derby 228 344 1,155 1,722 4,883 8,332
Poole 112 106 727 1,108 6,593 8,646
Brighton and Hove 323 273 1,057 957 2,884 5,494
Leicester 371 394 887 1,226 3,582 6,460
Windsor and
Maidenhead 69 223 415 805 4,976 6,488
Cambridgeshire 346 647 874 1,350 5,242 8,459
Peterborough 206 450 1,029 2,249 5,404 9,338
Devon 313 605 792 1,343 5,247 8,300
Torbay 183 303 512 1,172 5,643 7,813
Worcestershire 377 378 971 925 4,279 6,930
Gloucestershire 404 439 490 1,465 5,387 8,185
Hertfordshire 418 310 773 1,128 5,081 7,710
Norfolk 312 681 901 1,468 5,101 8,463
4.3 Actual Outcomes
Table 4.4: Screening stage returned questionnaires
Returned cases per ‘SEN’ stratum
All ‘Special school’ stratum ‘Statement of SEN’
stratum ‘SA+’ stratum ‘SA’ stratum
‘Non SEN’ stratum
Hackney 32 64 214 370 1,469 2,149
Lewisham 69 64 233 240 923 1,529
Barking and
Dagenham 38 64 174 487 2,282 3,045
Bexley 70 89 220 324 1,151 1,854
Brent 42 74 162 252 811 1,341
Solihull 68 93 184 396 1,228 1,969
Bury 46 101 200 275 2,670 3,292
Oldham 42 68 192 464 1,343 2,109
Barnsley 26 94 205 560 3,001 3,886
Bath and North East
Somerset 45 80 120 297 2,618 3,160
Redcar and
Cleveland 71 52 285 260 1,969 2,637
East Riding of
Yorkshire 53 171 323 445 2,461 3,453
North East
Lincolnshire 45 91 206 453 1,955 2,750
North Lincolnshire 37 100 321 255 2,442 3,155
York 37 45 155 357 3,221 3,815
Luton 50 67 214 492 2,143 2,966
Derbyshire 70 163 234 382 2,376 3,225
Derby 74 76 227 315 1,298 1,990
Poole 35 32 147 237 1,888 2,339
Brighton and Hove 81 75 261 227 951 1,595
Leicester 85 90 170 237 862 1,444
Windsor and
Maidenhead 22 62 108 194 1,556 1,942
Cambridgeshire 103 170 206 338 1,757 2,574
Peterborough 51 103 199 438 1,331 2,122
Devon 85 189 215 345 1,750 2,584
Torbay 35 64 101 256 1,574 2,030
Worcestershire 92 100 238 217 1,281 1,928
Gloucestershire 106 114 112 342 1,825 2,499
Hertfordshire 115 102 212 301 1,856 2,586
Norfolk 114 203 249 429 1,839 2,834
Other England 1,323 1,362 2,156 3,427 18,302 26,570
Total 3,162 4,222 8,243 13,612 72,133 101,372
As expected, the survey eligibility9 rates varied from stratum to stratum. However,
the differences between the strata were less marked than anticipated, ranging from 64% of responding households in the ‘special school’ stratum to 11% of responding households in the ‘non SEN’ stratum. The overall eligibility rate was 18%, well above the expected rate of 10%. This suggests either some methodological discontinuity between the definitions of disability used to design the survey or a higher response rate from those who proved survey eligible. This last explanation is the more likely but a combination of the two cannot be ruled out.
[image:24.595.91.505.243.458.2]The results for each stratum are shown in Table 4.5. Table 4.5: Eligibility rates among responding households
All
‘Special school’ stratum
‘Statement of SEN’ stratum
‘SA+’ stratum
‘SA’ stratum
‘Non SEN’ stratum
Actual 18% 64% 59% 35% 19% 11%
Expected 10% 95% 40% 30% 15% 4%
In total, 17,812 households were deemed survey eligible.
A separate main stage questionnaire was printed for each child identified as survey eligible up to a maximum of 2 per household. In total, 22,816 were printed, an average of 1.28 per survey eligible household. The average number per household only varied slightly between strata.
Table 4.6 shows the number of completed questionnaires for each cell in the sampling matrix. In total, 12,226 were completed, well above the target of 8,000. The overall return rate was 54%, slightly short of the expected return rate of 60%. This return rate varied between strata, despite all issued cases qualifying for the survey. The return rate was over 60% for those in the first two strata (‘special school’ and ‘statement of SEN’) but closer to 50% for those in the next three.
Table 4.6: Final stage returned questionnaires
Achieved cases (Final stage) per ‘SEN’ stratum
‘Special school’ stratum ‘Statement of SEN’
stratum ‘SA+’ stratum ‘SA’ stratum ‘Non SEN’ stratum Total
Hackney 13 21 37 27 73 171
Lewisham 23 17 49 25 55 169
Barking and
Dagenham 17 25 39 43 118 242
Bexley 28 40 63 43 55 229
Brent 17 23 33 16 41 130
Solihull 38 35 37 58 89 257
Bury 27 46 39 32 184 328
Oldham 11 35 46 51 81 224
Barnsley 16 38 58 74 181 367
Bath and Nort East
Somerset 25 40 31 50 190 336
Redcar and
Cleveland 32 19 57 29 118 255
East Riding of
Yorkshire 29 98 76 42 151 396
North East
Lincolnshire 21 45 33 50 105 254
North Lincolnshire 22 31 75 37 160 325
York 28 23 39 47 198 335
Luton 18 33 53 58 127 289
Derbyshire 42 87 47 50 199 425
Derby 37 38 67 29 103 274
Poole 17 16 48 34 141 256
Brighton and Hove 42 35 81 31 81 270
Leicester 38 35 41 27 58 199
Windsor and
Maidenhead 11 37 30 24 115 217
Cambridgeshire 51 75 62 53 152 393
Peterborough 31 52 42 46 101 272
Devon 50 118 79 51 124 422
Torbay 18 23 33 36 130 240
Worcestershire 51 43 56 27 101 278
Gloucestershire 55 58 43 52 140 348
Hertfordshire 63 61 64 47 132 367
Norfolk 64 91 77 61 177 470
Other England 698 623 514 454 1,199 3,488
Total 1,633 1,961 2,049 1,704 4,879 12,226
Table 4.7 shows how the final returned questionnaires were distributed between the strata against expectations. The actual distribution did not match the expected distribution because the expected eligibility rates were very different from the observed eligibility rates.
Table 4.7: Distribution of final stage returned questionnaires between strata ‘Special
school’ stratum
‘Statement of SEN’ stratum
‘SA+’ stratum
‘SA’ stratum
‘Non SEN’ stratum
Actual 13% 16% 17% 14% 40%
Expected 23% 14% 24% 19% 20%
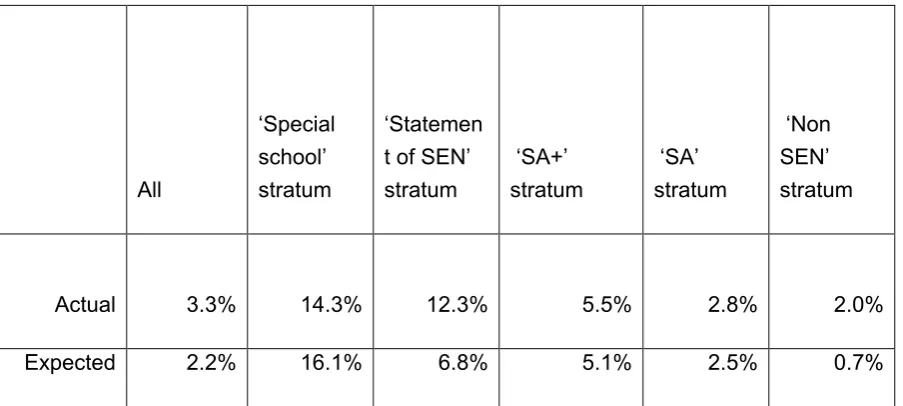
[image:26.595.92.544.410.613.2]The overall conversion rate (expressed as the number of completed final stage questionnaires as a proportion of sampled households) was 3.3%, significantly higher than the original expectation of 2.2%.
Table 4.8: Overall conversion rates
All
‘Special school’ stratum
‘Statemen t of SEN’ stratum
‘SA+’ stratum
‘SA’ stratum
‘Non SEN’ stratum
Actual 3.3% 14.3% 12.3% 5.5% 2.8% 2.0%
Expected 2.2% 16.1% 6.8% 5.1% 2.5% 0.7%
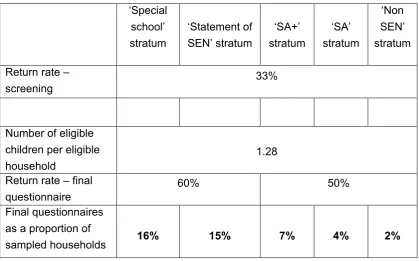
These results allow us to update our basic assumptions. If we assume that all questionnaires are processed (and consequently increase the screening
Table 4.9: Expected conversion rates to use in future waves of research ‘Special
school’ stratum
‘Statement of SEN’ stratum
‘SA+’ stratum
‘SA’ stratum
‘Non SEN’ stratum
Return rate –
screening 33%
Number of eligible children per eligible
household 1.28
Return rate – final
questionnaire 60% 50%
Final questionnaires as a proportion of
sampled households 16% 15% 7% 4% 2%
In subsequent waves of the research, the sample will be made up in part from a panel consisting of previous respondents (who will each be re-contacted for two further annual waves) and a top-up using the original sample sources. This will maximise the efficiency of the sample by allowing us to identify in advance families which are already known to have a disabled child.
4.4 Weighting
The final weights correct for (a) imbalances in sampling probability, and (b) imbalances in response propensity. The result of stage (a) is called the design weight and is used as the base for correcting any remaining differential non-response.
There are three elements to the design weight:
1) The sampling probability of the ‘household’
The sampling frame (the NPD) is a child-level file but the screener
In an attempt to account for the child>household transformation errors, the main stage questionnaire includes a question asking for the number of children in the household that are likely to be listed on the NPD. This data is used to adjust the basic design weight.
3) An adjustment to account for the maximum limit of 2 main stage questionnaires per household
A maximum of two main stage (child-level) questionnaires were sent to each household but there were a small number of cases where more than two children were eligible. In these cases, a random sample of two was selected which means that the sampling probability of each child is lower than in households where all eligible children were included.
The final design weight is computed as:
1/(na/Na*((Qax-Cax)/Cax)*(QSax/ECax))
na = number of households sampled in stratum a
Na = number of households in stratum a
Qax = number of eligible children in household x in stratum a according to
questionnaire (must be equal or higher than Cax; if lower then Qax = Cax for this
purpose)
Cax = number of eligible children in household x in stratum a according to sample
frame
QSax = number of child-level main stage questionnaires sent to household x in
stratum a
ECax = number of eligible children in household x in stratum a
Once this design weight was computed it was applied to the data file and the
distribution of several sample frame variables was compared with a design-weighted data file that includes both respondents and non-respondents to the main stage questionnaire10.
10This was used as a proxy for the target population. The target population cannot be well estimated
Where differences were observed, the design weight was adjusted to account for non-response. The selected variables were:
• the proportion of children resident in FSM-eligible households
• the proportion of children resident in households containing at least one non-white child
These adjustments were made separately for each local authority using a rim
weighting technique11 and then the local authorities themselves were scaled to match
the design-weighted distribution found in the data file that includes both respondents and non-respondents to the main stage questionnaire.
11 TNS-BMRB set a minimum of 30 completed questionnaires for both cells in a pair. If this sample
5
The 2009-10 Indicator survey (Year 2)
As mentioned previously the methodology for the year 2 survey was largely kept consistent with the year 1 survey to ensure consistency between the two survey years.
The most significant change to survey method between years 1 and 2 was the inclusion of all local areas in the second year of the survey rather than just the 30 areas covered by the first survey. As was the case in the 2008-09 survey
households were first screened to establish eligibility before being asked to
participate in the main survey. In the 30 areas included in the first survey the need for screening was reduced as a panel element was introduced in the second survey. Thus all households who participated in the first survey were invited to participate again in the second survey.
Further details of the differences between the two surveys and the survey design for year 2 are outlined throughout this chapter.
5.1 Stage 1 - The screener questionnaire
The content of the screener questionnaire remained unchanged between the two survey years with the exception of an addition of a question to collect the
respondents’ e mail address. This was added to allow the possibility of contacting respondents via e mail to encourage response at stage 2.
Screener fieldwork for the 2009-10 survey took place between 13th July 2009 and
11th September 2009. Overall 722,495 screener surveys were mailed for wave 2 and
187,190 were returned, a response rate of 26% (compared with 28% achieved in 2008-09).
5.2 Stage 2 – The indicator survey
The majority of the content of the indicator survey remained unchanged between the first and second surveys. Changes made to the questionnaire are outlined below
• Special Educational needs provision – the questions included in the first survey (Q30 and Q31) did not allow respondents with no statement of SEN to record any special educational needs provision. This was amended in year 2 to combine the two questions into one overall question.
• In the second survey all references to ‘social care/family support services’ were changed to ‘care and family support services’.
in the last 12 months. In the second survey this was changed to include all parents.
• In the second survey an additional open ended question was added to the end of the questionnaire to enable parents to record any other comments they wished to make.
• The appearance of the questionnaire differed between the two surveys (in colour and images used) to ensure that those invited to participate in both the first and second surveys could clearly see that it was a different survey.
Fieldwork for the 2009-10 Indicator survey took place between 1st September and 6th November. 2009. Overall 56,332 questionnaires were mailed and 31,466 questionnaires were returned representing a response rate of 56% (compared with 54% achieved in 2008-09).
In the second survey the final mailing was changed to a full pack reminder as
response was slightly lower than anticipated at that stage. At the time fieldwork was taking place a postal strike was in effect and therefore e mail reminders were also sent (where e mail addresses were available) to encourage people to respond.
Sample and response
The sample for the second survey consisted of a ‘panel sample’ comprised of parents who had taken part in the first survey and a ‘fresh sample’ drawn from the national pupil database. The fresh sample was necessary to cover the local areas not targeted in the first survey and to provide additional sample in those areas that were included but where sample was not sufficient to achieve 200 completed surveys in the area in the second survey.
Table 5.1 Achieved sample by local area Local Area Issued sample Total eligible households Total eligible children from fresh sample Total returned q’aires (fresh sample) Issued Panel sample Returned panel sample Total Issued sample Total achieved sample
Darlington 5798 237 280 156 9 7 289 163
Durham 4351 271 329 208 37 16 366 224
Gateshead 4813 265 310 180 17 15 327 195
Hartlepool 5530 184 221 111 7 5 228 116
Middlesbrough 4723 232 286 174 26 17 312 191
Newcastle Upon
Tyne 4534 233 277 183 26 17 303 200
North Tyneside 4509 275 324 187 20 11 344 198
Northumberland 4445 257 311 188 27 14 338 202
Redcar and
Cleveland 824 45 54 33 255 136 309 169
South Tyneside 4946 240 274 152 7 4 281 156
Stockton-On-Tees 4623 256 303 178 14 9 317 187
Sunderland 4639 247 287 178 13 8 300 186
Blackburn with
Darwen 4778 222 282 148 13 4 295 152
Blackpool 5719 273 320 155 8 4 328 159
Bolton 4513 204 239 135 20 13 259 148
Bury 254 10 13 10 328 174 341 184
Cheshire 8980 529 617 384 44 31 661 415
Cumbria 4455 248 295 167 38 26 333 193
Halton 5334 195 228 136 8 5 236 141
Local Area Issued sample Total eligible households Total eligible children from fresh sample Total returned q’aires (fresh sample) Issued Panel sample Returned panel sample Total Issued sample Total achieved sample
Liverpool 4777 210 252 121 25 15 277 136
Manchester 4724 236 283 163 48 34 331 197
Oldham 1695 69 88 40 224 109 312 149
Rochdale 4341 225 270 151 27 17 297 168
Salford 4507 191 228 131 23 12 251 143
Sefton 4657 312 372 194 16 10 388 204
St Helens 5161 223 259 151 10 3 269 154
Stockport 4350 262 307 182 27 18 334 200
Tameside 4454 193 238 132 25 13 263 145
Trafford 4691 294 347 193 18 8 365 201
Warrington 4574 249 282 172 13 7 295 179
Wigan 4355 221 258 150 25 21 283 171
Wirral 4030 258 314 195 25 20 339 215
Barnsley 258 8 9 6 367 218 376 224
Bradford 4789 218 271 146 31 17 302 163
Calderdale 4681 249 298 182 17 6 315 188
Doncaster 4848 233 277 151 28 23 305 174
East Riding of
Yorkshire 90 9 10 7 396 240 406 247
Kingston Upon
Hull, City of 4352 235 277 155 33 16 310 171
Kirklees 4705 248 309 175 33 15 342 190
Leeds 4462 239 283 172 50 33 333 205
North East
Lincolnshire 796 45 54 29 254 158 308 187
Local Area Issued sample Total eligible households Total eligible children from fresh sample Total returned q’aires (fresh sample) Issued Panel sample Returned panel sample Total Issued sample Total achieved sample
North Yorkshire 4255 285 334 198 88 54 422 252
Rotherham 4387 285 347 199 23 15 370 214
Sheffield 4027 328 392 221 44 27 436 248
Wakefield 4680 268 322 183 27 20 349 203
York 44 0 0 0 335 203 335 203
Derby 426 13 16 6 274 147 290 153
Derbyshire 214 11 13 8 425 258 438 266
Leicester 1689 74 86 44 199 116 285 160
Leicestershire 4571 296 360 200 51 29 411 229
Lincolnshire 3745 265 327 182 85 55 412 237
Northamptonshire 4024 253 301 185 66 32 367 217
Nottingham 5079 216 261 138 13 4 274 142
Nottinghamshire 11035 568 672 409 57 32 729 441
Rutland 1504 70 82 52 4 3 86 55
Birmingham 11900 569 713 395 113 75 826 470
Coventry 4265 232 277 167 20 12 297 179
Dudley 4548 274 338 183 15 8 353 191
Herefordshire 4720 314 384 219 18 15 402 234
Sandwell 5367 223 276 139 10 7 286 146
Shropshire 4378 289 351 200 14 10 365 210
Solihull 1163 60 67 36 257 144 324 180
Staffordshire 8729 467 555 342 70 45 625 387
Stoke-On-Trent 4165 220 274 153 18 8 292 161
Telford and
Wrekin 4209 284 348 190 18 8 366 198
Local Area Issued sample Total eligible households Total eligible children from fresh sample Total returned q’aires (fresh sample) Issued Panel sample Returned panel sample Total Issued sample Total achieved sample
Wolverhampton 4555 217 267 139 21 13 288 152
Worcestershire 548 24 29 20 278 181 307 201
Bedfordshire 8967 537 638 359 54 29 692 388
Cambridgeshire 123 7 9 3 393 251 402 254
Essex 14601 969 1181 662 120 73 1301 735
Hertfordshire 4281 280 338 183 367 225 705 408
Luton 391 12 15 5 289 171 304 176
Norfolk 1187 77 93 56 470 283 563 339
Peterborough 488 24 30 12 272 151 302 163
Southend-on-Sea 3961 229 270 159 15 10 285 169
Suffolk 6415 459 557 322 66 40 623 362
Thurrock 4756 233 273 165 12 5 285 170
Camden 7835 221 264 132 5 4 269 136
City Of London 100 4 4 3 4 3
Hackney 6348 177 224 91 171 78 395 169
Hammersmith
and Fulham 5999 165 189 101 5 1 194 102
Haringey 7413 310 368 170 16 7 384 177
Islington 8271 277 334 154 20 14 354 168
Kensington and
Chelsea 3675 101 118 63 4 1 122 64
Lambeth 7766 341 405 178 12 3 417 181
Lewisham 5711 239 290 127 169 84 459 211
Newham 8166 263 329 145 15 7 344 152
Southwark 6749 310 377 168 25 13 402 181
Tower Hamlets 6405 171 215 122 14 6 229 128
Local Area Issued sample Total eligible households Total eligible children from fresh sample Total returned q’aires (fresh sample) Issued Panel sample Returned panel sample Total Issued sample Total achieved sample
Westminster 6630 150 185 78 8 3 193 81
Barking and
Dagenham 4601 166 215 92 242 122 457 214
Barnet 6999 333 404 208 35 24 439 232
Bexley 4518 218 278 141 229 129 507 270
Brent 7082 222 257 111 130 68 387 179
Bromley 6831 441 538 302 28 12 566 314
Croydon 7840 352 430 222 16 9 446 231
Ealing 7897 319 382 191 14 9 396 200
Enfield 7505 328 398 191 28 18 426 209
Greenwich 6297 282 340 172 54 25 394 197
Harrow 8215 304 374 188 11 7 385 195
Havering 8980 378 447 227 23 10 470 237
Hillingdon 7029 351 428 230 20 11 448 241
Hounslow 7549 303 383 189 6 5 389 194
Kingston Upon
Thames 7476 327 375 226 12 6 387 232
Merton 9100 346 411 204 6 6 417 210
Redbridge 7299 301 365 177 24 13 389 190
Richmond Upon
Thames 7709 336 395 213 13 7 408 220
Sutton 6923 337 418 232 15 11 433 243
Waltham Forest 6468 245 303 165 21 16 324 181
Bracknell Forest 5191 279 341 185 16 6 357 191
Brighton and
Local Area Issued sample Total eligible households Total eligible children from fresh sample Total returned q’aires (fresh sample) Issued Panel sample Returned panel sample Total Issued sample Total achieved sample
East Sussex 8536 601 718 412 34 22 752 434
Hampshire 3998 298 349 203 94 62 443 265
Isle Of Wight 5943 368 460 236 17 8 477 244
Kent 7473 519 627 347 134 87 761 434
Medway Towns 4229 286 361 203 30 12 391 215
Milton Keynes 4348 243 295 170 25 19 320 189
Oxfordshire 4470 317 379 213 36 15 415 228
Portsmouth 4234 259 313 178 17 12 330 190
Reading 6158 309 379 171 5 2 384 173
Slough 4286 172 202 100 12 7 214 107
Southampton 4936 253 319 180 6 5 325 185
Surrey 4575 295 341 191 91 51 432 242
West Berkshire 4012 237 276 166 10 9 286 175
West Sussex 3505 253 304 161 83 58 387 219
Windsor and
Maidenhead 1034 54 68 45 217 136 285 181
Wokingham 5233 295 357 195 10 6 367 201
Bath and North
East Somerset 45 6 7 4 336 203 343 207
Bournemouth 4926 279 334 167 29 17 363 184
Bristol, City of 4765 330 392 220 41 19 433 239
Cornwall 4420 317 378 208 28 17 406 225
Devon 269 25 32 15 422 267 454 282
Dorset 4003 296 341 196 77 52 418 248
Gloucestershire 103 6 7 5 348 212 355 217
Isles Of Scilly 87 7 9 7 9 7
Local Area
Issued sample
Total eligible households
Total eligible children from fresh sample
Total returned q’aires (fresh sample)
Issued Panel sample
Returned panel sample
Total Issued sample
Total achieved sample
Plymouth 4331 317 392 207 20 10 412 217
Poole 381 20 27 12 256 170 283 182
Somerset 5327 336 396 219 33 18 429 237
South
Gloucestershire 4483 298 365 204 40 29 405 233
Swindon 4618 265 312 188 18 14 330 202
Torbay 943 58 68 26 240 136 308 162
Wiltshire 4504 326 386 228 42 24 428 252
Area unknown 597 23 25 0 9 0 34 0
5.3 Response rate for Fresh and panel sample
[image:41.595.90.416.197.761.2]Table 5.2 below shows the response rates achieved for both the fresh and panel sample in the 2009-10 survey. Overall a response rate of 56% was achieved across all areas and sample types. The response rate for the fresh sample was slightly lower than that achieved for the panel sample (55% compared with 59%).
Table 5.2 Response rate by local area
Local Area Fresh sample Response rate at main stage Panel Response rate† Overall response rate
Darlington 56% N/A 56%
Durham 63% N/A 61%
Gateshead 58% N/A 60%
Hartlepool 50% N/A 51%
Middlesbrough 61% N/A 61%
Newcastle Upon Tyne 66% N/A 66%
North Tyneside 58% N/A 58%
Northumberland 60% N/A 60%
Redcar and Cleveland 61% 53% 55%
South Tyneside 55% N/A 56%
Stockton-On-Tees 59% N/A 59%
Sunderland 62% N/A 62%
Blackburn with Darwen 52% N/A 52%
Blackpool 48% N/A 48%
Bolton 56% N/A 57%
Bury 77% 53% 54%
Cheshire 62% N/A 63%
Cumbria 57% N/A 58%
Halton 60% N/A 60%
Knowsley 48% N/A 49%
Lancashire 60% N/A 61%
Liverpool 48% N/A 49%
Manchester 58% N/A 60%
Oldham 45% 49% 48%
Rochdale 56% N/A 57%
Salford 57% N/A 57%
Sefton 52% N/A 53%
St Helens 58% N/A 57%
Stockport 59% N/A 60%
Tameside 55% N/A 55%
Trafford 56% N/A 55%
Warrington 61% N/A 61%
Wigan 58% N/A 60%
Wirral 62% N/A 63%
Barnsley 67% 59% 60%
Local Area Fresh sample Response rate at main stage Panel Response rate† Overall response rate
East Riding of Yorkshire 70% 61% 61%
Kingston Upon Hull, City of 56% N/A 55%
Kirklees 57% N/A 56%
Leeds 61% N/A 62%
North East Lincolnshire 54% 62% 61%
North Lincolnshire 33% 54% 54%
North Yorkshire 59% N/A 60%
Rotherham 57% N/A 58%
Sheffield 56% N/A 57%
Wakefield 57% N/A 58%
York N/A 61% 61%
Derby 38% 54% 53%
Derbyshire 62% 61% 61%
Leicester 51% 58% 56%
Leicestershire 56% N/A 56%
Lincolnshire 56% N/A 58%
Northamptonshire 61% N/A 59%
Nottingham 53% N/A 52%
Nottinghamshire 61% N/A 60%
Rutland 63% N/A 64%
Birmingham 55% N/A 57%
Coventry 60% N/A 60%
Dudley 54% N/A 54%
Herefordshire 57% N/A 58%
Sandwell 50% N/A 51%
Shropshire 57% N/A 58%
Solihull 54% 56% 56%
Staffordshire 62% N/A 62%
Stoke-On-Trent 56% N/A 55%
Telford and Wrekin 55% N/A 54%
Walsall 65% N/A 64%
Warwickshire 58% N/A 58%
Wolverhampton 52% N/A 53%
Worcestershire 69% 65% 65%
Bedfordshire 56% N/A 56%
Cambridgeshire 33% 64% 63%
Essex 56% N/A 56%
Hertfordshire 54% 61% 58%
Luton 33% 59% 58%
Norfolk 60% 60% 60%
Peterborough 40% 56% 54%
Southend-on-Sea 59% N/A 59%
Suffolk 58% N/A 58%
Thurrock 60% N/A 60%
Camden 50% N/A 51%
City Of London 75% N/A 75%
Hackney 41% 46% 43%
Hammersmith and Fulham 53% N/A 53%
Local Area Fresh sample Response rate at main stage Panel Response rate† Overall response rate
Islington 46% N/A 47%
Kensington and Chelsea 53% N/A 52%
Lambeth 44% N/A 43%
Lewisham 44% 50% 46%
Newham 44% N/A 44%
Southwark 45% N/A 45%
Tower Hamlets 57% N/A 56%
Wandsworth 48% N/A 48%
Westminster 42% N/A 42%
Barking and Dagenham 43% 50% 47%
Barnet 51% N/A 53%
Bexley 51% 56% 53%
Brent 43% 52% 46%
Bromley 56% N/A 55%
Croydon 52% N/A 52%
Ealing 50% N/A 51%
Enfield 48% N/A 49%
Greenwich 51% N/A 50%
Harrow 50% N/A 51%
Havering 51% N/A 50%
Hillingdon 54% N/A 54%
Hounslow 49% N/A 50%
Kingston Upon Thames 60% N/A 60%
Merton 50% N/A 50%
Redbridge 48% N/A 49%
Richmond Upon Thames 54% N/A 54%
Sutton 56% N/A 56%
Waltham Forest 54% N/A 56%
Bracknell Forest 54% N/A 54%
Brighton and Hove 43% 59% 57%
Buckinghamshire 54% N/A 54%
East Sussex 57% N/A 58%
Hampshire 58% N/A 60%
Isle Of Wight 51% N/A 51%
Kent 55% N/A 57%
Medway Towns 56% N/A 55%
Milton Keynes 58% N/A 59%
Oxfordshire 56% N/A 55%
Portsmouth 57% N/A 58%
Reading 45% N/A 45%
Slough 50% N/A 50%
Southampton 56% N/A 57%
Surrey 56% N/A 56%
West Berkshire 60% N/A 61%
West Sussex 53% N/A 57%
Local Area
Fresh sample Response rate at main stage
Panel Response rate†
Overall response rate
Bournemouth 50% N/A 51%
Bristol, City of 56% N/A 55%
Cornwall 55% N/A 55%
Devon 47% 63% 62%
Dorset 57% N/A 59%
Gloucestershire 71% 61% 61%
Isles Of Scilly 78% N/A 78%
North Somerset 56% N/A 56%
Plymouth 53% N/A 53%
Poole 44% 66% 64%
Somerset 55% N/A 55%
South Gloucestershire 56% N/A 58%
Swindon 60% N/A 61%
Torbay 38% 57% 53%
Wiltshire 59% N/A 59%
Total 55% 59% 56%
†Response rate for Panel sample shown only for the 30 areas that took part in the 2008-09
Sampling
[image:45.595.90.527.231.774.2]The sample source for the 2009-10 survey was the same as that used for the 2008-9 survey, the National Pupil database. A new extract was drawn from the database using the latest available data and excluding cases included in the sample for the first survey. Table 5.3 shows the sampled cases by SEN stratum. The table shows only the fresh sample drawn for screening in 2009-0. The profile of the panel sample by SEN stratum is shown in table 4.6 as the profile of year 1 achieved sample.
Table 5.3 Final sampling matrix – 2009/10
SEN Stratum ‘Special school’ stratum ‘Statement of SEN’
stratum ‘SA+’ stratum ‘SA’ stratum
‘Non SEN’
stratum All
Darlington 105 107 502 773 4386 5873
Durham 273 222 763 623 2533 4414
Gateshead 196 216 569 814 3084 4879
Hartlepool 91 87 546 816 4057 5597
Middlesbrough 193 174 709 846 2865 4787
Newcastle Upon Tyne 249 154 569 840 2784 4596
North Tyneside 203 230 633 603 2913 4582
Northumberland 195 362 428 517 3008 4510
Redcar and Cleveland 65 55 159 102 459 840
South Tyneside 226 148 699 902 3051 5026
Stockton-On-Tees 246 189 727 492 3040 4694
Sunderland 249 188 623 787 2872 4719
Blackburn with Darwen 141 164 862 1129 2539 4835
Blackpool 126 82 669 1107 3801 5785
Bolton 223 266 511 772 2801 4573
Bury 19 15 31 23 174 262
Cheshire 385 672 761 1156 6115 9089
Cumbria 121 344 425 717 2904 4511
Halton 155 159 584 1222 3309 5429
Knowsley 214 170 971 577 2403 4335
Lancashire 682 902 1238 1378 7929 12129
Liverpool 248 109 882 838 2780 4857
Manchester 284 252 571 796 2910 4813
Oldham 45 46 139 210 1276 1716
Rochdale 208 351 486 644 2725 4414
Salford 270 169 563 738 2843 4583
Sefton 248 157 739 574 3012 4730
St Helens 154 95 758 857 3370 5234
Stockport 197 357 402 629 2818 4403
Tameside 203 182 525 600 3015 4525
SEN Stratum ‘Special school’ stratum ‘Statement of SEN’
stratum stratum ‘SA+’ stratum ‘SA’
‘Non SEN’
stratum All
Barnsley 12 9 20 49 170 260
Bradford 206 213 647 903 2874 4843
Calderdale 119 321 604 784 2903 4731
Doncaster 217 247 391 861 3196 4912
East Riding of Yorkshire 24 7 8 5 46 90
Kingston Upon Hull, City of 206 254 648 629 2670 4407
Kirklees 188 305 404 818 3046 4761
Leeds 175 170 581 655 2930 4511
North East Lincolnshire 40 53 125 151 442 811
North Lincolnshire 7 5 10 10 62 94
North Yorkshire 147 173 419 534 3051 4324
Rotherham 234 222 684 698 2602 4440
Sheffield 204 225 813 554 2282 4078
Wakefield 156 293 535 714 3057 4755
York 3 1 0 5 35 44
Derby 15 12 33 66 304 430
Derbyshire 18 10 12 32 144 216
Leicester 67 68 232 290 1067 1724
Leicestershire 167 321 398 597 3149 4632
Lincolnshire 198 271 478 478 2371 3796
Northamptonshire 183 289 403 741 2485 4101
Nottingham 148 53 782 1270 2891 5144
Nottinghamshire 252 95 862 1998 7980 11187
Rutland 12 59 115 121 1231 1538
Birmingham 659 629 1437 1717 7663 12105
Coventry 299 156 789 605 2467 4316
Dudley 257 259 622 604 2853 4595
Herefordshire 111 170 964 829 2723 4797
Sandwell 163 215 591 995 3470 5434
Shropshire 182 386 619 565 2691 4443
Solihull 46 54 102 118 868 1188
Staffordshire 442 369 875 1003 6135 8824
Stoke-On-Trent 269 268 641 742 2295 4215
Telford and Wrekin 227 245 699 533 2571 4275
Walsall 222 211 323 752 3625 5133
Warwickshire 255 255 442 653 2523 4128
Wolverhampton 289 254 368 675 3032 4618
Worcestershire 28 24 78 63 362 555
Bedfordshire 401 525 858 1326 5988 9098
Cambridgeshire 8 5 11 16 86 126
Essex 569 865 1659 1690 10033 14816
Hertfordshire 206 154 497 632 2861 4350
Luton 24 20 52 65 239 400
Norfolk 48 93 167 207 689 1204
Peterborough 18 28 46 71 335 498
Southend-on-Sea 208 188 655 495 2467 4013
SEN Stratum ‘Special school’ stratum ‘Statement of SEN’
stratum stratum ‘SA+’ stratum ‘SA’
‘Non SEN’
stratum All
Camden 136 306 750 1240 5539 7971
City Of London 1 3 10 17 70 101
Hackney 83 148 557 966 4689 6443
Hammersmith and Fulham 107 175 582 1047 4173 6084
Haringey 160 346 992 1529 4517 7544
Islington 150 194 819 1473 5772 8408
Kensington and Chelsea 66 97 229 407 2938 3737
Lambeth 230 357 1823 1103 4353 7866
Lewisham 143 172 1044 850 3607 5816
Newham 57 237 1336 1594 5107 8331
Southwark 229 419 1367 934 3900 6849
Tower Hamlets 140 478 1167 1015 3726 6526
Wandsworth 214 278 1105 1412 3847 6856
Westminster 95 224 703 909 4804 6735
Barking and Dagenham 75 121 325 936 3207 4664
Barnet 209 451 822 1110 4546 7138
Bexley 99 167 483 927 2901 4577
Brent 140 182 690 1427 4757 7196
Bromley 234 496 946 739 4513 6928
Croydon 383 320 1203 1068 4981 7955
Ealing 279 297 1370 1163 4938 8047
Enfield 263 343 931 1353 4755 7645
Greenwich 186 423 1224 999 3573 6405
Harrow 197 270 933 1569 5379 8348
Havering 118 213 790 1373 6618 9112
Hillingdon 252 294 999 1436 4162 7143
Hounslow 208 307 1254 1387 4551 7707
Kingston Upon Thames 105 162 484 757 6081 7589
Merton 141 264 599 1198 7042 9244
Redbridge 243 413 882 978 4891 7407
Richmond Upon Thames 82 207 284 724 6545 7842
Sutton 166 298 790 1186 4592 7032
Waltham Forest 271 353 1420 1033 3495 6572
Bracknell Forest 93 167 397 738 3880 5275
Brighton and Hove 21 16 53 75 285 450
Buckinghamshire 265 274 396 563 3046 4544
East Sussex 438 488 1435 1309 4986 8656
Hampshire 281 163 465 674 2491 4074
Isle Of Wight 102 139 450 791 4564 6046
Kent 405 345 1094 1302 4448 7594
Medway Towns 190 228 726 763 2386 4293
Milton Keynes 289 237 570 527 2783 4406
Oxfordshire 205 250 561 630 2892 4538
Portsmouth 232 206 755 859 2235 4287
SEN Stratum ‘Special school’ stratum ‘Statement of SEN’
stratum stratum ‘SA+’ stratum ‘SA’
‘Non SEN’
stratum All
West Berkshire 110 242 538 856 2336 4082
West Sussex 212 198 564 544 2056 3574
Windsor and Maidenhead 42 67 93 126 730 1058
Wokingham 92 227 408 765 3823 5315
Bath and North East
Somerset 2 1 2 11 31 47
Bournemouth 95 103 528 1033 3245 5004
Bristol, City of 264 303 445 709 3120 4841
Cornwall 126 375 560 634 2805 4500
Devon 17 13 21 24 197 272
Dorset 196 192 642 569 2465 4064
Gloucestershire 6 2 9 17 70 104
Isles Of Scilly 0 2 5 7 75 89
North Somerset 123 139 686 907 3306 5161
Plymouth 247 263 493 723 2661 4387
Poole 6 6 42 67 265 386
Somerset 174 154 443 1099 3538 5408
South Gloucestershire 162 303 385 632 3073 4555
Swindon 201 239 621 725 2902 4688
Torbay 55 80 115 134 581 965
Wiltshire 166 299 559 652 2908 4584
Total 26439 33020 89637 111286 461915 722297
[image:48.595.88.527.71.435.2]Returned screener questionnaires by stratum
[image:48.595.91.520.532.760.2]Table 5.4 below shows the profile of returned screener questionnaires by stratum.
Table 5.4 Returned screener questionnaires by stratum
SEN Stratum ‘Special school’ stratum ‘Statement of SEN’
stratum ‘SA+’ stratum ‘SA’ stratum
‘Non SEN’ stratum All
Darlington 29 26 97 150 1292 1594
Durham 78 61 191 157 789 1276
Gateshead 64 54 144 189 911 1362
Hartlepool 27 24 108 177 980 1316
Middlesbrough 54 42 118 157 662 1033
Newcastle Upon Tyne 69 35 101 184 798 1187
North Tyneside 66 67 158 108 921 1320
Northumberland 50 108 107 132 920 1317
Redcar and Cleveland 17 11 33 23 124 208