Effective Pre-school and Primary Education 3-11 Project
(EPPE 3-11)
Final Report from the Primary Phase:
Pre-school, School and Family Influences on
Children’s Development During Key Stage 2
(Age 7-11)
Kathy Sylva
+, Edward Melhuish
#, Pam Sammons
$,
Iram Siraj-Blatchford* and Brenda Taggart*
+
University of Oxford,
#
Birkbeck, University of London,
$University of Nottingham
and *Institute of Education, University of London
The views expressed in this report are the authors’ and do not necessarily reflect those of the Department for Children, Schools and Families.
T
HE
EPPE
3-11
R
ESEARCH
T
EAM
Principal Investigators
Professor Kathy Sylva
Department of Education, University of Oxford
00 44 (0)1865 274 008 / email kathy.sylva@education.ox.ac.uk
Professor Edward Melhuish
Institute for the Study of Children, Families and Social Issues Birkbeck University of London
00 44 (0)207 079 0834 / email e.melhuish@bbk.ac.uk
Professor Pam Sammons
School of Education, University of Nottingham
00 44 (0)115 951 4434 / email pam.sammons@nottinghham.ac.uk
Professor Iram Siraj-Blatchford
Institute of Education, University of London00 44 (0)207 612 6218 / email i.siraj-blatchford@ioe.ac.uk
*Brenda Taggart
Institute of Education, University of London
00 44 (0)207 612 6219 / email b.taggart@ioe.ac.uk
Research Officers
Dr Sofka Barreau
Institute of Education, University of London
00 44 (0)207 612 6608 / email s.barreau@ioe.ac.uk
Dr Yvonne Anders (née Grabbe)
Institute of Education, University of London00 44 (0)207 612 6608 / email y.grabbe@ioe.ac.uk
Dr Stephen Hunt
Institute of Education, University of London 00 44 (0)207 612 6608 / email s.hunt@ioe.ac.uk
Dr Helena Jelicic
Institute of Education, University of London 00 44 (0)207 612 6608 / email h.jelicic@ioe.ac.uk
Rebecca Smees
Institute of Education, University of London 00 44 (0)207 612 6608 / email r.smees@ioe.ac.uk
Wesley Welcomme
Institute of Education, University of London
00 44 (0)207 612 6684 / email w.welcomme@ioe.ac.uk
Olga Cara
*Also Research Co-ordinator
A
CKNOWLEDGEMENT
The EPPE 3-11 project is a major longitudinal study funded by the Department for Children, Schools and Families (DCSF). The research would not be possible without the support and co-operation of the six Local Authorities (LAs) and the many pre-school centres, primary schools, children and parents participating in the research.
Contents
Page no.
Executive Summary i
Section 1: Introduction and background to the study 1
Summary of Key Messages 1
Earlier findings from the EPPE research programme: ages 3 - 7 1
The impact of pre-school at school entry (age 5) 2
The impact of pre-school at the end of Key Stage 1 (age 7) 3
What differentiates the most effective pre-schools?: Evidence from case studies 4
Section 2: How EPPE 3-11 studied children’s development 8
Summary of Key Messages 8
Design of the study 8
Aims of the research for Key Stage 2 (KS2) 8
The Sample 8
Child trajectories 9
The academic effectiveness of the primary school 13
Observations of classrooms and school processes 13
Ofsted inspection judgements 14
Case Studies 14
Data collection 14
Analytical strategy 14
The research questions 15
Section 3: Child, family and home background effects at the end of primary school 16
Summary of Key Messages 16
Child characteristics 16
Parental, family and home characteristics 16
Background effects at the end of primary school 17
Child characteristics 17
Parental and Family characteristics 18
The Early years Home Learning Environment (Early years HLE) in the pre-school period 21
Section 4: Pre-school and Primary School Influences on children’s attainment and progress in Key Stage 2 - Cognitive and social/behavioural outcomes 28
Summary of Key Messages 28
Continuing Pre-school effects 28
Pre-School Attendance 28
Pre-school Quality 29
Pre-school Centre Effectiveness 34
The combined impact of pre-school experience and primary school effectiveness 46 The combined impact of pre-school effectiveness and primary school effectiveness 47
Summarising Pre-school and Primary School Influences 50
Pupils’ progress across Key Stage 2 (KS2) 50
Summary and implications of pre-school and primary school effects at end of primary
school 51
Section 5: Understanding the influences of primary school practices 55
Summary of Key Messages 55
Exploring classroom processes in Year 5 55
Classroom observations 55
Disadvantaged groups 59
Predicting children’s progress using observational measures and teacher perception factors 59
What matters in the classroom? 60
What matters outside the classroom? 63
The relationship between classroom observations and measures of effectiveness 67
Conclusions 70
Key findings on the influences of primary school practices 71
Section 6: Exploring Pupils’ Self-perceptions and Views of primary school 72
Summary of Key Messages 72
A. Factors contributing to Pupils’ Self-perceptions and Views of primary school 73
Pupils’ Self-perceptions 73
Pupils’ Views of primary school 75
B. Relationships of Pupils’ Self-perceptions and Views of primary school to their
developmental outcomes 75
Pupils’ Self-perceptions and outcomes 75
Pupils’ Views of primary school and outcomes 77
Conclusions and Implications 78
Section 7: Understanding Pupils’ learning trajectories 80
Summary of Key Messages 80
Achievement gaps and what influences them 80
Key findings on the effectiveness of pre-school, primary school and the Early years home
learning environment (HLE) 82
Performance above or below expectation and what predicts it 83
How do low SES families support pupil’s learning in the home? 84
The qualitative case-study research questions 86
Section 8: Other influences on children’s development 90
Summary of Key Messages 90
The neighbourhood influences on children’s development 90
Out of school hours learning (OSHL) in Key Stage 2 95
Transition between primary and secondary school 98
Term of birth (Summer born children) 101
Section 9: Concluding discussion 103
Key Findings 103
EPPE 3-11 findings relevant to policy 109
How EPPE 3-11 has contributed to the research literature 110
Relationship of the EPPE 3-11 findings to other research studies 111
EPPE 3-11 becomes EPPSE - Effective Pre-school, Primary and Secondary Education 112
References 113
Glossary of terms 126
Appendix 1: The policy context of the EPPE 3-11 study 130
Appendix 2: Summary of data collected 133
Appendix 3: Home Learning Environment (HLE) measures 134
Appendix 4: The Multiple Disadvantage Index 135
Appendix 5: Investigating the academic effectiveness of all primary schools in England 136
Appendix 6: The relationship between classroom observations and teachers’
perceptions 137
Appendix 7: The Key Stage 1 Home Learning Environment (HLE) 140
List
of
Tables Page no.
Table 1: Effect sizes for SES, parents’ education, and Early years HLE on 5, 7 and 10 year olds
outcomes 24
Table 2: Effect Sizes of Factors associated with effects upon the Early years HLE 24
Table 3: Mean Early years HLE by SES and Ethnic Groups 25
Table 4: Differences in social/behavioural development at age 11 by HLE groups 26
Table 5: Summary of background factors and pre- and primary school influences on cognitive
attainment and social behaviour at Year 6 53
Table 6: Distributions of the combined dimensions for each observation instrument 60
Table 7: English Attainment Level at KS2 and Season of Birth (n=2810) 101
Table 8: Mathematics Attainment Level at KS2 and Season of Birth (n=2810) 102
Table 9: SEN Identified Up to End KS2 by Season of Birth (n=2718) 102
Table 10: Summary of data/measures collected in the EPPSE 3-11 project 133
List of Boxes
Page no.
Box 1: Items associated with each social/behavioural dimension in Year 6 (age 11) 10 Box 2: Items associated with each pupils’ self-perception dimension in Year 2 (age 7) 11 Box 3: Items associated with each pupils’ self-perception dimension in Year 5 (age 10) 12
Box 4: Underlying Dimensions for the COS-5 (Pianta) 56
Box 5: Underlying dimensions for the IEO (Stipek) 56
Box 6: Items corresponding to each dimension of teachers’ perceptions 64
Box 7: Items associated with each dimension of pupils’ self-perceptions in Year 5 (age 10) 72 Box 8: Items associated with each dimension of pupils’ views of primary school in Year 5 (age
10) 73
Box 9: The specific items associated with the Early years and Key stage 1 Home Learning
List of Figures
Page no.
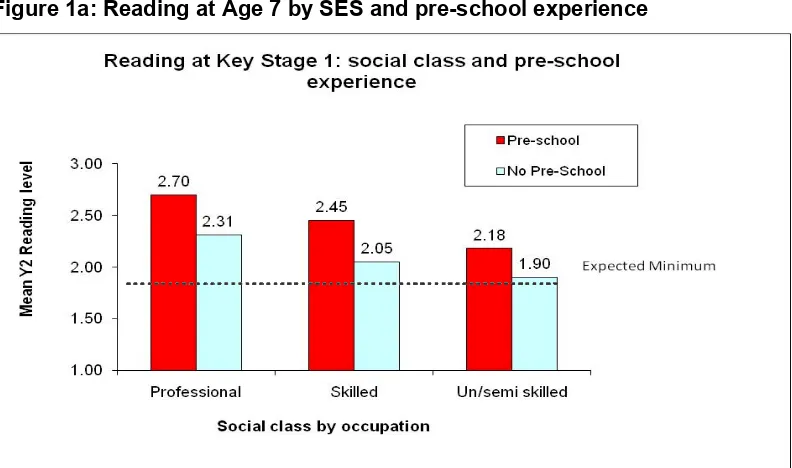
Figure 1a: Reading at Age 7 by SES and pre-school experience 4
Figure 1b: Mathematics at Age 7 by SES and pre-school experience 4
Figure 2: Influences on children’s development 14
Figure 3.1: The net effect of mother’s qualification on English attainment at age 11 18
Figure 3.2: The net effect of mother’s qualification on Mathematics attainment at age 11 19
Figure 3.3: The net effect of family SES on English attainment at age 11 19
Figure 3.4: The net effect of family SES on Mathematics attainment at age 11 20
Figure 3.5: The net effect of Early years HLE on English attainment at age 11 25
Figure 3.6: The net effect of Early years HLE on Mathematics attainment at age 11 26
Figure 4.1: Reading at age 11 by SES and pre-school experience 29
Figure 4.2: Mathematics at age 11 by SES and pre-school experience 29
Figure 4.3: The impact of Pre-school quality (ECERS-E) on English & Mathematics in Year 6 30
Figure 4.4: The impact of Pre-school quality (ECERS-R & ECERS-E) on ‘Self-regulation’ in Year 6 31
Figure 4.5: The impact of Pre-school quality (ECERS-R & ECERS-E) on ‘Pro-social’ behaviour in Year 6 32
Figure 4.6: The impact of Pre-school quality (ECERS-R & ECERS-E) on ‘Hyperactivity’ in Year 6 32
Figure 4.7: The impact of Pre-school quality (ECERS-R & ECERS-E) on ‘Anti-social’ behaviour in Year 6 33
Figure 4.8: The impact of pre-school effectiveness (Pre-reading) on attainment in English at Year 6 35
Figure 4.9: The impact of pre-school effectiveness (Early numbers concepts) on attainment in Mathematics at Year 6 35
Figure 4.10: The impact of Pre-school Effectiveness (Early number concepts) on ‘Self-regulation’ in Year 6 36
Figure 4.11: The impact of Pre-school Effectiveness (Early number concepts & Pre-reading) on ‘Pro-social’ behaviour in Year 6 37
Figure 4.12: The impact of Pre-school Effectiveness (Social behaviour) on ‘Self-regulation’ in Year 6 37
Figure 4.13: The impact of Pre-school Effectiveness (Social behaviour) on ‘Pro-social’ behaviour in Year 6 38
Figure 4.14: The impact of Pre-school Effectiveness (‘Independence & Concentration’ and ‘Peer Sociability’) on ‘Hyperactivity’ in Year 6 38
Figure 4.15: The impact of Pre-school Effectiveness (‘Anti-social’ behaviour) on ‘Anti-social’ behaviour in Year 6 39
Figure 4.16: The combined impact of Early years HLE and pre-school on English attainment at Year 6 40
Figure 4.18: The combined impact of Early years HLE and quality of pre-school on
attainment in English at Year 6 41 Figure 4.19: The combined impact of early years HLE and quality of pre-school on
attainment in Mathematics at Year 6 42 Figure 4.20: The combined impact of Early years HLE and Pre-school quality (ECERS-E)
on ‘Self-regulation’ 43 Figure 4.21: The combined impact of Early years HLE and pre-school effectiveness
(in terms of Pre-reading) on attainment in English at Year 6 43 Figure 4.22: The combined impact of Early years HLE and effectiveness of pre-school
(in terms of Numeracy) on attainment in Mathematics at Year 6 44 Figure 4.23: The impact of primary school effectiveness on English and Mathematics at
Year 6 45 Figure 4.24: The combined impact of pre-school quality and primary school effectiveness
on attainment in English at Year 6 46 Figure 4.25: The combined impact of pre-school quality and primary school effectiveness
on attainment in Mathematics at Year 6 47 Figure 4.26: The combined impact of pre-school and primary school effectiveness on
attainment in English at Year 6 48 Figure 4.27: The combined impact of pre-school and primary school effectiveness on
attainment in Mathematics at Year 6 48 Figure 4.28: The combined impact of Pre-school quality (ECERS-E) and Primary
school effectiveness (Mathematics) on ‘Self-regulation’ 49 Figure 5.1: Distributions of Classroom practice and processes 57 Figure 5.2: The effect of Overall Teaching quality on Pupils’ Cognitive progress (Year 1 to
Year 5) 61 Figure 5.3: The net effects of ‘Disorganisation’ on Pupils’ Cognitive progress and
social/behavioural development (Year 1 to Year 5) 62 Figure 5.4: The effect of Use of homework and school standards on Pupils’ Cognitive
and Social/behavioural progress (Year 1 to Year 5) 64 Figure 5.5: The effect of Pupils’ agency and voice on Pupils’ Cognitive and
Social/behavioural progress (Year 1 to Year 5) 65 Figure 5.6: The effect of Anti-academic ethos on Pupils’ Cognitive and
Social/behavioural progress (Year 1 to Year 5) 66 Figure 5.7: The effect of School communication with parents on Pupils’ Cognitive and
Social/behavioural progress (Year 1 to Year 5) 67 Figure 5.8: Ofsted judgements of ‘School effectiveness’ and net influence on Pupils’
Cognitive progress (Year 1 to Year 5) 68
Figure 5.9: Ofsted judgements of ‘Improvement since last inspection’ and net influence on
Pupils’ Cognitive progress (Year 1 to Year 5) 68 Figure 5.10: Ofsted judgements of ‘Improvement since last inspection’ and net influence on
Pupils’ Social/behavioural progress (Year 1 to Year 5) 69 Figure 6.1: The effect of ‘Enjoyment of school’ on children’s Social/behavioural development from Year 1 to Year 5 76 Figure 6.2: The effect of ‘Positive Social Environment’ on children’s Reading and
Mathematics progress from Year 1 to Year 5 77 Figure 6.3: The effect of ‘Positive Social Environment’ on children’s
Figure 6.4: The effect of ‘Teachers’ support for pupils’ learning’ on pupils’
Executive Summary
EPPE 3-11 is a large study of the developmental trajectories of approximately 2800
children in England from age 3 to 11 years. This report focuses on the primary school
phase, particularly Key Stage 2 (ages 7-11). Many children have prospered, leaving Key
Stage 2 (at age 11) with confidence and armed with the skills they need to tackle
learning in secondary school. However, some children moved onto secondary school
with poor skills in key areas or with low self-image and aspiration. The EPPE 3-11
project set out to explain some of the reasons behind these different developmental
trajectories.
Learner trajectories and measuring factors that might shape them
We established a developmental profile for each child including cognitive and language
assessments (standardised assessments), social and emotional assessments (carried
out by key pre-school and school staff) and self-reports completed by the children
themselves. These longitudinal assessments undertaken at age 3, 5, 6, 7, 10 and 11 are
the core of the study. We used parental interviews and questionnaires to find out about
the child’s history from birth and family demographic characteristics when the child was
3, 6 and 11. Parents were also asked about daily routines and learning activities with
their children at home and in the community. The 141 pre-school settings and a subset
of the primary schools children attended (125 school in Year 5) were studied through
interviews, questionnaires and observations.
The project also used data on Key Stage 1 (KS1) and Key Stage 2 (KS2) National
assessment scores for every child in England, grouped by the schools they attended, to
calculate academic effectiveness measures for primary schools. We located each
primary school an EPPE 3-11 pupil attended on a scale of ‘academic effectiveness’
(standardised for England), after controlling for their prior attainment and the
demographic characteristics of each school’s intake. More detailed information,
including systematic observations and Ofsted judgements, was obtained for a subset of
125 focal schools attended by EPPE 3-11 pupils.
EPPE 3-11 has compiled a record for each child that contains the following information:
INDIVIDUAL LEVEL DATA
Assessment Age 3 5 6 7 10 11
Cognitive assessments √ √ √ NFER
tests
√ National Assessment
√ NFER
tests
√ National Assessment
Social/behavioural profiles √ √ √ √ √ √
Home Learning Environment
(HLE) √ Early yearsHLE √ KS1 HLE
√ KS2
HLE
Pupils’ self-report √ √
Community characteristics/
neighbourhood √ √
PRE-SCHOOL/PRIMARY SCHOOL LEVEL DATA Institution characteristics –
quality and effectiveness √
Academic effectiveness √ √ Across KS2
ADDITIONAL INFORMATION IN SUB-SAMPLE OF 125 SCHOOLS: Teacher report:
classroom/school processes,
quality of teaching √
Looking for consistent patterns and relationships
Using complex statistical modelling we identified patterns of development for pupils who
differ by gender, home background, social group and community. Such analyses can
identify the kinds of pupils and the combinations of social and educational experiences
that predict more successful or poorer development. In addition, we established the net
influences of pre-school, for example, controlling for other important influences such as
child and family factors. We also studied primary school influences.
Case studies of a small sample of pupils from low socio-economic (SES) group and their
families who were doing better than expected enriched the quantitative picture
enormously. They illustrated how families from disadvantaged circumstances can
support their children to raise their achievement. The case studies illuminated practices
that parents, family and community members used to enhance pupils’ social and
educational capital through gains in skill and aspiration.
Overarching influences on children’s development
The pioneering work of Bronfenbrenner (1986; 1994; 1998) has identified immediate and
more distant factors that shape children’s development. The child is located at the
centre of a series of concentric circles, surrounded and influenced first by the family,
then the community (including schools), and finally the national and cultural framework
within which all families and schools are embedded. Six overarching domains of
potential influence on children were identified and their effects on development were
measured:
i.
individual characteristics associated with the child, e.g., gender or birth weight
ii. family
characteristics,
e.g., parental education, home language
iii.
home learning environment (HLE), i.e. learning opportunities in the home
iv. the
neighbourhood/community characteristics
v.
pre-school attendance and experiences
vi.
primary school experiences.
Establishing the separate effects of each of these influences is difficult enough but we
attempted to discover how these factors interact to shape children’s development. This
was made possible by the large scale and longitudinal nature of the study, and the rich
and varied data collected on children, families, pre-schools and schools.
Structure of the report
We begin with a brief background to the study, and then Section 2 considers the design
features of the study, including the assessments used to create each child’s
developmental trajectory between age 3 and 11 years. Section 3 moves on to explore
individual, family and home learning environment (HLE) influences on pupils’
Section 5 ‘drills down’ into the pupils’ experiences of the classrooms and schools in
which they learn. Here we present findings on a sub-sample of 1160 EPPE 3-11 pupils
in 125 schools in Year 5 classrooms (age 10). Using observations and questionnaires
we investigate educational practices that shape learning and development inside the
classroom and the school, and show relationships with pupils’ development at age 10
and progress from Year 1 (age 6) to Year 5 (age 10).
Section 6 focuses on the pupils’ self-reports and on the way they perceive their school
and teachers. The self-perceptions (e.g. how happy they are at school or how good they
think they are at maths) are combined into key dimensions such as ‘Enjoyment of
school’, ‘Academic self-image’ and ‘Behavioural self-image’, which are then linked to
child and family characteristics and to developmental trajectories.
In Section 7 there is discussion of resilient and vulnerable pathways, drawing on
quantitative and case study methods. This section identifies positive (or ‘protective’)
influences that can ameliorate risk factors in development, especially the role of family
support for learning and pre-school education. Section 8 discusses ‘other’ influences on
children’s outcomes such as neighbourhood, mobility, out of school hours learning,
transitions to secondary school, and term of birth. Section 9 pulls together the
longitudinal findings, ending with some recommendations.
Phases of the research
The research has proceeded in three phases: the pre-school period and continuing to
the end of Key Stage 1 (age 7), Key Stage 2 (age 11), and (to be reported later) Key
Stage 3 (age 14). The first phase was summarised in a final report (Sylva et al., 2004)
and there have been numerous technical papers and research briefs covering different
aspects of the pre-school, Key Stage 1 and Key Stage 2 phases (see
www.ioe.ac.uk/projects/eppe
). This report is a summary of the second phase (7-11
years). The third phase of the research is currently underway (Key Stage 3, age 11-14)
and a report will be available in 2011.
Major findings
1 The lasting effects of pre-school, including the contribution of quality
The benefits of pre-school education have largely persisted through to the end of Key
Stage 2. Attendance at pre-school remains beneficial for both academic and
social/behavioural outcomes, as well as pupils’ self-perceptions. Importantly the quality
of the pre-school (measured on the Early Childhood Environment Rating Scales,
ECERS-R see Harms, Clifford & Cryer, 1998; ECERS-E see Sylva et al., 2006) predicted
pupils’ developmental outcomes net of all other influences. For all social outcomes, the
benefits of pre-school were greater for boys, for pupils with special educational needs
(SEN), and for pupils from disadvantaged backgrounds. However, for some of the
outcomes, notably English, Mathematics and ‘Hyperactivity’, only pre-schools of medium
or high quality had lasting effects. Finally, the higher the value added academic
2 The contribution of the family and the home learning environment (HLE)
The overall effects of child and family characteristics were less powerful at age 11 than
at age 7; nonetheless mother’s highest qualification level and the Early years home
learning environment (HLE) still had strong effects upon academic outcomes. Gender
was a strong predictor for ‘Pro-social’ behaviour and ‘Hyperactivity’, with girls being more
pro-social and boys more hyperactive. There were weaker effects for gender for
academic outcomes; in Mathematics boys have higher attainment at age 11 and girls
have better outcomes in English. These findings are not new but what is surprising is
the continuing strong influence of the Early years HLE. Moreover, significant
characteristics such as family income, FSM and family SES are
less
powerful predictors
than parents’ qualification levels or the Early years HLE indicating that social capital
remains important. Home support for learning during the pre-school period continues to
show effects on several outcomes (attainment in English and Mathematics,
‘Self-regulation’, ‘Pro-social’ behaviour and ‘Hyperactivity’) at the end of primary school. In
addition, the small group of children with English as an additional Language (EAL) and
still in need of support at age 11 showed poorer outcomes.
3 The contribution of primary schools to children’s development
The academic effectiveness of the primary school was measured between Key Stage 1
and 2 independently of the longitudinal sample, by analysing national assessments for all
pupils (600,000+) in all state primary schools (15,000+) in England across three
successive cohorts (2002-2004, see Melhuish et al., 2006a). EPPE 3-11 pupils who
attended an academically more effective primary school had significantly better
outcomes, net of child and family background. The effects were moderate to strong on
both English and Mathematics scores, particularly so for Mathematics. Not only was the
effectiveness of the primary school linked to pupils’ absolute attainment at age 11, it also
predicted the amount of progress the EPPE 3-11 pupils made between the ages of 7 and
11. For social/behavioural outcomes, however, the academic effectiveness of the school
did not show a significant effect across all pupils. However, certain groups such as
those with special educational needs (SEN), or whose mothers had low educational
qualifications, had better social/behavioural outcomes if they attended schools that were
more academically effective. There was no evidence of any adverse outcome for social
behaviour or self-perceptions where pupils attended an academically more effective
primary school. Thus, achieving high academic standards has no adverse impact on
enjoyment or academic and behavioural self-image or social outcomes. Indeed for more
vulnerable groups it seems to be beneficial.
4 Classroom and school processes
Classroom observations revealed considerable variation in the quality of pupils’
educational experiences during Year 5 (Summer 2004, Summer 2005) although
observations indicated less time off-task and more engagement with lessons than in
other earlier studies (Galton, Simon & Croll, 1980; Galton et al., 1999). Interestingly,
observed quality was significantly higher in that half of classes where teachers used the
Plenary session (an indication of closer adherence to the Literacy and Numeracy
strategies). Overall
Teaching quality
was a significant predictor of better progress over
Key Stage 2 from age 6-10 in both Reading and Mathematics. The
Quality of Pedagogy
and
Classroom Control
were particularly important for progress in Mathematics with
behaviour and ‘Self-regulation’. High levels of classroom
Disorganisation
predicted
poorer progress in both Reading and Mathematics and increased ‘Hyperactivity’.
The relationships between teachers’ views of their school and pupils’ outcomes were
complex. For instance: teachers’ reports on more consistent homework practices and
better school communication with parents and parental support for pupils’ learning, were
related to better progress in Mathematics and some social outcomes. Where teachers
reported higher levels of Anti-academic ethos in their school, children made less
academic and social/behavioural progress. Finally medium levels of Pupils’ agency and
voice (as apposed to high or low levels) also predicted improved Mathematics and
social/behavioural outcomes. In schools where teachers reported active
School
communication with parents,
pupils showed better progress in ‘Self-regulation’. In
addition, where teachers reported strong
Parental support for their child’s learning
, pupils
made better progress in Reading and ‘Pro-social’ behaviour.
The Ofsted inspection measure of overall ‘School effectiveness’ was a moderately strong
positive predictor of progress in Mathematics and ‘Self-regulation’ whilst the judgment on
the ‘Quality of school leadership’ showed a positive relationship with Mathematics
progress. Ofsted’s judgement on a school’s ‘Improvement since last inspection
’
was a
significant predictor of Mathematics progress, as well as development in ‘Self-regulation’,
‘Pro-social’ and ‘Anti-social’ behaviour. This indicates that pupils who attended a higher
quality school (as judged by inspectors) made more progress and had better
development, taking into account their background and prior attainment, confirming the
importance of primary school influences in shaping pupils’ outcomes during Key Stage 2.
5 How pre-school and primary school interact to affect pupils’ learning and development
EPPE 3-11 is the first study to investigate the combined effects of pre-school and
primary school on pupil outcomes. The combination of attending a higher quality
pre-school and then moving on to an academically effective primary pre-school had clear
benefits for pupils’ cognitive outcomes to age 11, especially for Mathematics. High
quality pre-school appears to provide some ‘protection’ against attending an ineffective
primary school; pupils who attended high quality pre-schools fared better in low effective
primary schools than pupils who had not attended pre-school or those who had attended
lower quality pre-schools. The reverse was also true, pupils who were fortunate enough
to attend a primary school of high academic effectiveness showed better outcomes in
Key Stage 2 (compared to children in low effective schools) even if they had not
attended a pre-school or if their pre-school was of low quality.
6 Influences are different for English, Mathematics and social/behavioural development
Patterns of influence differ for social/behavioural development. In Year 6, background
characteristics were found to be better predictors of ‘Self-regulation’ than for other
social/behavioural outcomes. In addition, gender effects were particularly strong for
‘Pro-social’ behaviour and ‘Hyperactivity’, having 3-4 times as large an effect as
pre-school quality and effectiveness. Mother’s highest qualification was also an important
predictor and had the strongest effects for ‘Self-regulation’ and ‘Hyperactivity’ outcomes.
Thus the patterns of influence vary for different outcomes, as well as for different groups
of pupils. Only a large scale and longitudinal study could reveal such subtle differences,
and the interacting effects of pre-school and primary education.
7 Pupils’ self-perceptions: what influences them and their effects on future development?
Influential factors for pupils’ self-perceptions differ for each self-perception measure.
Gender was the strongest precursor of ‘Behavioural self-image’, whereas for ‘Academic
self-image’ the strongest precursors were father’s highest qualification and the Early
years home learning environment (HLE). ‘Enjoyment of school’ was higher for pupils
who were eligible for free school meals (FSM) and for those who had previously
attended a high quality pre-school.
Self-perceptions (in Year 5) were differentially associated with pupils’ outcomes. Pupils’
‘Academic self-image’ had the strongest relationship with Reading, Mathematics and
‘Self-regulation’, whereas pupils’ ‘Behavioural self-image’ had the strongest relationship
with ‘Hyperactivity’, ‘Pro-social ‘and ‘Anti-social’ behaviour in Year 5. There appeared to
be strong
reciprocal
relationships between ‘Academic self-concept’ and academic
achievement and between ‘Behavioural self-image’ and social/behavioural outcomes,
which might be expected because the pupil doing well may gain confidence and
motivation that enhances later outcomes.
Pupils’ perceptions of primary school were related to cognitive and social/behavioural
outcomes. Pupils’ positive view about their social environment was related to better
outcomes for all cognitive and social/behavioural outcomes in Year 5. Pupils’
perceptions of ‘Teachers’ support for pupils’ learning’ were positively related to
‘Self-regulation’ and ‘Pro-social’ behaviour, whereas perceptions of ‘Headteacher qualities’
were related to ‘Pro-social’ behaviour and ‘Hyperactivity’, and to Reading attainment in
Year 5. It appears that pupils’ experiences of feeling safe and supported in schools are
related to overall development.
8 How pre-schools, schools and
families can support the development of pupils from
disadvantaged and ethnic minority backgrounds achieve ‘against the odds’
Disadvantaged children and boys in particular benefit significantly from good quality
pre-school experiences. If disadvantaged children attended centres that included children
from mixed social backgrounds they made more progress than if they attended centres
serving predominantly disadvantaged children. Children identified as ‘at risk’ of learning
or behavioural difficulties are helped by pre-school, with integrated settings and nursery
schools being particularly beneficial in providing a better start to primary school.
The Early years home learning environment (HLE) and staff support for parents in
providing a quality HLE have been found to promote intellectual and social development
in all children. While the social class and levels of education of parents were related to
child outcomes, the Early years HLE was also found to be more important than family
SES and income effects. Moreover HLE is only moderately associated with social class
or mothers’ qualification levels. What parents
do
is therefore vitally important and can
counteract other disadvantaging influences, particularly during pre-school. For this
reason pre-school and school settings that do not include provision for parent support
and education are missing an important element in raising achievement and enhancing
social/behavioural development over the longer term.
The case study findings on pupils (selected for low socio economic status [SES] and
varied ethnic status) who ‘succeeded against the odds’ showed that what they had in
common was higher scores on the Early years home learning environment (HLE).
Interviews with parents and pupils to explore what might account for pupils’ success
revealed: a) a range of family members provided support for pupils’ learning, b) pupils
themselves were active in maintaining these practices and c) education was valued
highly by the family as a means of improving life chances.
Parents and the pupils with a higher Early years HLE from a disadvantaged context
thought that the reason some pupils did better in school was because they were more
attentive and made more of an effort. These parents had high expectations for their
children and saw education as important for achieving economic independence and
employment opportunities in the future. They hoped their children would attend higher
education and have a professional career.
The evidence supports the focus on initiatives that provide family and/or child mentoring
(e.g. Learning Mentorship) as these may have a role in developing social capital.
Community focused supplementary schools and classes can also provide important
educational resources. Schools and pre-schools need to do more to encourage the
involvement of parents and the wider family, particularly in the education of
disadvantaged children.
Some implications of EPPE 3-11
EPPE 3-11 has highlighted the importance of large scale, longitudinal studies with a
mixed methods approach (Sammons et al., 2005; Siraj-Blatchford et al., 2006) studying
how different phases of education are related to children’s development. There are
implications of the findings for policy and practice for improving pre-schools and primary
schools. These include enhancing the quality of pre-school, especially through more
qualified staff; supporting parents as educators as well as carers; additional support for
disadvantaged pupils and the school they attend; balancing academic and
socio-emotional emphasis within the curriculum in pre-school; and treating health, education
and care as inseparable (as pre-school settings that did this e.g. the integrated settings,
had better outcomes for children and provided a better start to primary school).
Also the project has provided a unique insight into the enduring impact of early
experiences, especially the Early years home learning environment (HLE) and the quality
of pre-school. EPPE 3-11 has drawn particular attention to the importance of classroom
practices. The overall quality of teaching is especially important for progress in Reading
and Mathematics, while specific features predict behavioural outcomes. The project has
also revealed that disadvantage is complex and that multiple disadvantages interact and
are key sources of inequality. If a child experiences no school or poor quality
pre-school and a less academically effective primary pre-school, their prospects of good
outcomes are significantly reduced. In this way educational influences may reinforce
existing inequity. By contrast, good provision and experiences can help to counteract
the risk of poor outcomes. This is of particular concern for disadvantaged children.
Thus, educational influences have the capacity to mitigate or further exacerbate
inequalities. Longitudinal and mixed-method data can demonstrate how important it is to
ensure that disadvantaged groups have access to high quality educational experiences
from pre-school onwards.
Section 1: Introduction and background to the study
Summary of Key Messages
The initial phase of the EPPE study ran from 1996 – 2003 ; its findings indicated that in Key Stage 1:
• There is an enduring impact of attending pre-school on children’s cognitive and social/behavioural development
• The quality of the pre-school setting and duration of attendance are important for children’s development.
•
Specific pedagogical and structural practices differentiated effective pre-school settings.•
The quality of the Early years home learning environment promoted intellectual and social development in all children.The Effective Pre-school and Primary Education project (EPPE 3-11) is Europe’s largest longitudinal investigation into the effects of pre-school and primary education on pupils’ developmental outcomes. More than 2800 children were assessed at the start of pre-school (around the age of 3) and were then followed up when they entered school along with a further 300+ children with no pre-school experience. All children were then followed for a further six years until the end of Key Stage 2 (age 11 years). The study used an ‘educational effectiveness’ design to establish the contribution of child, family, home learning environment (HLE), and school characteristics related to children’s progress.
Children were recruited from the major types of Foundation Stage settings existing in England at the start of the study (1997): integrated centres (fully combining care, education and often health); maintained nursery schools, nursery classes, playgroups, private day nurseries, and local authority day nurseries. In addition a group of ‘home’ children with no pre-school centre experience were studied for comparison purposes. Parent interviews provided extensive
information on the family and on home activities and the child’s health and care history before the age of three. The first phase of the EPPE study, of children aged 3-7 years, demonstrated the contribution to children’s development of attendance at different types of early childhood provision. The study investigated the effects of duration and quality of pre-school, and the contribution to children’s outcomes of differing pedagogical strategies and levels of staff qualification.
The study also demonstrated the important contribution of family characteristics to children’s development, including demographic influences such as social class and daily experience such as family activities that enhance young children’s learning. By examining the effects of education after taking into account child and family characteristics, the positive influence of early childhood education has been demonstrated, especially for children from disadvantaged backgrounds and those at risk of developing special educational needs (SEN). In developing the study further, to the end of primary education, the EPPE research was informed by the policy and research contexts in the UK and internationally (see Appendix 1)
Earlier findings from the EPPE research programme: ages 3 - 7
The findings over the first phase of the study are summarised below:
The impact of pre-school at school entry (age 5)
1. Effects of pre-school
Pre-school experience, compared to none, enhances children’s cognitive and social/behavioural development.
2. Type of provision
Some settings are more effective than others in promoting positive child outcomes. ‘More’ and ‘less’ effective centres can be found in all types of provision. Overall however, children made better progress (cognitive and social/behavioural) in fully integrated centres and nursery schools, but poorer progress in Local Authority day nurseries.
3. Duration and age of entry
The duration of attendance is important with every month of pre-school experience after age 2 years linked to better intellectual development and improved independence, concentration and sociability. Full-time attendance led to no better gains for children than part-time. Children who had longer hours (greater than 2,000) in group care under the age of two years had higher levels of ‘Pro-social’ behaviour but a slightly increased ‘risk’ of ‘Anti-social’ behaviour at 5 years old.
4. Quality of provision
The observed higher quality of pre-school centres is related to better intellectual/cognitive and social/behavioural development in all children.
5. The main effects of pre-school are present at school entry; these strong effects can be seen in the difference between school entry profiles of the ‘home’ children and the pre-school group. The influence of pre-school is also demonstrated in the ‘dose effect’ by which the more pre-school experience a child has, the more progress they make in the period 3-5 years. Also better quality provision was associated with better child outcomes, and settings that had more qualified staff, especially with a good proportion of trained teachers, showed higher quality and their children made more progress and better social/behavioural gains compared to those attending centres of low quality.
6. Effective pre-school practices in settings
Case studies revealed that where settings viewed educational and social development as complementary and equally important, children made better all round progress. Effective pedagogy includes some structured interactions between adults and small groups of children, traditionally associated with the term ‘teaching’. Also notable in more effective settings was the provision of planned learning environments and ‘sustained shared thinking’ to extend children’s learning.
7. Vulnerable children
Irrespective of level of disadvantage, ‘home’ children (those with little or no pre-school
experience) show poorer cognitive and social/behavioural outcomes at entry to school (and at age 7) than those who attended pre-school and they are more likely to be identified by teachers as having some form of SEN. Disadvantaged children and boys in particular can benefit
8. The importance of the Early years home learning environment (HLE) and support for parents
The quality of the Early years home learning environment (where parents are actively engaged in learning activities with children) promoted intellectual and social development in all children. While parent’s social class and levels of education were related to child outcomes the quality of the Early years home learning environment (HLE) was more important and only moderately associated with social class or mothers’ qualification levels. What parents do is more important than who they are. For this reason pre-school and school settings that do not include parent support and education are missing an important element in raising achievement and enhancing social/behavioural development.
The impact of pre-school at the end of Key Stage 1 (age 7)
The beneficial effects of pre-school remained evident throughout Key Stage 1 (first 3 years of primary school), although effects for some outcomes were not as strong as they had been at school entry, probably because of the increasingly powerful influence of the primary school on children’s development. By the end of Year 2 most children had been in their primary school for three years while the typical child had only been in pre-school for 18 months.
Figures 1a and 1b show the effects of pre-school attendance on children’s National assessments in Reading and Mathematics at age 7, broken down by the social class of their parents. Reading and Mathematics scores are higher for the children in the higher social groupings. However, at each social class level it is clear that the pre-school children have higher scores. What is
[image:23.595.69.465.434.668.2]especially worrying is that the scores of disadvantaged children who did not attend pre-school fall below Level 2, the watershed for skills needed to progress on Key Stage 2 school work (and the national expected level for children of this age).
Figure 1b: Mathematics at Age 7 by SES and pre-school experience
Duration of pre-school
The number of months a child attended pre-school continued to have an effect on their progress through Key Stage 1 (KS1). This effect was stronger for academic or cognitive outcomes than for social/behavioural development.
Quality and effectiveness of pre-school
While pre-school quality was significantly related to children’s Reading and Mathematics at age 6, at age 7 the relationship between quality and academic attainment was weaker, and the effect of quality on all forms of social/behavioural development, including ‘Anti-social’ behaviour, was no longer significant. However, the impact of a pre-school centre’s effectiveness was still significant at the end of Key Stage 1 (KS1) on social/behavioural outcomes.
Vulnerable children
Many children continued to be ‘at risk’ of special educational needs (SEN) at the end of Key Stage 1 (2.3% of the EPPE sample had full SEN statements), with more of the ‘home’ children falling into this group even after taking into account background factors. Multiple disadvantage continued to be associated with poorer outcomes.
Effective pre-school settings
The specific pre-school a child attended shaped their development at school entry. These unique pre-school centre effects continued to influence children’s cognitive and
social/behavioural development throughout Key Stage 1 (KS1). Of course, this does not mean that primary school has no impact on children’s lives – only that the individual pre-schools they attended continued to have an influence. Indeed, the KS1 findings indicate important variations in primary school effects and these are a focus of later sections of this report.
What differentiates the most effective pre-schools?: Evidence from case studies
In choosing settings for case studies we compiled a profile of each setting based on how well it promoted children’s cognitive and social development. The case study settings were chosen from a range identified as ‘good’ to ‘excellent’. The data from 12 effective pre-schools reveal a unique ‘story’ for each centre. For full details on the methodology and findings, see EPPE Technical Paper 10 (Siraj-Blatchford et al., 2003), which provides comprehensive descriptions of the case study settings. The associated, Department for Education and Skills (DfES) funded, Researching Effective Pedagogy in the Early Years (REPEY) study (Siraj-Blatchford et al., 2002) allowed two reception classes to be added the 12 EPPE cases, and this part of the report also draws on these data too (14 cases in total). The aim of the intensive case studies was to tease out specific pedagogical and other practices associated with ‘excellent’ outcomes compared to those centres with ‘good’ or more ‘average’ outcomes.
‘Effectiveness’ used in this study is based on child outcomes, which is regarded as, a necessary but insufficient component of quality as high quality provision requires good quality child care and pedagogical practices.
In the case studies, trained researchers, who were already familiar with the centres, spent two weeks in each centre collecting qualitative data. Data from multiple sources was triangulated with manager and parent interviews, and, extensive naturalistic observations of staff (over 400 hours). In addition systematic focal child observations of children (254 target child observations) were conducted, while they were engaged in various curricular activities (Sylva et al., 2007a).
Findings
Settings were compared in terms of their key quality characteristics e.g. the pedagogy employed, the curriculum on offer, the ethos and the management and organisational strategies. The term pedagogy refers to the instructional techniques and strategies that enable learning to take place. It refers to the interactive process between teacher/practitioner and learner. It includes how aspects of the learning environment (e.g. materials provided, organisational techniques, actions of the family and community etc.) are harnessed to promote learning in children.
Effective pedagogy in the early years was found to involve both the kind of interaction
traditionally associated with the term ‘teaching’ and also the provision of instructive learning play environments and routines. The ‘excellent’ settings provided both teacher-initiated group work and freely chosen, yet potentially instructive play activities. Children’s cognitive outcomes appear to be directly related to the quantity and quality of the teacher/adult planned and initiated focused group work for supporting children’s learning. The research findings support the general approach taken in Curriculum guidance for the foundation stage (QCA/DfEE, 2000). The settings
that viewed cognitive and social development as complementary seemed to achieve the best outcomes. Trained teachers were most effective in their interactions with children, using the most ‘sustained shared thinking’ interactions.
All ‘effective’ settings had strong leadership, characterised by a strong, shared philosophy, and long serving staff. Managers took a strong lead in curriculum and planning particularly in the ‘excellent’ centres, which had a stronger educational focus, placed higher value on the
importance of adult-child interaction, and supported their staff to develop better ways of engaging children. They also encouraged staff development (although training was variable across sectors and local authorities). Where there were trained teachers we found a stronger educational emphasis, with the teachers playing a lead role in curriculum planning and offering positive pedagogical role modelling to less well-qualified staff. There was considerable variation in staff salaries (2003 figures) ranging from £3,000-£7,000 per annum (playgroups) to £15,000-£32,000 (maintained sector).
Using qualitative case study data to elucidate quantitative findings
The case study analysis has gone a long way in providing explanations for the patterns and associations between particular practices (as measured by the ECERS-R and E, see Sylva et al., 1999a; 1999b) and developmental outcomes (see Sammons et al., 2002a; 2003; Sylva et al., 2006). We pay special attention to each of the following:
• Adult-Child Interactions.
• Differentiation and formative assessment.
• Discipline and adult support in talking through conflicts.
•
Parental partnership with settings and the home education environment.• Knowledge of the curriculum and child development
Adult-child interactions
‘Excellent’ settings encouraged relatively more ‘sustained shared thinking’ to provide cognitive challenges and extend children’s thinking (see Siraj-Blatchford et al., 2003). Periods of
‘sustained shared thinking’ may be a necessary pre-requisite for excellent early years practice, especially where this is also encouraged in the home through parent support. The staff in
‘excellent’ settings extended child-initiated interactions, which also extended the child’s thinking. Adult ‘modelling’ was often combined with more sustained periods of shared thinking, and it appeared that open-ended questioning was associated with better cognitive achievement (representing 5% of the questioning used in ‘excellent’ settings).
In ‘excellent’ settings two thirds of activities were child-initiated, but half of these were extended by the adult, and one third adult-initiated. Staff in ‘excellent’ settings regularly extended child-initiated activities without dominating them. ‘Sustained shared thinking’ was most likely to occur when children were interacting 1:1 with an adult or with a single peer partner. Freely chosen play activities often provided the best opportunities for adults to extend children’s thinking. Adults need therefore, to create opportunities to extend child-initiated play as well as teacher-initiated group work, as both have been found to be important vehicles for promoting learning.
The most qualified staff (almost all trained teachers in our study) provided children with more experience of academic activities (especially language and Mathematics) and provided children with higher cognitive challenges. They also provided the most direct teaching (instruction through demonstration, explanation, questioning, modelling etc.) and used more ‘sustained shared thinking’. Furthermore, we found that less well qualified staff functioned as significantly better pedagogues when working alongside qualified teachers.
Differentiation and formative assessment
There was a positive association between curriculum differentiation, formative assessment, and the process of selecting activities to provide the cognitive challenges. Adults 'modelling' (or demonstrating) positive attitudes, behaviours etc., was a valuable pedagogic strategy. The best settings kept good records and engaged with parents about their child’s progress on a weekly or monthly basis. However, we found little evidence of detailed formative feedback to children
Discipline and adult support in talking through conflicts
The ‘excellent’ settings adopted discipline/behaviour policies that involve staff in supporting children in rationalising and talking through their conflicts.
Parental partnership
Where settings shared educational aims with parents, and pedagogic efforts were made by
parents at home to support children, sound learning took place. The ‘excellent’ settings shared child-related information between parents and staff, and parents were often involved in decision making about their child’s learning.
Knowledge of the curriculum and child development
Practitioners’ knowledge and understanding of the curriculum are vital. A good grasp of the appropriate ‘pedagogical content knowledge’ is just as important in the early years as at any stage of education. Moreover we found, crucially, that the most ‘effective’ educators also
Section 2: How EPPE 3-11 studied children’s development
Summary of Key Messages
The same 3,000 children were studied to the end of Key Stage 2 (age 11) for both cognitive and social/behavioural development (at age 10 and 11).
• All primary schools attended by EPPE children were rated for ‘academic effectiveness’ using national assessment data.
• Children’s self perceptions were studied alongside cognitive and social-behavioural outcomes.
• Classroom observations were conducted in a sub-set of classrooms.
•
Analytical strategy takes account of child, family, the Early years home learning environment (HLE), pre-school and primary school factors.This section has three main components. The EPPE 3-11 sample is described with its 2,500 cognitive and social/behavioural child development trajectories and how the project studied the children’s views and perceptions. Then a description is provided about how the project
investigated what influences children’s developmental trajectories, such as home, pre-school, primary school processes and neighbourhoods. Finally, this section shows how the EPPE 3-11 analyses deal with interactions between different key child experiences (e.g., home, pre-school and primary school), as well as dealing with questions of characteristics of effective classrooms, resilience and out-of-school learning. These three sections comprise the methodology.
Design of the study
EPPE 3-11 is a mixed method longitudinal study combining quantitative and qualitative methods. It is interdisciplinary in using constructs and methods drawn from a range of disciplines including education and psychology.
Aims of the research for Key Stage 2 (KS2)
The EPPE 3-11 aims were developed from the findings of the earlier pre-school and Key Stage 1 (KS1) EPPE study. They were:
a) To investigate the continuing effects of pre-school to the end of Key Stage 2 b) To describe the characteristics of ‘effective’ primary classrooms and schools c) To identify factors that contribute to resilient and vulnerable pathways in the EPPE
children
d) To describe the contribution of ‘out-of-school learning’ (homes, communities, internet) to
children’s development.
The Sample
i) The child sample
Over 2,800 children were recruited around the age of 3+ at their pre-school settings together with over 300 ‘home’ children without pre-school experience recruited at the start of school (see Sammons et al., 1999). During the primary school phase of the study there were over 2,600 children still in the study.
ii) The primary school sample
All primary schools that contain EPPE 3-11 children (800+ schools approximately 100 local authorities and 2,600 children)
During primary school, data were collected from various sources: EPPE pupils filled out questionnaires (response rate was 80% of the original sample of 3172 children), their parents were sent questionnaires (response rate was 70%) and teachers of EPPE pupils completed a questionnaire about the EPPE pupil (response rate was 85%). Using all data on the longitudinal sample of EPPE 3-11 children, and their pre-schools and schools, the contribution of
Sub-sample of primary schools with EPPE 3-11 children for classroom observations in Year 5 (125 schools, 1,160 children)
Only a subset of schools attended by EPPE 3-11 children were recruited for classroom observations and teachers filled out questionnaires providing information on classroom and school processes (100% response rate). This was supplemented by questionnaires completed by the classmates (peers) of the EPPE children (6,000 children).
All primary schools in England (16,000 schools, 600,000 children)
In order to establish the academic effectiveness of each of the schools an EPPE 3-11 child attended, we estimated their ‘value added’ to children’s academic attainment using the government’s database of National assessment results at KS1 and KS2. Using data from all state primary schools, and all their pupils, value added multilevel modelling was employed to estimate the effectiveness of each school in England for English, Mathematics and Science as well as average attainment. Within this database it was possible to create an ‘academic effectiveness’ score for each school that EPPE 3-11 children attended, taking account of background factors and prior attainment.
Child trajectories
Many child trajectories were created for each child’s progress over time; some were academic trajectories (e.g., Mathematics) while others related to social/behavioural development (e.g. ‘Pro-social’ behaviour).
Cognitive outcomes
Taking account of developmental change, the study uses different cognitive assessments:
• Start of pre-school: British Ability Scales (BAS, Elliot, Smith & McCulloch, 1996) assessments
• Start of primary school: British Ability Scales (BAS) assessments, plus Pre-reading.
• Year 1: NFER-Nelson Primary Reading Level 1 and Mathematics 6 tests
• Year 2: Key Stage 1 National Assessments: Reading and Mathematics
• Year 5: NFER-Nelson Primary Reading Level 2 and Mathematics 10 tests
• Year 6: Key Stage 2 National Assessments: Mathematics and English – a combined measure of Writing, Spelling and Reading (via comprehension).
Note that the measure of Pre-reading used when children entered reception class as well as measures of Reading and English attainment can all be regarded as measures of Literacy. Similarly the measure of Early number concepts (from BAS) used when children entered reception class and measures of Mathematics attainment can be regarded as measures of Numeracy.
NFER-Nelson tests at ages 6 and 10
To ensure comparability over time, an internal standardisation and normalisation procedure was applied, taking account of age effects within the school year group. The scores for the EPPE 3-11 sample were internally standardised to a mean of 100 and a standard deviation of 15. Therefore all children scoring better than 100 at a certain time point are scoring above the average attainment level expected for their chronological age (belong to the upper half of the sample of that assessment, controlling for age effects). Due to the use of internally standardised attainment scores, the scores can only be used to investigate the progress or improvement of certain groups of children relative to the total EPPE 3-11 sample, but cannot be used to show absolute progress over time. For details of the standardisation and normalisation procedure see
Sammons et al., (2007a, Appendix 2).
National Assessments at ages 7 and 11
In addition to test levels, data were also collected on children’s individual test scores within levels. This allowed the creation of more finely differentiated outcome measures (referred to as decimalised levels) for the multilevel analysis. For children with a valid level for the National assessment test taken, their decimalised score was calculated as follows:
Decimalised score = level of test achieved + {(raw score – lowest valid raw score for corresponding level) / highest valid raw score possible for the level}
For further details of the decimalisation procedure see Sammons et al., (2004a), Appendix 3. To ensure comparability over time, an internal standardisation and normalisation procedure was applied that takes account of age effects within the school year group. The scores are internally standardised to a mean of 100 and a standard deviation of 15, as for other cognitive
assessments. For information on term of birth effects see Section 8.
Social/behavioural outcomes
Beginning at age 6 we used an extended version of the Strengths and Difficulties Questionnaire (Goodman, 1997) to measure different features of children’s social/behavioural development in Years 1, 2, 5 and 6. The social/behavioural child profile was completed by a teacher who knew the EPPE 3-11 child well. Principal component analysis and confirmatory factor analysis were used to identify the main underlying dimensions of social behaviour in Year 6 and to see if the social behavioural factors were similar to Year 5 results (see Sammons et al., 2007b). The Year 5 findings were replicated at Year 6 in defining the main four aspects of social behaviour: ‘Self-regulation’, ‘Pro-social’ behaviour, ‘Hyperactivity’ and ‘Anti-social’ behaviour. Specific
questionnaire items associated with each of the four social/behavioural dimensions are presented in Box 1.
Box 1: Items associated with each social/behavioural dimension in Year 6 (age 11)
‘Self-regulation’ (α=0.87)
1. Likes to work things out for self; seeks help rarely 2. Does not need much help with tasks
3. Chooses activities on their own 4. Persists in the face of difficult tasks
5. Can move on to a new activity after finishing a task 6. Open and direct about what she/he wants
7. Confident with others
8. Shows leadership in group work 9. Can take responsibility for a task
‘Pro-social’ behaviour (α=0.87)
1. Considerate of other people's feelings
2. Shares readily with other children (treats, toys, etc.) 3. Helpful if someone is hurt, upset or feeling ill 4. Kind to younger children
5. Often volunteers to help others (teachers, other children)
6. Offers to help others having difficulties with a task 7. Sympathetic to others if they are upset
8. Apologises spontaneously
‘Hyperactivity’ (α=0.87)
1. Restless, overactive, cannot stay still for long 2. Constantly fidgeting or squirming
3. Easily distracted, concentration wanders 4. Thinks things out before acting
5. Sees tasks through to the end, good attention span 6. Quickly loses interest in what she/he is doing 7. Gets over excited
8. Easily frustrated
9. Impulsive, acts without thinking
10. Can behave appropriately during less structured sessions
11. Fails to pay attention 12. Makes careless mistakes
‘Anti-social’ behaviour (α=0.75)
1. Often fights with other children or bullies 2. Often lies or cheats
3. Steals from home, school or elsewhere 4. Vandalises property or destroys things
5. Shows inappropriate sexual behaviour toward others
6. Has been in trouble with the law
Scores on each social/behavioural dimension were calculated as a mean of all items
corresponding to each dimension. Higher scores indicate better behaviour for ‘Self-regulation’ and ‘Pro-social’ behaviour; lower scores indicate better behaviour (lower incidence from teacher ratings) for ‘Hyperactivity’ and ‘Anti-social’ behaviour. Note that scores on all social/behavioural measures are skewed towards the more desirable end of the scale. This is especially important for the more negative aspects of social behaviour where raised scores indicating potential maladaptive behaviour (using the cut-off point suggested by Goodman) are only evident for a very small minority of children (only 3.9% for ‘Anti-social’ behaviour and 7.4% for ‘Hyperactivity’). Similarly, almost ten per cent (9.8%) of children show extremely low levels of ‘Pro-social’
behaviour and just under twelve per cent (11.5%) of children show very low levels of ‘Self-regulation’ in Year 6. Very few (only 1.9%) children had abnormal scores on both ‘Hyperactivity’ and ‘Anti-social’ behaviour, and even fewer (only 1.2%) had abnormal scores on all four aspects of social behaviour. Most children are rated positively for these features of social behaviour, and the results are in line with other research on social behaviour and with the distribution of scores for social/behavioural measures for the EPPE 3-11 sample at younger ages.
Self-perceptions and children’s views
Information about children’s self-perceptions and experiences of school was collected through a self-report questionnaire in Year 2 and Year 5. The items were derived from a study of existing measures (e.g., Grosin and McNamara, 2001; Teddlie and Stringfield, 1993) and adapted for use with this age group. Although measures of children’s self-perceptions were collected in both Year 2 (age 7) and Year 5 (age 10) of primary school, pupils’ views of their learning environment were collected in Year 5 (age 10) only.
Self-reported experiences of school at the end of Year 2
Statistical analyses were used to explore the variation in children’s responses to the
questionnaire items and to see whether robust measures of their attitudes and self-perceptions could be identified. The results revealed a number of underlying dimensions (factors) (for further descriptive details see Sammons et al., 2008a, Appendix 2). Four main factors were found through the combined principal components analysis followed by confirmatory factor analysis (see Box 2).
Box 2: Items associated with each pupils’ self-perception dimension in Year 2 (age 7)
‘Enjoyment of school’ (α=0.69) 1. I like school
2. I like answering questions in class 3. I like Reading
4. I like doing number work 5. I like Science
6. School is interesting
‘Behaviour self-image’ (α=0.62) 1. I try to do my best at school 2. I am kind to other children 3. I behave well in class
‘Academic self-image’ (α=0.57) 1. I am clever
2. My teacher thinks I am clever 3. I do my work properly
‘Alienation’ (α=0.52) 1. I get tired at school 2. I get fed up at school 3. I get angry at school