1
Prediction of Sugar Content along the Height of
Sugarcane Internodes Using Vis/NIR
Nazmi Mat Nawi
1, 3, Guangnan Chen
1, Troy Jensen
1, 2, and Craig Baillie
2Faculty of Engineering and Surveying, University of Southern Queensland, Toowoomba, QLD 4350, Australia
National Centre for Engineering in Agriculture (NCEA), University of Southern Queensland, Toowoomba, QLD 4350, Australia
Department of Biological and Agricultural Engineering, Faculty of Engineering, Universiti Putra Malaysia, 43400 Selangor, Malaysia
Corresponding author: E-mail:[email protected]
Abstract
Sugarcane is a tall crop with sugar distribution varying along the height. Using Vis/NIR spectrometer, an initial measurement was carried out to investigate the sugar distribution along the height of internodes. Spectral data was collected from 25 internode samples. Each internode sample was further cut into four sections and scanned based on cross-sectional scanning (CSS) and skin scanning (SS). It was found that for the cross-sectional scanning (CSS), the coefficient of determination (R2) varied between 0.78 and 0.89, achieving the highest value around the middle of the internode. For the skin scanning (SS), the coefficient of determination (R2) varied between 0.81 and 0.91, also achieving the highest value around the middle of the internode. The results suggested that quality prediction based on non-juice sample is feasible using a spectrometer.
Keywords: internode, sugarcane, sugar content, spectroscopic method
1. Introduction
Sugarcane (Saccahrum spp.) is an important crop in Australia with the production value ranging from AUD$1.5 to 2.5 billion per year (Anon., 2011). Recently, substantial emphasises have been given to the use of precision agriculture (PA) technologies in sugarcane industry to increase its productivity and quality level. However, current PA technologies can only monitor the yield and have no ability to measure the product quality. Common technologies to measure sugarcane quality in a laboratory such as refractometric, polarimetric, chromatographic and spectroscopic methods require juice samples for the quality measurement (McCarthy, 2003; Mehrotra & Seisler, 2003). However, obtaining sufficient juice samples in the field is very difficult, especially during harvesting. Thus, a new prediction method based on a non-juice sample is required (Nawi et al., 2012). Nawi et al. (2012) also suggested that the spectrometer can potentially be used to predict sugar content based on fresh stalk scanning in the field.
2
tougher and contain less moisture than the internodes, it is expected that the sugar content in the two areas would be different. Therefore, it is anticipated that a spectra scanning to predict sugar content on billet samples would produce different accuracy depending on where the billet was scanned.
Due to the variation of sugar content along the stalks, it is also important to know the sugar variation across the internode. Thus, this study was initiated to obtain data of variations of sugar content (Brix) over the length of sugarcane internode, especially between the node and the internode. This study would also determine the distribution of variation (in percentage) across the individual internode. By knowing the distribution, the accuracy of the prediction model would be better understood. The finding of this study would also help us to design better system for in-field measurement system. Furthermore, the specific objectives of this study were to determine the difference between cross sectional and skin scanning and to quantify the difference of spectral responses along the individual internode.
2. Materials and methods
2.1 Sample Preparations
A total of 25 individual internodes were extracted from sugarcane stalk samples. Then, each internode sample was cut into four sections representing the node areas and the middle of the internodes (Fig.1). Each section was labeled ‘S’ for skin scanning and ‘C’ for cross sectional scanning. The labeling followed the sequence from SI to S4, from the bottom to the top of an internode. Each section was scanned on skin and cross-sectional surface using visible/ near-infrared (Vis/NIR) spectroradiometer to determine its sugar content. The Vis/NIR is manufactured by FieldSpec ® ASD. After the spectra acquisition, all of the sections representing individual internode were squeezed to get representative juice sample for Brix measurement. The Brix measurement was made using a Pen-Pro handheld digital Brix meter (model N-1, Atago Co., Ltd, Japan).
FIGURE 1: Photo of internodes cut into four portions
2.2 Spectral Acquisitions
3
Spectral Devices, Boulder, USA) designed with a Graphical User Interface. The spectral measurement was carried out in a dark room with closed curtains where a halogen lamp was the only light source used (Lowell Pro‐Lam 14.5 V tungsten bulb, Ushio Lighting, Inc., Japan). The lamp was placed about 300 mm away from the measurement samples. Relative reflectance spectra were calculated by dividing stalk radiance with reference radiance from a spectralon white reference panel for each wavelength.
2.3 Spectral Data Preprocessing
In order to avoid low signal-to-noise ratio, the first and last 75 nm data points were removed from the spectral data. Therefore, only the regions of wavelengths (400–1000 nm) were used for the model calculations. The reflectance spectra were transformed into ASCII format by using the ASD ViewSpecPro software (Analytical Spectral Devices, Boulder, USA).
Before the calibration, the spectral data was preprocessed for optimal performance. Pretreatment of spectral data is a key part of spectral analysis and can improve the accuracy. In this study, the raw spectral data was converted to the multiplicative scatter correction (MSC). MSC technique is the most popular normalisation technique offered by most chemometrics software packages (Næs et al., 2004). MSC is used to compensate for additive (baseline shift) and multiplicative (tilt) effects in the spectral data. The pretreatments were implemented by “The Unscrambler V 9.2” (CAMO PROCESS AS, Oslo, Norway). Partial Least Squares (PLS) method was used to interpret the spectra and develop both calibration and prediction models for quality prediction. In this paper, 10 principle components were used for both calibration and prediction models. The spectral data was calibrated against the Brix value of each internode.
2.4 Calibration and Validation Sets
A total of 100 scans were undertaken for both CSS and SS. After removing outliers, only 98 useful spectra data remained. Then, each sample was divided into two sets. One set (75%) was used to develop a prediction equation (calibration set) and another part (25%) was used to validate the predictive equation (validation set). Samples for validation were selected by taking one of every four samples from the entire sample set, taking care to ensure that each set included samples that covered the entire range spectra.
3. Results and Discussion
3.1 Comparison between Cross Sectional and Skin Scanning
4
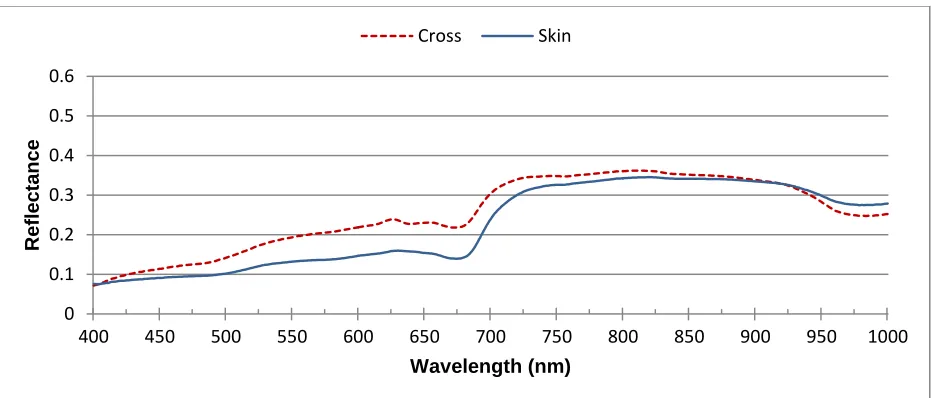
FIGURE 2: A difference between skin and cross sectional scanning
[image:4.612.74.545.425.729.2]The quality of both calibration and prediction models represented by the value of correlation of determination (R2) for both sample types are shown in Table 1. It can be seen that SS had higher R2 values for both calibration and prediction models. This is probably because of the nature of the skin surface which is homogenous in terms of skin roughness and color. The surface of the stalk is coated with a thin protective layer of waxy material which varies in amount with the type of cane, and is moisture resistant (Barnes, 1953). A cross-section of the stalk is generally cylindrical (oval for some varieties) and the diameters vary considerably, from 12 to 50 mm.
TABLE 1: The quality of models for both sample types
Sensor Sample n Calibration Prediction
n R2 RMSEC n R2 RMSEP
Vis/NIR CSS 98 74 0.87 0.271 24 0.71 0.48
SS 99 75 0.90 0.25 24 0.80 0.36
n = the number of samples
3.2 Results for Cross Sectional Scanning (CSS)
0 0.1 0.2 0.3 0.4 0.5 0.6
400 450 500 550 600 650 700 750 800 850 900 950 1000
Ref
lec
tance
Wavelength (nm) Cross Skin
0 0.1 0.2 0.3 0.4 0.5 0.6
400 450 500 550 600 650 700 750 800 850 900 950 1000
Ref
lec
tance
Wavelength (nm)
5
FIGURE 3: A spectral data pattern for cross sectional scanning
Figure 3 shows the difference of spectral curves for four different CSS. The calibration model used to generate R2 values in Table 2 was taken from Table 1 for CSS. The R2 and root mean square of error for calibration (RMSEC) for calibration model were 0.87 and 0.27 respectively. The curve of the C1 showed evident difference from others cutting sections (Fig. 3). C1 also had the lowest R2 values compared to other sections (Table 2). The difference was probably because the C1 represented the hard portion (node) of the internode. Around the node, there is less moisture with more fibre (Huang et al., 2005). The difference was also probably due to the difference of surface roughness and moisture content. The variation of R2 values for CSS between node and the middle of internode were 14%.
TABLE 2: Brix prediction values of CSS for each section
Section Vis/NIR
R2 RMSEP
C1 0.78 0.39
C2 0.89 0.27
C3 0.82 0.34
C4 0.88 0.25
3.3 Results for Skin Scanning (SS)
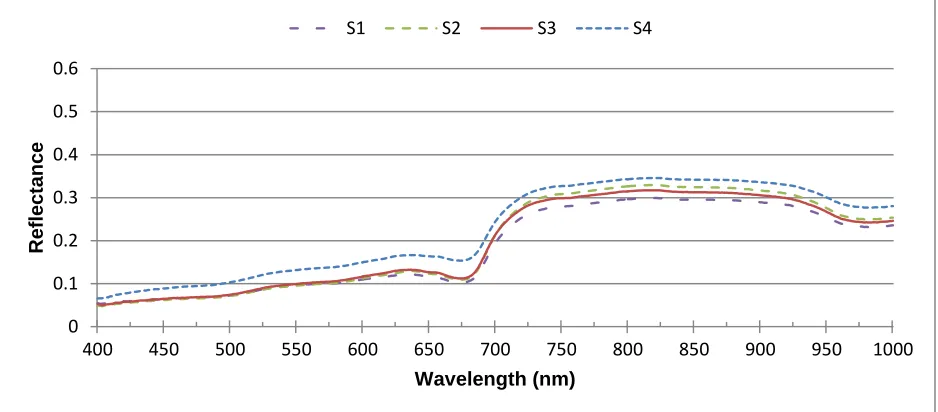
[image:5.612.74.543.411.617.2]Figure 4 shows the difference of spectral curves for SS of an individual internode. The curve of the first SS (S1) showed obvious difference from other skin sections. The calibration model used to generate prediction values in Table 3 was taken from Table 1 for SS. The R2 and RMSEC for calibration model were 0.90 and 0.25 respectively.
FIGURE 4: A spectral data pattern for skin scanning
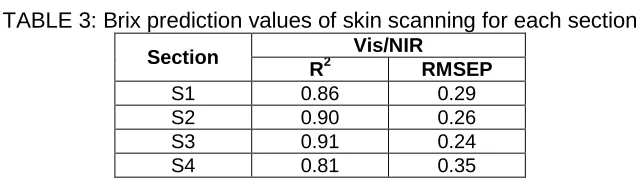
Table 3 showed that S2 and S3 had higher R2 value for prediction model. Therefore, in the field, these two sections must be the primary aim for SS. The S1 and S4 have less correlation values because these two sections located close to the node. Around the middle of the internodes, the R2 for the SS was 0.91. Around the node areas, the R2 for SS was 0.86. While the variation of r2 values for SS between node area and the middle of internode were about 6%.
0 0.1 0.2 0.3 0.4 0.5 0.6
400 450 500 550 600 650 700 750 800 850 900 950 1000
Ref
lec
tance
Wavelength (nm)
6
TABLE 3: Brix prediction values of skin scanning for each section
Section Vis/NIR
R2 RMSEP
S1 0.86 0.29
S2 0.90 0.26
S3 0.91 0.24
S4 0.81 0.35
4. Conclusion and Recommendations
This study has shown that the spectroscopic method can be applied for both CSS and SS scanning of sugarcane samples to predict the value of sugar content (Brix). The results have shown that the Brix prediction accuracy varied along the height of the internode. The relatively low prediction values for all models were due to the sugar variation along the height of internode samples, reflecting the heterogeneous nature of the raw cane stalk. Overall, SS would give better correlation between Brix and spectra data than CSS. Thus, if spectrometer is to be used in the field for non-juice sample scanning, skin scanning would be a better option to predict Brix values. If SS would be adapted, the area around the middle of the internode should also be targeted in order to achieve high R2 value. If the CCS would be adapted, the scanning on the node must be avoided because the area would give low R2 value compared to other sections. Further data collections with more sample number are expected to improve the accuracy of the model predictions.
5. Acknowledgements
The authors acknowledge the financial supports provided by Ministry of Higher Education, Malaysia and National Center for Engineering in Agriculture (NCEA), Toowoomba, Australia. The authors also thank BSES Limited, Bundaberg for providing samples and equipment.
6. References
Anon. (2011). Canegrowers annual report for 2010/2011, Australia.
Barnes, A. C. (1953). Agriculture of the sugarcane. Leonard Hill Limited, (Chapter 1).
Huang, L. H, Imou, K, Kaizu, Y, & Yokoyama, S. (2005). System for automatic separation of sugar cane tops. Transactions of the ASAE, 48, 4, 1441−1448.
Nawi, N. M., Jensen, T., & Chen, G. (2012). The application of spectroscopic methods to predict sugarcane quality based on stalk cross-sectional scanning. Journal of American Society of Sugar Cane Technologists, 32, 16 -27.
McCarthy, S. G. (2003). The integration of sensory control for a sugar cane harvester. PhD Thesis. Faculty of Engineering and Surveying, University of Southern Queensland.
Mehrotra, R. & Siesler, H. W. (2003). Application of mid infrared/near infrared spectroscopy in sugar industry. Applied Spectroscopy Reviews. 38, 307–354.