Monitoring Damage in Advanced Composite
Structures Using Embedded Fibre Optic Sensors
by
Gayan Chanaka Kahandawa
A dissertation submitted for the award of
DOCTOR OF PHILOSOPHYSupervised by
Dr Jayantha Ananda Epaarachchi Associate Professor Hao Wang
Faculty of Engineering and Surveying University of Southern Queensland Toowoomba, QLD, 4350, Australia
Abstract
Fibre Bragg Grating (FBG) sensors are extremely sensitive to changes of strain, and are therefore an extremely useful candidate for Structural Health Monitoring (SHM) systems of composite structures. Sensitivity of FBGs to strain gradients originating from damage was observed as an indicator of initiation and propagation of damage in composite structures. To date there have been numerous research works done on distorted FBG spectra due to damage accumulation under controlled environments. Unfortunately, a number of related unresolved problems remain in FBG-based SHM systems development, making the present SHM systems unsuitable for real life applications. The work presented in this thesis highlights the application difficulties in using FBG for the SHM of advanced composite structures. The breakthrough technologies presented in this thesis resolve those major problems.
As a solution to cope with complicated FBG responses, a novel signal processing approach was introduced using Artificial Neural Networks (ANN). To accommodate complete FBG spectral data into an ANN, a novel FBG data decoding system was developed. The Fixed FBG Filter Decoding System (FFFDS), along with an ANN was found to be an excellent tool for addressing real-time data input to in-situ FBG-based SHM systems. Several experimental studies have been used to investigate the decoding system and performance of the ANN for damage detection in composite structures. The proposed system has identified a delamination within 0.01% error levels.
been used to define distortion of FBG spectra, and have been successfully used for damage identification and quantification in composite structures.
A case study was also conducted to develop optimum the FBG sensor network for efficient damage detection in a composite structure. A detailed procedure was proposed for the optimization of FBG networks. The proposed optimization procedure extensively used finite element analysis (FEA), thereby eliminating expensive and time consuming prototype component testing for optimized sensor locations.
Certification of Dissertation
I certify that the ideas, experimental work, results, analysis and conclusions reported in this dissertation are entirely my own effort, except where otherwise acknowledged. I also certify that the work is original and has not been previously submitted for any award, except where otherwise acknowledged.
……….. / /
Signature of Candidate Endorsed:
……….. / /
Signature of Supervisor/s
……….. / /
Acknowledgement
I would like to extend my deepest gratitude to my supervisor Dr Jayantha Epaarachchi for giving me the opportunity to undertake a PhD at the University of Southern Queensland (USQ). I am greatly indebted to him for his continuing confidence in me as well as for giving me constant support throughout these years. I am also thankful to my associate supervisor, Assoc. Prof Hao Wang. Discussions with him helped me better understand the overall research environment. His valuable suggestions were essential to improving the quality of this research.
I would like to thank The Boeing Company, for the financial and technical assistance given to this project. The support of Mr Peter Birt and Mr David Followell is gratefully acknowledged.
always believed in my capabilities. Thanks also to my son, Haridu and daughter, Hesara for sacrificing their play time and allowing me to work overtime.
Associated Publications
US Patent Application
Gayan Chanaka Kahandawa Appuhamillage, Jayantha Epaarachchi, Hao Wang (2012). SIGNAL MONITORING SYSTEM AND METHODS OF OPERATING SAME
Journal
Kahandawa, G., Epaarachchi, J., Wang, H., & Lau, K.T. (2012). Use of FBG sensors for SHM in aerospace structures. Photonic Sensors, 2(3), 203-214. doi: 10.1007/s13320-012-0065-4
Kahandawa, G., Epaarachchi, J., Wang, H., Followell, D. & Birt, P (2012) Use of fixed wavelength Fibre-Bragg Grating (FBG) filters to capture time domain data from the distorted spectrum of an embedded FBG sensor to estimate strain with an Artificial Neural Networks. Sensors and Actuators A: Physical (Accepted)
Kahandawa, G., Epaarachchi, J., Canning, J., & Lau, K.T. (2013). Novel approach for Optimisation of fibre Bragg grating sensor network for efficient damage detection in composite structures. Journal of Multifunctional Composites (Accepted)
Kahandawa, G., Epaarachchi, J., Wang, H., & Lau, K.T. (2012). Concept of Distortion Index for assessment of damage accumulation in a composite structures using spectral distortion of embedded FBG sensors. Structural Health Monitoring (under review)
Kahandawa, G., Epaarachchi, J., Wang, H., Canning, J., & Lau, K.T. (2012). Extraction and processing of real time strain of embedded FBG sensors using a fixed filter FBG circuit and an artificial neural network. Measurment (under review)
Refereed Conference Proceedings
Kahandawa, G. C., Epaarachchi, J. A., & Wang, H. (2011). Identification of distrotions to FBG spectrum using FBG fixed filters. Paper presented at the ICCM18, Jeju Island, Korea.
Kahandawa, G. C., Epaarachchi, J. A., Wang, H., & Canning, J. (2010). Effects of the self distortions of embedded FBG sensors on spectral response due to torsional and combined loads. Paper presented at the APWSHM3, Tokyo, Japan.
Kahandawa, G. C., Epaarachchi, J. A., Wang, H., Followell, D., Birt, P., Canning, J., & Stevenson, M. (2010). An investigation of spectral response of embedded Fibre Bragg Grating (FBG) sensors in a hollow composite cylindrical beam under pure torsion and combined loading. Paper presented at the ACAM 6, Perth, Australia. Kahandawa, G.C., Epaarachchi, J.A., Wang, H, & Aravinthan, T (2010). The developments of structural health/integrity monitoring systems using FBG sensors at CEEFC of USQ. Paper presented at Southern Region Engineering Conference (SREC 2010), Toowoomba, Australia.
Kahandawa, G.C., Hafizi, Z.M., Epaarachchi, J.A., & Lau, K.T. (2012) Detecting delamination in a composite structure using an Embedded FBG – AE hybrid System. Paper presented at the ACAM 7, Adilade, Australia.
Kahandawa, G.C., Epaarachchi, J.A, Wang, H., & Lau, K.T., (2012). Prediction of obsolete FBG sensor using ANN for efficient and robust operation of SHM systems. Paper presented at the APWSHM 2012, Melbourne, Australia.
Kahandawa, G.C., Epaarachchi, J.A., Wang, H., & Lau, K.T. (2012). Use of network of FBG sensors for efficient detection of delamination in FRP structures. Paper presented at the ACCM8, KualaLumpur, Malaysia.
Table of Contents
Abstract………..………..i
Certification of Dissertation ………...……..iii
Acknowledgement………...v
Associated Publications………vii
Table of Contents………...ix
Table of Figures………...xvii
List of Tables………...xxv
1. Introduction ... 1
1.1 Background and Significance ... 1
1.2 Objectives ... 7
1.3 Innovation and expected outcomes ... 8
1.4 Outline of the thesis ... 9
2. Damage in composite structures ... 11
2.1 Introduction ... 11
Glass fibres ... 13
2.1.1 Carbon fibres ... 13
2.1.2 The matrix of composites ... 14
2.1.3 2.2 Applications of Composites ... 16
2.3 Failure modes of Composites... 17
Delamination ... 20
2.4.1.1 Equivalent Single Layer (ESL) modelling ... 22
2.4.1.2 Layer Wise (LW) modelling ... 23
Modelling composite structures using FEA ... 24
2.4.2 2.4.2.1 Continuum shell elements ... 25
Modelling plated structures ... 27
2.4.3 2.4.3.1 Sample Fabrication and experimentation ... 28
2.4.3.2 FEA model of the plate ... 30
2.4.3.3 Results and validation of the FEA model ... 33
Modelling tabular structures ... 34
2.4.4 2.4.4.1 Fabrication of the specimens ... 35
2.4.4.2 Experimentation and results ... 37
Modelling of a complex structure: helicopter blade shank fitting ... 40
2.4.5 2.4.5.1 Fabrication of the specimen ... 43
2.4.5.2 Experimentation ... 44
2.4.5.3 Results and verification of the FEA model ... 45
2.5 Modelling damage in composite structures: Delamination ... 47
Modelling of plate with a delamination ... 49
2.5.1 2.5.1.1 FEA Results ... 51
3. Structural health monitoring using FBG sensors ... 55
3.1 Introduction ... 55
Fabrication of FBG sensors ... 60
3.2.2 3.2.2.1 Apodisation of FBG sensors ... 65
Principle of Bragg Grating ... 66
3.2.3 3.3 Embedded FBG sensors ... 67
Embedding process ... 68
3.3.1 3.4 Effects on embedded FBG sensors ... 72
Curing effect on FBG sensors ... 72
3.4.1 Loading effect of FBG sensor ... 75
3.4.2 3.4.2.1 Effect of transverse loading on refractive index of FBG sensor... 76
3.5 Self-distortion of the FBG sensor ... 79
Torsional loading of FBG sensor: Experimental verification ... 80
3.5.1 3.5.1.1 Fabrication of the specimens ... 80
3.5.1.2 Experimentation ... 83
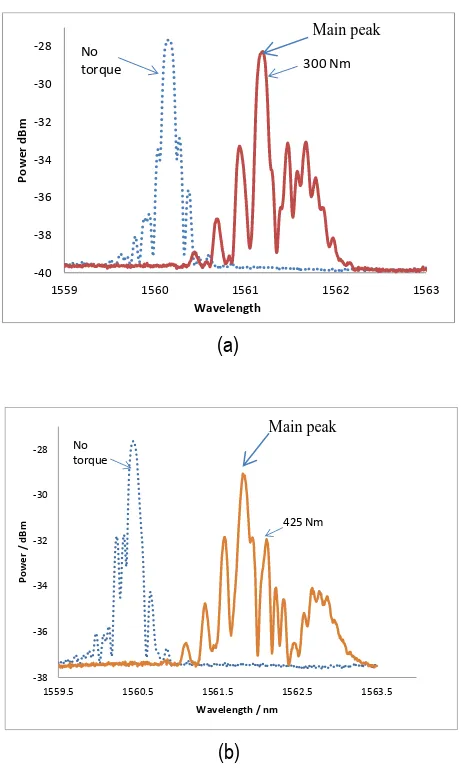
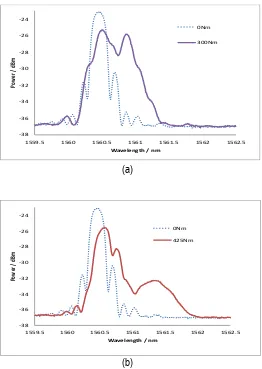
3.5.1.3 Results and discussion ... 86
3.6 Distortion of the embedded FBG sensor spectra ... 94
Concept of Distortion Index ... 95
3.6.1 3.6.1.1 Distortion (Ds) ... 96
3.6.1.2 Distortion Index, DI ... 97
Experimental Investigation of the Distortion Index ... 98
3.6.2 3.6.2.1 Fabrication of specimens ... 99
3.6.2.2 Results and Discussion ... 101
3.7 Damage detection in composite structures using FBG sensors ... 106
4. Decoding FBG sensor response spectra using fixed wavelength FBG filters and use of Artificial Neural Networks for damage detection ... 109
4.1 Introduction ... 109
4.2 ANN based damage detection ... 112
Introduction to Neural Networks ... 113
4.2.1 4.2.1.1 Characteristics of ANN ... 114
4.2.1.2 Engineering of Brains ... 114
4.2.1.3 Neuron Physiology ... 115
Artificial Neural Networks (ANN) ... 117
4.2.2 4.2.2.1 Basic Model of a Neuron ... 118
4.2.2.2 Learning in ANN ... 119
4.2.2.3 Neural Network Topologies ... 120
4.2.2.4 Multilayer ANN ... 121
4.2.2.5 The Backward Propagation Algorithm ... 123
4.3 Use of ANN in SHM of composite structures ... 125
4.4 Novel method to decode FBG spectral data as ANN input: Fixed filter FBG decoding system (FFFDS) ... 128
4.5 Application of Fixed wavelength filters and ANN for FBG data processing and damage identification ... 132
4.6 Post-processing of FFFDS data using ANN ... 135
4.7 Experimental study of the FFFDS with ANN ... 137
Case 1: Prediction of strain ... 138
4.7.1 4.7.1.1 Experimental Results ... 141
4.7.1.2 Analysis ... 142
4.7.1.3 Results and Discussion ... 143
4.7.1.4 Conclusions ... 146
Case 2: Prediction of hole diameter ... 147
4.7.2 4.7.2.1 Sample Fabrication ... 147
4.7.2.2 Experimental procedure ... 148
4.7.2.3 Experimental Results ... 149
4.7.2.4 Analysis ... 149
4.7.2.5 Results and Discussion ... 151
4.7.2.6 Conclusions ... 151
Case 3: Prediction of Delamination Growth ... 152
4.7.3 4.7.3.1 Sample Fabrication and Experimental procedure ... 152
4.7.3.2 Experimental Results ... 154
4.7.3.3 Analysis ... 156
4.7.3.4 Results and Discussion ... 157
4.7.3.5 Conclusions ... 158
Concluding remarks for the FFFDS ... 159
4.7.4 4.7.4.1 Existence of defect ... 159
4.7.4.3 Defect size and growth ... 160
4.8 Working range of FFFDS ... 161
4.9 Using multiple FBG sensors with FFFDS ... 163
5 Optimisation of the FBG sensor network ... 167
5.1 Introduction ... 167
5.2 Identification of the locations of FBG sensors in a composite structure to detect damage using FEA simulation ... 169
5.2.1. The process of optimisation of FBG sensor network ... 169
5.2.2. Case study: Optimisation of FBG sensor network in a helicopter blade base structure ... 172
5.2.2.1. FEA model of the structure ... 173
5.2.2.2. Modelling delamination in the helicopter blade base structure .. 177
5.2.2.3. Analysis of FEA data ... 178
5.2.2.4. Identification of delamination using FBG data generated by FEA ... 180
5.2.3. Prediction of failed (obsolete) FBG sensor ... 182
5.2.3.1. Estimation of obsolete FBG sensor reading with multiple FBG sensors ... 182
5.3 Experimental validation of the optimised system – estimation of obsolete sensor ... 186
5.3.1. Fabrication of the specimen ... 186
5.3.3. Results and discussion ... 188
5.4 Conclusions for optimisation of FBG sensor network ... 191
6. Conclusions ... 193
6.1 Principal achievements ... 193
6.2 Summary ... 196
6.3 Future work ... 198
References ... 201
Table of Figures
Figure 1-1: Distorted FBG spectra due to multiple effects ... 5
Figure 1-2: Novel approach to FBG-based SHM systems ... 6
Figure 2-1: Composite materials ... 11
Figure 2-2: Levels of analysis for damage in composites ... 18
Figure 2-3: Composite plate modelled in ABAQUS ... 25
Figure 2-4: Conventional shell elements and continuum shell elements in ABAQUS (ABAQUS Analysis User manual) ... 26
Figure 2-5: SC8R elements in ABAQUS (ABAQUS Analysis User manual) ... 26
Figure 2-6: Location of the FBG sensor in the specimen between layers 3 and 4 ... 28
Figure 2-7: Experimental setup ... 29
Figure 2-8: Response spectrum of the FBG sensor ... 30
Figure 2-9: ply stack plot of the composite layup ... 30
Figure 2-10: Stress variation in the model in 1000N load ... 31
Figure 2-11: Deflection of the specimen at 1000N load ... 31
Figure 2-12: Strain variation in different layers of the specimen ... 32
Figure 2-13: The element corresponding to the location of the FBG sensor ... 33
Figure 2-14: Strain variation with bending loading (ply by ply) ... 33
Figure 2-15: comparison of FBG reading with strain extracted from Element 293, ply 3 ... 34
Figure 2-16: Wind turbine blade ... 35
Figure 2-17: Thin-walled cylindrical specimen. ... 36
Figure 2-18: Rosette attached to the specimens. ... 36
Figure 2-19: Specimen with rosette strain gauges and embedded FBG sensor. ... 37
Figure 2-21: Variation of FBG and rosette readings ... 39
Figure 2-22: FEM of the specimen ... 39
Figure 2-23: Variation of strain with the applied torque for the specimen ... 40
Figure 2-24: Helicopter rotor blade shank fitting (Bell helicopter, structural repair manual-BHT-MED-SRM-1) ... 41
Figure 2-25: Dimensions of the component in millimetres (mm) ... 41
Figure 2-26: FEA model of the connector ... 42
Figure 2-27: Combined loading used in the model ... 42
Figure 2-28: Stress variation of the model under combined loading ... 43
Figure 2-29: Locations of the two strain gauges ... 44
Figure 2-30: Fabrication of the sample ... 44
Figure 2-31: Fasteners used to load the specimen ... 45
Figure 2-32: Tensile testing of the specimen ... 45
Figure 2-33: Extraction of strain readings from the model ... 46
Figure 2-34: Comparison of sensor 1 with FEA ... 46
Figure 2-35: Comparison of sensor 2 with FEA ... 47
Figure 2-36: Geometric parameters of the plate ... 49
Figure 2-37: Two parts of the model ... 49
Figure 2-38: Partition of the part 1 ... 50
Figure 2-39: Contact surfaces of the two parts ... 50
Figure 2-40: Load applied to the plate ... 51
Figure 2-41: Stress variation of the plate ... 51
Figure 2-42: Strain variation in ply 3 and 4 ... 52
Figure 2-43: Strain variation of the ply 20, surface of the plate ... 52
List of Tables
1. Introduction
1.1 Background and Significance
Fibre reinforced polymer (FRP) composites have been used as an engineering material for more than six decades. The main attraction of the FRP is its superior strength-to-weight ratio. Aircraft and defence industries have been spending billions of dollars on investment in these composites to produce lightweight subsonic and supersonic aircrafts. Other desirable properties, such as the ease of fabrication of complex shapes and the ability to tailor desirable properties to suit different engineering applications, are enviable for an advanced material. Since research and development in the aircraft industry and space exploration agencies have been focused on FRP for many years, most of the advanced fibre composites available today, have one way or another, their origins in these fields.
The weight-save or positive weight spiral in the aircraft industry is directly translated to the enhancement of the load carrying capacity of civil aircraft, while for the fighters, it will be translated to the performance enhancement (mainly on the fuel carrying capacity versus the flying speed). As composites are partially made from polymer-based materials, they possess very good damping and fatigue resistance properties as compared with traditional metallic materials.
The commercial aircraft industry is gradually replacing metallic parts with FRP composites as much as possible. Hence, the FRP composites are frequently applied to primary load-bearing structures in the newly developed aircraft such as Boeing 787 and Airbus 380. However, the main disadvantages of using FRP composites in
CHAPTER 1
the aircraft industry are their difficulty for repair, anisotropic behaviour, high initial setup cost, and most importantly the complex failure criteria. Because of these undesirable properties, the FRP composite structures in the aircraft need to be closely monitored to prevent unexpected failure.
FRP composite structures can include stress-concentrated regions such as pin-loaded holes and other cut-outs. These stress concentrations easily induce damage that includes concurrent splitting, transverse cracking, and delamination (F. Chang & Chang, 1987; Kamiya & Sekine, 1996; Kortscho & Beaumont, 1990). Unlike metals, the failure modes of composites are very difficult to predict. Therefore, there are no established standards for composite materials. For this reason, it is essential to monitor advance composites regularly. In view of the aforementioned issues, a structural health monitoring (SHM) technique has recently been developed for these composite structures (F. K. Chang, 2003; Zhou & Sim, 2002).
Monitoring of composites began with damage detection technologies such as vibration and damping methods (Adams, Cawley, Pye, & Stone, 1978). Then sophisticated offline non-destructive test (NDT) methods were developed for the safe operation of composite structures. However, with the increasing complexity of structures, offline NDT was insufficient and developments of online SHM systems became vital.
To address complex failure modes of FRP composites, a SHM system must be efficient, robust and accurate. Due to recent developments in the aerospace industry, utilization of FRP composites for primary aircraft structures, such as wing leading-edge surfaces and fuselage sections, has increased. This has led to a rapid growth in the field of SHM. Impact, vibration, and loading can cause damage, such as delamination and matrix cracking, to the FRP composite structures. Moreover, the internal material damage can be undetectable using conventional techniques, making inspection of the structures for damage and clear insight into the structural integrity difficult using currently available evaluation methods.
The SHM system developed to monitor aircraft and space structures must be capable of identifying multiple failure criteria of FRP composites (Reveley, Kurtoglu, Leone, Briggs, & Withrow, 2010). Since the behaviour of composites is anisotropic, multiple numbers of sensors must be in service to monitor these structures under multi-directional complex loading conditions. The layered structure of the composites makes it difficult to predict the structural behaviour only by using surface sensors. To address this issue, embedded sensors must be used, and the sensors used must possess sufficient durability as it is not possible to replace embedded sensors after fabrication of the parts.
made up of glass possessing a long life time comparable to that of FRP composites. Because of its low transmission loss, the sensor signal can be monitored from longer distances making it suitable for remote sensing (K. O. Hill & Meltz, 1997; Kersey et al., 1997).
The FBG sensor’s capability of detecting strain gradients along its length can be used to identify the strain variations at a critical part in the FRP composites structure through an optical phenomena called chirp, in the reflected spectra of the FBG sensor (P. C. Hill & Eggleton, 1994; Kersey et al., 1997). This phenomenon has been used for decades of research to detect damage in the composite structures (Okabe, Yashiro, Kosaka, & Takeda, 2000; Takeda, Okabe, & Takeda, 2002). But there are numerous cases reported where the chirp or the distortion of the FBG spectrum was not limited to stress concentrations (Y. Wang et al., 2008). There are other causes of chirp, and it is necessary to eliminate such effects to identify damage accurately.
Figure 1-1: Distorted FBG spectra due to multiple effects
With the complex layout of composite structures, it is difficult to embed two sensors identically in two similar structures. The sensitivity of FBG is nano-meter range and small shift of location makes the two environments different to two sensors. As a result, it is difficult to compare fine spectral data of two spectra from two FBG sensors. Consequently, it is impossible to have universal decision making algorithms to work with FBG sensors. This complication is a major unsolved problem in the FBG-based SHM. Scarcity of adaptive decision making systems needs to be addressed.
The manufacturing of advanced composite component with embedded sensors is another significant engineering challenge associated with FBG-based SHM systems. The number of sensor must be optimized, and there should be backup systems in place for any redundant sensors after manufacture. Further, the embedded FBG network must be robust enough for compensating situations such as redundant sensors during operations. These unresolved critical problems have caused barriers to the development of SHM systems.
As a consequence, in a controlled/special laboratory environment, it is possible to discuss and interrelate the FBG spectra with the damage by creating an artificial
-38 -36 -34 -32 -30 -28
1560 1560.5 1561 1561.5 1562
Pow
e
r /
d
B
m
damage and observing spectrum of an FBG which is embedded closer to the damage location. But in the general application if such spectrum is observed, it is not possible to interpret the spectrum in order to identify the damage. In general application, identification of relevant features from the spectra is essential for damage detection.
Figure 1-2: Novel approach to FBG-based SHM systems
Most of the research work on FBG-based SHM systems are on controlled environments. But the inherent properties (non-unique/non-repeatable) of FBG sensors make the systems inextensible for general applications. This prevents the
Controlled/ laboratory environments
General conditions
Controlled data Combined data
Inextensible to non-idealised conditions
Identification and isolation of relevant
data
Damage detection Damage detection
Verification with ideal conditions FBG Based SHM
Systems
Conventional approach
work with FBG sensors in general conditions and to study the system as a whole, thus making SHM systems valid for real applications. Therefore the research work in this thesis addresses the fundamental unresolved problems in application of FBG-based SHM systems for real structures. As such, the research work planned here is a breakthrough for FBG-based SHM systems.
1.2 Objectives
The aim of this study is to investigate the unresolved problems associated with applications of FBG-based SHM systems. The main objectives of the study are the following:
Identification of a/the general damage matrix which can be monitored using FBG-based SHM system
Identification of spectral distortion of an FBG sensor in the real world environment in the vicinity of the damage
Identification of limitations of FBGs in detection of damage
Development of a method to quantify spectral distortion with respect to the quality of damage
Optimisation of the FBG network
1.3 Innovation and expected outcomes
The main objective of this research is to develop a FBG-based SHM system that can cope with general FRP applications, rather than for a particular idealised condition.
To achieve the set objectives, this study will follow a bottom up concept. First, the complex damage mechanism of the composite will be identified with the critical cause of damage. Subsequently, the damage will be quantified and monitoring indicators will be established. Building upon this foundation, the project will carefully devise mechanisms and algorithms to:
Extract useful data related to damage identification from distorted FBG spectra
Analyse extracted FBG spectral data to identify strain field at the FBG location
Optimisation of the FBG sensor network
Identify and quantify the damage
Issue a warning to a monitoring system
Decoding system for FBG spectra
An ANN based decision making algorithm
FBG sensor network optimising procedures
FBG-based SHM system for general/real application
The developed system is “Patent” pending. The industry partner, The Boeing Company, USA, organised the patent application with the US Patent office (Appendix A).
1.4 Outline of the thesis
This thesis is divided into 6 chapters which describe the different investigations conducted in this study:
The first chapter outlines the background, research gap, significance and objectives of this study. Further it details the outline of this thesis
Chapter 2 gives an overview of the composites used in the aerospace industry. The advantages of the use of composites in aerospace applications and the drawbacks are also discussed. Furthermore, the complex failure criteria of the composite materials and the requirement of reliable SHM systems for safe operation of FRP structures will be discussed
Chapter 4 introduces the use of ANN, for post-processing of FBG spectral data. A novel decoding system will be introduced to decode complex response spectra of an FBG. Finally, the procedures will be discussed and the integration of the decoding system and ANN for damage detection will be demonstrated experimentally
Chapter 5 will demonstrate procedures for optimising a FBG sensor network for efficient damage detection in a composite structure using the system introduced in Chapter 4.
2. Damage in composite structures
2.1 Introduction
Composite material is a combination of two or more chemically different materials with a distinct interface between them. The constituent materials retain their original properties and the composite materials provide combined properties which are different from the constituents. There is neither chemical reaction between constituents, nor change to the chemical structure of the constituents. One of the constituents makes a continuous phase which is called the matrix. The others act as reinforcement (Mallick, 1997).
The matrix material of a composite can be polymer, metal or ceramic, hence composite materials are classified as polymer matrix composites (PMC), metal matrix composite (MMC) and ceramic matrix composites (CMC). Figure 2-1 illustrates the evaluation of composite materials.
Figure 2-1: Composite materials
CHAPTER 2
The majority of the composites, Glass Fibre Reinforced Polymer (GFRP) and Carbon Fibre Reinforced Polymer (CFRP), are based on a polymer matrix. The development of PMCs for structures started in 1950s, and they are by far the most common fibre reinforced composite material in use today. The matrix is a key factor determining the characteristics of a composite material. In the applications of glass fibre reinforced plastics the resin used comes with two parts, the resin and the hardener. The resin/hardener ratio also effects the mechanical properties of a composite (d'Almeida & Monteiro, 1998).
Fibres are the principle load carrying component in fibre reinforced composites. The effectiveness of fibres in composite materials depends on the size, type, volume fraction and orientation of fibres in the matrix. A large variety of fibre types are available for engineering fibre reinforced composite materials. The most common fibre types are glass fibre and carbon fibre.
Glass fibre composites are popular for applications such as boats, body parts of vehicles, small aircrafts, durable goods and consumer goods applications because of their low cost. The comparative strength with carbon fibre is less but the cost and simple manufacturing technology makes glass fibre popular in low-end applications.
Glass fibres
2.1.1
Glass fibres are manufactured by drawing molten glass into very fine threads and then immediately protecting them from contact with the atmosphere or with hard surfaces in order to preserve the defect free structure that is created by the drawing process. Synthetic fibres are as strong as any of the newer natural fibres but they lack rigidity on account of their molecular structure. The properties of glasses can be modified to a limited extent by changing the chemical composition of the glass, but the only glass used to any great extent in composite materials is ordinary borosilicate glass, known as E-glass. The largest volume usage of composite materials involves E-glass as the reinforcement. S-glass has somewhat better properties than E-glass, including higher thermal stability, but its higher cost has limited the extent of its use. The stiffness of experimental calcium aluminate glass fibres can be as high as 180GPa.
Carbon fibres
2.1.2
oxidation methods to improve the quality of adhesion between the fibre and the matrix in a composite. Depending on processing conditions, a wide range of mechanical properties (controlled by structural variation) can be obtained, and fibres can, therefore, be chosen from this range so as to give the desired composite properties. Recent developments in this field have led to the use of pitch as a precursor in place of textile fibres, and these newer materials have extremely high stiffness, compared to PAN based fibres, but rather lower strengths (Fitzer & Heine, 1988).
The matrix of composites
2.1.3
The matrix binds the fibres together, holding them aligned in the important stressed directions. Loads applied to the composite are then transferred into the fibres, the principal load-bearing component, through the matrix, enabling the composite to withstand compression, flexural and shear forces, as well as tensile loads. The ability of composites reinforced with short fibres to support loads of any kind, is dependent on the presence of the matrix as the load-transfer medium, and the efficiency of this load transfer is directly related to the quality of the fibre/matrix bond.
unimpeded through sequences of fibres in contact (which would result in completely brittle composites).
The matrix should protect the reinforcing filaments from mechanical damage (eg. abrasion) and from environmental attack. Since many of the resins which are used as matrices for glass fibres prevent diffusion of water, this function is often not fulfilled in many GFRP materials and the environmental damage that results is aggravated by stress. In cement, the alkaline nature of the matrix itself is damaging to ordinary glass fibres and alkali-resistant glasses containing zirconium have been developed (Proctor & Yale, 1980) in an effort to counter this effect. For composites like MMCs or CMCs operating at elevated temperature, the matrix would need to protect the fibres from oxidative attack.
A ductile matrix will provide a means of slowing down or stopping cracks that might have originated at broken fibres. Conversely, a brittle matrix may depend upon the fibres to act as matrix crack stoppers.
2.2 Applications of Composites
Composite materials have been used a wide range of applications such as aerospace, automobile, bio-engineering, structural engineering, marine engineering, sports.
In the aerospace industry, a wide range of load-bearing and non-load-bearing components are already in use in both fixed-wing and rotary wing aircraft. Many military and civil aircraft now contain substantial quantities of lightweight, high-strength carbon-, Kevlar- and glass-fibre composites, as laminated panels, mouldings, and sandwich composite structures with metallic or resin-impregnated paper honeycomb core materials. They are used in air frames, wing spars, spoilers, tail-plane structures, fuel tanks, drop tanks, bulkheads, flooring, helicopter rotor blades, propellers, and structural components, pressured gas containers, radomes, nose and landing gear doors, fairings, engine nacelles (particularly where containment capability is required for jet engines), air distribution ducts, seat components, access panels, and so forth.
Space applications offer many opportunities for employing light-weight, high-rigidity structures for structural purposes. Many of the requirements are the same as those for aeronautical structures, since there is a need to have low weight and high stiffness in order to minimize loads and avoid the occurrence of buckling frequencies. Dimensional stability is at a premium, for stable antennae and optical platforms, for example, and materials need to be transparent to radio-frequency waves and stable towards both UV radiation and moisture.
2.3 Failure modes of Composites
Damage in the FRP structures can be defined as the changes to material properties and/or changes to the structural response of the structure. Damage can be in both matrix and/or fibre.
Composite materials can be analysed in different levels as shown in the Figure 2-2. The analysis of damage in composite structures starts from micromechanics to macro-mechanics. The failure of composites begins with micro-cracks in the matrix. The micro-cracks increase in number under increasing deformation. Due to a mismatch in the elastic module between the neighbouring layers, there exists an onset of delamination. As the critical value of the strain energy release rate is reached, the delaminations start growing rapidly. As a result, under the condition that the matrix crack density is very high and that the angle plies can no longer take tensile load, the entire tensile load is transferred through the 0o fibres. With further tensile loading, the 0o fibres break. This is the final stage of failure. Under compressive load also, the laminates start buckling at the delaminated zone and may fail instantaneously.
Figure 2-2: Levels of analysis for damage in composites
The evolution of a matrix crack as the initial stage of damage, followed by delamination, is also true for composites subjected to impact load (Marshall, Cox, & Evans, 1985). In most of the damage models reported in literature are transverse matrix cracks, splitting, delamination etc. and a combination of those are considered. The degradation of effective elastic module of damaged laminates used as the damage parameters. Once estimated through on-line health monitoring, such parameters can further be correlated to damage states.
Micromechanics (matrix-fibre)
Macromechanics (lamina - laminate)
Numerous failure theories have been proposed and are available to the composite structural designer (Daniel & Ishai, 2005). The failure theories have been classified into three groups, limit or non-interactive theories (maximum stress, maximum strain); interactive theories (Tsai-Hill, Tsai-Wu); and partially interactive or failure mode-based theories (Hashin-Rotem, Puck). The validity and applicability of a given theory depend on the convenience of application and agreement with experimental results.
Sun (2000) reviewed six failure theories and showed comparisons of theoretical predictions with experimental results for six different composite material systems under various loading conditions . He included uniaxial (normal and shear) loading, off-axis loading and biaxial (normal and shear) loading later. It was found, as observed previously, that most theories differed little from each other in the first quadrant (tension-tension). The biggest differences among theories occurred under combined transverse compression and shear. In this case, predictions of the Tsai-Wu interactive theory were in better agreement with experimental results than other theories.
With the difficulty of evaluation of failure, SHM plays a major role in composite structures.
Delamination
2.3.1
Delamination, which is the failure of the interface between two plies, is known as the silent killer of the composite structures. It is caused by normal and shear tractions acting on the interface, which may be attributed to transverse loading, free edge effect, ply-drop-off, or local load introduction. Delamination can significantly reduce the structural stiffness and the load carrying capacity and, therefore, is considered as one of the critical failure modes in laminated composites.
A laminate is constructed from groups of individual unidirectional plies which are laid at various angles, depending upon design requirements, or from layers of woven cloth laid at various angles to the main stress axes. The tension/shear coupling effects cause shear stresses to be developed in the plane of the laminate, especially near free edges, when the material is stressed. As inter-laminar planes in non-woven composites are always planes of weakness, the inter-laminar shear stresses may easily become large enough to disrupt or delaminate a composite well before its overall tensile strength is reached. A crack travelling through a given ply may therefore find it energetically favourable to deviate along an inter-laminar plane. Under such circumstances, considerations of fibre debonding and pull-out are of little significance.
and Scharmann (1998). For the prediction of formation of an initial delamination in an intact interface a strength/energy approach is proposed (Wimmer, Schuecker, & Pettermann, 2009) which combines strength criteria with fracture mechanics. For the simulation of delamination growth fracture mechanics are frequently used. It is widely accepted that conventional fibre reinforced epoxy resins show brittle fracture behaviour. Consequently, local material non-linearity in the vicinity of the delamination front are neglected and Linear Elastic Fracture Mechanics (LEFM) can be used. Several techniques based on LEFM have been developed and are utilized successfully within the framework of the Finite Element Method (FEM) for the simulation of delamination growth, such as crack tip elements (Jha & Charalambides, 1998), the Virtual Crack Extension Technique, and the Virtual Crack Closure Technique (VCCT) (Liu et al.). Wimmer and Pettermann (2008) suggested a numerically efficient semi-analytical approach for the prediction of delamination growth and its stability was also proposed. An alternative method that takes into account the non-linear interface behaviour at the delamination front introduces a cohesive zone (Barenblatt, H.L. Dryden, & Howarth, 1962). Based on this idea, Cohesive Zone Elements (CZE) have been developed within the FEM (Alfano & Crisfield, 2001) for the simulation of delamination.
2.4 Modelling of multilayer composite structures
Fibre-reinforced composites are modern construction materials from which products used in many areas are made. These materials are characterised by very good mechanical properties. They are ideal for structural applications where high strength and stiffness are required. The mechanical properties of the composite are not only defined by the properties of reinforcing fibres and their percentage participation in this material; the full advantages of such materials are obtained when the fibres are optimally distributed and oriented in each layer, with respect to the assumed objective behavioural measure in the optimisation process under the structure’s actual loading conditions.
In the process of modelling composite structures, two major approaches, Equivalent Single Layer (ESL) and Layer Wise (LW) models are used.
2.4.1.1 Equivalent Single Layer (ESL) modelling
2.4.1.2 Layer Wise (LW) modelling
In a Layer-Wise description, each separate layer of the laminate is explicitly represented with its own degree of freedom (DOF). Since this description introduces a number of DOF that depends on the number of layers constituting the laminate, the LW approach can rapidly become very complicated. FEM modelling of an LW approach relies classically on the use of solid brick elements that are stacked on each other to form the whole laminate (Barbero & Reddy, 1991). ABAQUS also permits staking of continuum-based (solid) shells in order to reduce the conditioning problems related to the very different element edge lengths (the laminate thickness generally being much smaller than the in-plane dimensions).
The LW modelling method consumes higher modelling time and calculations time of the computer. It is clear that a simplified method as the ESL requires less design time and less computing time. Instead, the LW may require a discrete design and calculation time that could become significant with the use of many finite elements over the composite cross-section.
For the research work in this thesis, it is essential to have LW modelling. The embedded FBG sensors report the strain between layers and hence, FEA data should be available layer wise for comparison reasons. In the ABAQUS modelling environment for composites, two different element types (the conventional shell and continuum shell) have been commonly used.
the two-dimensional space, it is not possible to assign an element to each layer of the composite. This would always lead to an ESL model.
For LW modelling, solid elements should be used. The promising solid element used in composite modelling is the continuum shell element. Continuum shell elements are three-dimensional stress/displacement elements for use in modelling structures that are generally slender, with a shell-like response but continuum element topology.
Modelling composite structures using FEA
2.4.2
Due to the anisotropic nature of composites, the material properties are commonly different in the three principal directions. The reinforcement of a composite is typically assigned the 1-direction, whereas the 2 and 3-directions are known as the transverse directions. Unlike 2-D conventional shell elements, the orientation of material properties must be explicitly assigned when using 3-D continuum elements.
GPa, and G23=1.698 GPa. Direction 1 is the direction of angle x axis, while directions 2 and 3 are y and z respectively.
Figure 2-3: Composite plate modelled in ABAQUS
2.4.2.1 Continuum shell elements
Figure 2-4: Conventional shell elements and continuum shell elements in ABAQUS (ABAQUS Analysis User manual)
Throughout the study, continuum shell elements (SC8R) have been used they provide both top surface and bottom surface strains. SC8R stands for continuum stress/displacement shell with 8 nodes and reduced integration (Figure 2-5). It is desirable to have strain variations at exact locations when it comes to comparison of strain readings obtained from embedded sensors (as discussed in Chapters 3 and 4).
Modelling plated structures
2.4.3
Plated structures are widely used in many engineering constructions ranging from aircraft to ships, and from off-shore structures to bridges and buildings. Given their diverse use in severe loading environments, it is vital that their behaviour is analysed and understood. When it comes to FRP composite plated structures, the layer wise behaviour needs to be analysed to model the complete structure. To model the deformation of laminated plates, approaches based on the classical laminate beam or plate theory have been developed (Crawley & Lazarus, 1989). These approaches should be restricted to thin plate applications since the linear strain distribution through the thickness and zero transverse shear stress is assumed. However, the transverse shear stresses are usually important in composite laminates. As a result, it is necessary to use shear deformation theory to address moderately thick and thick laminate constructions. The first-order shear deformation theory has been used for modelling the laminates using FEA. Furthermore, the Layer Wise theory and Three-dimensional (3D) coupled-analysis model have also been used.
In the damage detection of FRP composite structures, damage can be initiated from the inside of the structure as a crack or delamination. That is the key advantage of using embedded FBG sensors for damage detection in FRP composite structures. An FEA with LW modelling is essential for comparison and verification of experimental results.
2.4.3.1 Sample Fabrication and experimentation
A FBG sensor with a cantered wavelength about 1550 nm was fabricated on 9um core and 125um clad diameter telecommunication grade glass fibre. The grating length was 10mm. To ensure maximum bonding between the FBG sensor and the matrix of resin in the GFRP material, the acrylate layer of the fibre was removed. An extra protective layer of rubber was applied to the fibre to enhance the sensor robustness.
The sample was fabricated with 10 layers of E-Glass fibre in the orientation 0/90/±45/90/0/0/90/±45/90/0. Kenetix R246TX epoxy resin was used as the matrix material. The FBG sensor was embedded between non-parallel layers, 3 and 4, as shown in Figure 2-6.
Figure 2-6: Location of the FBG sensor in the specimen between layers 3 and 4
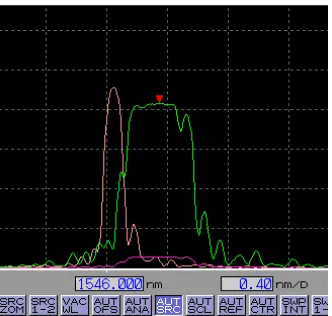
The specimen was loaded on a four points bending test rig in steps of 25N up to 1000N maximum load using an MTS (universal Material Testing System) as shown in Figure 2-7. The specimen was simply supported with a support span of 400 mm and loaded with loading span of 150 mm as shown in the Figure 2-7(a). The response spectrum of the FBG sensor was recorded at each loading step using the setup shown in the Figure 2-7(b). Micron Optics 3.1 sm125 optical spectrum analyser was used to recode FBG spectrum and the response spectrum of the FBG sensor for no load condition and 1000N flexural load is given in the Figure 2-8. The applied load shifted the peak location of the sensor which is used to calculate stain.
Figure 2-7: Experimental setup
MTS machine
Optical spectrum analyser
(a)
(b) Support span
Figure 2-8: Response spectrum of the FBG sensor
2.4.3.2 FEA model of the plate
A detailed finite element model (FEM) was developed for the specimen using commercial software, ABAQUS using continuum shell elements which is SC8R: An 8-node quadrilateral in-plane general-purpose shell element, reduced integration with hourglass control, finite membrane strains.
Figure 2-9 shows the ply stack plot of the composite layup. The plies are starting from the bottom and ply 10 is the top most one. The element size was selected as 10 mm for the FEA mesh. As FBG sensors provide the average strain along the gauge length, which is 10mm in this case. The FEA mesh in 10mm is also needed for comparison.
Figure 2-9: ply stack plot of the composite layup
-39 -37 -35 -33 -31 -29
1538 1540 1542 1544
Pl
we
r
(d
B
m
)
Wavelength (nm)
The model was loaded similar to the four point bending experiment up to 1000N load. This FEA data was generated for strain at each layer for each loading step. Figure 2-10 gives the stress variation (S11) in the plate, in x direction, which is under 1000N bending load. At the same loading, the deflection of the plate is given in the Figure 2-11.
Figure 2-10: Stress variation in the model in 1000N load
Figure 2-11: Deflection of the specimen at 1000N load
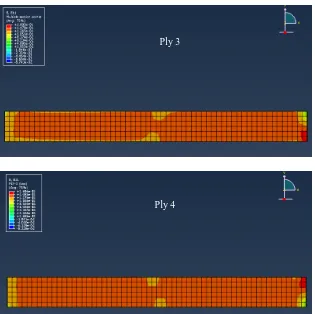
fibre layers make the monitoring insufficient only from the surface. Figure 2-12 gives the strain variation in different plys, while the structure is under 1000N flexural load.
Figure 2-12: Strain variation in different layers of the specimen
The location of the embedded FBG sensor is between layers 3 and 4, and the centre of the FBG is 25 mm shifted from the centre of the specimen as given in the Figure 2-6. Similarly, an element (element 293) at the same location as the model was selected to extract strain for comparison with the experimental results as shown in the Figure 2-13.
Ply 1 Ply 2
Figure 2-13: The element corresponding to the location of the FBG sensor
2.4.3.1 Results and validation of the FEA model
The strain values of each loading step for each ply were recorded for the element 293. The strain variation of the each ply (ply 1 to 10) is given in Figure 2-14. As illustrated in the Figure 2-14, the ply 1 is under tension while the ply 10 is under compression as a result of bending loading and loading direction.
Figure 2-14: Strain variation with bending loading (ply by ply)
As the FBG sensor was embedded between ply 3 and 4, for comparison purposes, the top surface strain from ply 3 is used. Figure 2-15 shows the variation of FBG readings and the top surface strain for the element 293 for ply 3.
-3000 -2500 -2000 -1500 -1000 -500 0 500 1000 1500 2000
0 200 400 600 800 1000
Str ai n ( µ e )
Load (N)
Ply 1 Ply 2 Ply 3 Ply 4 Ply 5 Ply 6 Ply 7 Ply 8 Ply 9 Ply 10 25 mm
Figure 2-15: comparison of FBG reading with strain extracted from Element 293, ply 3
The strain calculated using the peak shift of the FBG sensor and the strain extracted from the FEA model from the same location is with similar agreement as shown in the Figure 2-15. The negligible mismatch towards the higher loading is due to the experimental conditions (effects) which embedded FBG sensor would undergo during operation. FBG sensor interrogation, strain calculations using FBG sensors and various other effects on FBG sensor readings are thoroughly discussed in the Chapter 3.
Modelling tabular structures
2.4.4
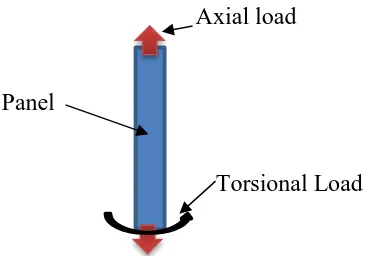
Tubes and pipes made of composite glass fibre/epoxy resin are widely used in engineering structures such as aircraft, construction, chemical, civil infrastructures and defence industries. Depending on the structural composite, components will undergo both static and dynamic loading during their operational lifetime. A good example is a helicopter or wind turbine blade in dynamic applications which undergo millions of cycles of severe multi-axial loadings during their operational lifetime (Figure 2-16) (Epaarachchi & Clegg, 2006). The major drawback for designers of Fibre Reinforced Polymer (FRP) materials is the complexity of the failure modes.
0 50 100 150 200 250 300 350 400 450 500
0 200 400 600 800 1000
The failure modes in anisotropic composite materials are more complex than the isotropic materials under the multi-axial complex loading which tubes will experience during the operation. (Eric, 1995; Lee, Hwang, Park, & Han, 1999)
Figure 2-16: Wind turbine blade
2.4.4.1 Fabrication of the specimens
FBG sensors which operate in the range of a 1550nm centre wavelength were fabricated on 5μm core and 125μm clad diameter telecommunication grade glass fibre. The grating length is 10mm. To ensure maximum bonding between the FBG sensor and matrix of resin in the GFRP material, the acrylate layer at the grating region of the fibre was removed. Extra protective layer of rubber was applied to the fibre to maximise the handling of samples without damage to the sensors.
ensure the shear stress is uniformly distributed around the circumference and along the axis of the tube. The wall thickness is made small compared to the mean radius so that the through-thickness shear gradient is negligible. The ends of the specimens are over layered with additional layers and tapered to promote failure with in gauge length. The tab thickness is 10mm.
Figure 2-17: Thin-walled cylindrical specimen.
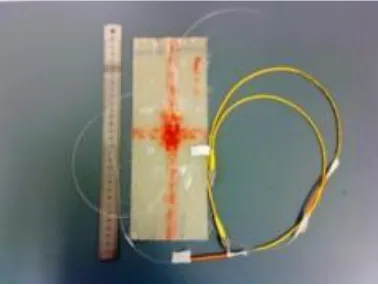
The specimen was fabricated with a rosette attached to the outer surface of the tube at the centre of the tube and with an FBG sensor located between layers 5 and 6, at an angle of 45o to the axis of the tube (Figure 2-18). The rosette was attached above the FBG sensor (Figure 2-19).
Figure 2-19: Specimen with rosette strain gauges and embedded FBG sensor.
2.4.4.2 Experimentation and results
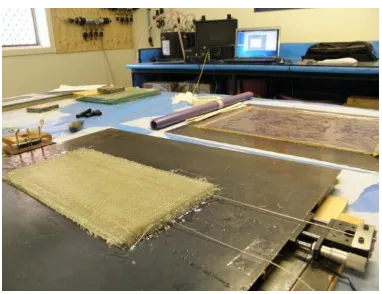
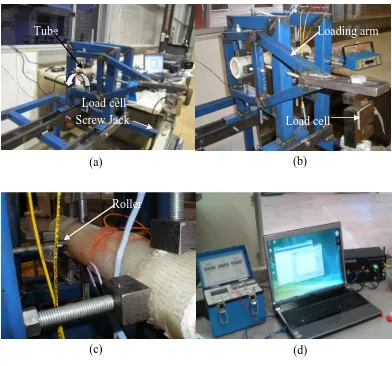
The torsional testing equipment and the test configuration are shown inFigure 2-20. The torsional testing equipment was designed and manufactured at the Centre of Excellence in Engineering Fibre Composites (CEEFC), University of Southern Queensland (USQ) by the author (Appendix B).The specimens were mounted on the torsion test machine with one end fixed. The other end of the specimen was supported with roller supports to avoid bending of the samples. Torque was applied by loading the arm attached at the roller support side by means of a screw jack. Applied torque is measured using an S type load-cell with 0-2kN range.
Rosette
Figure 2-20: Torsional test setup.
The specimen was torsional loaded in 50 Nm increments as shown in Figure 2-20, and the strain gauge readings and FBG spectra were recorded. A Vishay Micro-Measurements P3 strain indicator was used to measure the strain from rosette and Micron Optics 3.1 sm125 optical spectrum analyser was used to measure the FBG spectrum Figure 2-20(d). The specimen was loaded three times to ensure reliability of the readings. The data were stored for post processing.
The reading from the legs 0o and the 90o of the rosette (Figure 2-18) were used to verify the loading condition. Low reading of the 90o leg is evidence for a minimal bending moment on the tube since the 90o leg lies parallel to the axis of the tube. The strain value of the FBG sensor was calculated using peak shift. Since apodisation
Tube
Load cell
Loading arm
Screw Jack
(a) (b)
algorithm was used to capture the peak of the spectrum. Experimental results observed from the FBG sensors were compared with the strain values from rosette as shown in Figure 2-21.
Figure 2-21: Variation of FBG and rosette readings
A FEA model of the specimen is given in Figure 2-22. Figure 2-23 shows the principal strain, shear strain, FBG and FEA results for specimen. Finite element results show good agreement with the experimental results. The FBG sensor reading and FEA results of layer 5, where the FBG sensors are embedded, indicated an excellent agreement.
Figure 2-22: FEM of the specimen
0 200 400 600 800 1000 1200
0 50 100 150 200 250 300
Str
ai
n
/
µ
ε
Torque / Nm
Figure 2-23: Variation of strain with the applied torque for the specimen
Modelling of a complex structure: helicopter blade
2.4.5
shank fitting
When it comes to modelling of aerospace structures, it is rare to have simple structures such as plates and tubes. The complex structural elements used in aerospace applications need to be monitored with SHM systems as complexity increases the damage initiation risk. In the design stage of composite structures, and also for development of SHM systems for monitoring structures, it is essential to have reliable FEA modelling techniques. The following study details the modelling of a blade shank fitting which connects a blade of a helicopter to hub. With the modelling results, the representative sample has been fabricated and tested for verification. Figure 2-24 illustrates a drawing of a helicopter rotor blade shank fitting. 0 100 200 300 400 500 600 700 800 900 1000
0 50 100 150 200 250 300 350
Str ai n / µ ε
Torque / Nm
Figure 2-24: Helicopter rotor blade shank fitting (Bell helicopter, structural repair manual-BHT-MED-SRM-1)
The geometric parameters of the component are given in the Figure 2-25. The component, modelled in commercial FEA package ABAQUS, is shown in Figure 2-26. The holes available in the blade shank fitting were used to connect the helicopter blade and the hub using bolts. Consequently, in the FEA model, the boundary conditions were selected to be compatible with real applications.
Figure 2-26: FEA model of the connector
The model was loaded in tension bending and torsional combined loading as illustrated in Figure 2-27. In real application, the connector is subjected to similar load cases as the helicopter blade is applying axial load due to centrifugal action, bending load due to gravitation load and torsional load due to pitching of the blade.
Figure 2-27: Combined loading used in the model
Figure 2-28: Stress variation of the model under combined loading
2.4.5.1 Fabrication of the specimen
Figure 2-29: Locations of the two strain gauges
Figure 2-30: Fabrication of the sample
2.4.5.2 Experimentation
For the loading of the specimen, two fasteners were fabricated (Figure 2-31). The fasteners were designed to load the specimen using a MTS machine.
(a) (b)
(c) (d)
Sensor 1
Sensor 2 x
Figure 2-31: Fasteners used to load the specimen
The specimen was loaded in tension as shown in the Figure 2-32. The sample was loaded for a maximum load of 2000N in 100N steps and the strain from the strain gauges was recorded.
Figure 2-32: Tensile testing of the specimen
2.4.5.3 Results and verification of the FEA model
used. Locations of the elements corresponding to sensor 1 and sensor 2, are shown in the Figure 2-33.
Figure 2-33: Extraction of strain readings from the model
Figure 2-34 shows the comparison of strain readings obtained from sensor 1 with the FEA results. The comparison of sensor 2 with the FEA results is given in Figure 2-35.
Figure 2-34: Comparison of sensor 1 with FEA
0 50 100 150 200 250 300 350 400
0 500 1000 1500 2000
Stain
/ u
e
Load / N
Strain Gauge FEA
Sensor 1
Figure 2-35: Comparison of sensor 2 with FEA
From the results, it can be seen that using FEA for complicated composite structures can be questionable. Even though the FEA model estimates the strain closely in some cases, complicated geometries might affect the predictability. Local stress concentrations may affect the strain gauge readings. A detailed investigation on those effects will be given in Chapter 3.
2.5 Modelling damage in composite structures:
Delamination
Delamination damage is one of the most common structural damage types in laminated composites, and can result from impact, overload, or fatigue crack growth from defects along or near the adhesion layer. Delamination leads to a reduction in stiffness and strength of the composite structure and potentially to catastrophic failure. Early detection of delamination damage is therefore vital for high risk and high value assets such as aircraft and civil infrastructure. An important aspect of any damage detection technique, especially displacement and strain based approaches, is an understanding of the mechanical behaviour of a delaminated composite component under a wide range of load and geometry conditions. This knowledge is
0 20 40 60 80 100 120 140
0 500 1000 1500 2000
Stain
/ u
e
Load / N
FEA
achieved through theoretical modelling such as by simplified beam or plate models as seen in Wildy et al. (Wildy, Cazzolato, & Kotousov, 2010) or extensive finite element analysis (FEA) (Waldron et al., 2002). Theoretical modelling can also provide ‘ideal’ comparisons for undamaged and damaged components, and can be used to evaluate the success and range of applicability of new damage detection methods. Simple beam or plate models are particularly good for this as they allow for a wide variation of input parameters without the computational and time constraints of FEA methods.
In the scope of this research work FEA is used for several aspects. One of the key aspects is to identify the stress concentrations in composite structures, to detect delamination initiation locations. Furthermore, the stress concentrations have been used to locate the embedded sensors for damage monitoring. For this process, it is extremely important to determine the stress field around initiated damage while the structure is under operational loading, in the modelling environment. If the sensors were located outside the stress field, those sensors will not be able to detect damage in ordinary strain-based methods.
Modelling of plate with a delamination
2.5.1
A GFRP composite plate with twenty ply was used as the model. The composite layup of [90/0/90/-45/45/-45/45/90/0/90]s was used. The geometric parameters of the plate are given in Figure 2-36.
Figure 2-36: Geometric parameters of the plate
The plate was modelled in two parts as shown in Figure 2-37. Part 1 consisted of three (3) ply in orientation [90/0/90] and part two consisted the remaining ply [/-45/45/-45/45/90/0/90/90/0/90/0/-45/45/-45//90/0/90/0/90]. For the model, continuum shell elements have been used.
Figure 2-37: Two parts of the model
In the part 1, 10mm partition was created as shown in the Figure 2-38 which acted as the delamination of the model.
300 mm
30 mm
Part 1
Figure 2-38: Partition of the part 1
The two parts were placed together, part 2 on top of part 1. The two parts were tied only on the two contact surfaces as shown in the Figure 2-39. The partitioned areas were not connected to each other.
Figure 2-39: Contact surfaces of the two parts
By not connecting the partitioned area of part 1 to part 2, between ply 3 and ply 4 there was no connections in that particular area. Hence, this partitioned area acted as an ideal delamination. The surface interaction in the partitioned area was set to frictionless.
An axial load of 100N and bending load of 50 N was applied one end of the plate while the other end was rigidly fixed (Figure 2-40).
10 mm
Figure 2-40: Load applied to the plate
2.5.1.1 FEA Results
The stress variation of the plate is given in Figure 2-41. The stress variation from the simulated delamination was identified from the stress field. Furthermore ply by ply strain variation was also possible to obtain. Figure 2-42 shows the strain variation in ply 3 and ply 4.
Figure 2-41: Stress variation of the plate
The strain variation in ply 3 and ply 4 were not similar, as ply 3 consisted of 90o fibre and in ply 4 it was -45o fibres. The capability of obtaining ply by ply strain distribution was used to obtain FEA data to compare with embedded sensor readings.
Bending
Fixed end
Figure 2-42: Strain variation in ply 3 and 4
[image:80.595.120.435.66.380.2]The effect of the delamination can be visualising even from the surface strain readings. Figure 2-43 shows the stress variation obtained at the surface of the plate.
Figure 2-43: Strain variation of the ply 20, surface of the plate
Throughout the study, the aforementioned method was used for the modelling of delaminations. In the Chapter 3, the use of fibre optic sensors for the monitoring of damage (SHM) will be discussed. Delamination is used as the simulated defect for
Ply 3
3. Structural health monitoring using
FBG sensors
3.1 Introduction
The process of implementing a damage detection and chara