EFFECTIVENES S OF S ENS ITIZATION PROGRAMME ON
KNOWLEDGE AND ATTITUDE TOWARDS DRINKING AND
ALCOHOLIS M AMONG S TUDENTS AT S ELECTED
COLLEGES
IN COIMBATORE.
By
ANTRO BERRIN .W.A
A dissertation submitted to
The Tamil Nadu Dr. M G R Me dical Unive rsity,
Chennai, in partial fulfillment of requirement of the degree of
Maste r of Scie nce in Nursing
Branch V Psychiatric Nursing
Effectiveness of sensitization programme on knowledge and
attitude towards drinking and alcoholism among students at
selected
colleges in Coimbatore .
Proposal presentation on: 13/11/2014
Approved by Dissertation Committee on: 11/12/2015
SUBJEC T GUIDE
PRO F. ESTHER DAISY JO EL, M.sc (N),
Head of the department,
Mental health nursing department,
PSG College of nursing,
Coimbatore.
RESEARC H GUIDE
Dr. MALARVIZHI. G. M.Sc (N), Ph.D,
Professor and Vice-principal,
Head of the department,
Department of child health nursing,
PSG College of nursing,
C ERTIFIC ATE
Certified that "Effectiveness of sensitization programme on knowledge
and attitude towards drinking and alcoholism among students at
selected
colleges
LQ&RLPEDWRUH´
is the bonafide work of ANTRO BERRIN
W .A, PSG College of Nursing, Coimbatore, submitted in partial fulfillment of
requirement for the degree of Master of Sciences in Nursing to The Tamil Nadu
Dr. M G R Me dical University, Chennai.
Dr. ELIZABETH JEAN ABRAHAM, M.Sc (N), Ph.D
Principal,
PSG College of Nursing,
Peelamedu,
Coimbatore-641004
College Seal
PSG C O LLEGE O F NURSING
C O IMBATO RE
ACKNOWLEDGEMENT
³)RUWKLV2/25',ZLOOSUDLVH\RXDPRQJWKHQDWLRQV
,ZLOOVLQJSUDLVHVWR<RXUQDPH´3VDOP
I would like to thank and praise my Heavenly Father, for enabling me to
complete this thesis which seemed like a mountain and leading me preciously every step
of the way.
Though only my name appears on the cover of this dissertation, a great many
people have contributed to its completion. I owe my gratitude to all those people who
have made this dissertation possible and because of whom my Post-graduate experience
has been one that I will cherish forever.
I owe a deep sense of gratitude to the Managing Trustee for giving an
opportunity to undergo my Post-graduate nursing.
I express my profound respect and deep gratitude to our beloved Principal
Dr. Elizabeth Jean Abraham, M.Sc (N), Ph.D, PSG College of Nursing. The words of
appreciation and encouraging support that our principal had showed on me, kindled my
spirit and enthusiasm to go ahead and to accomplish this study successfully.
I extend my heartfelt thanks with sincere gratitude and respect to my research
guide Dr. Malarvizhi. G., M.Sc (N), Ph.D, HOD of Child Health Nursing, Vice
Principal, PSG College of Nursing, for her insightful comments and constructive
criticisms at different stages of my research that were thought-provoking and they helped
me focus on my ideas. I am grateful to her for holding me to a high research standard and
thus teaching me how to do research.
My deepest gratitude is to my guide, Prof. Esther Daisy Joel, M.Sc (N). I have
been amazingly fortunate to have an advisor who gave me the freedom to explore on my
own and at the same time the guidance to recover when my steps faltered. Mam taught
me how to question thoughts and express ideas. Her patience and support helped me
overcome many situations and finish this dissertation.
I have an immense pleasure in expressing my gratitude to Prof. Meera
motivation, encouragement and practical advice. I am also thankful to them for reading
my reports; commenting on my views and helping me understand and enrich my ideas
I am grateful to Mrs. Maheswari. T and Mrs. Jyothi Sunandha, Asst.
Professors for their support in completing my study. I am also thankful to them for their
encouragement and practical advice and for carefully reading my study
.
I have immense pleasure to thank Dr. Rajendran, Principal of PSG Arts and
Science College and Prof. Thangapaandian, Prof. Mahendran, Dr. Nagarajan, and
Prof. Anbazhagan for accepting and helping me to conduct the study in their college.
My special thanks to Statisticians Dr. Subramanian, Dr. Anil C Mathew and
Mr. Karthikeyan, for they have been always there to listen and give advice. I would
like to acknowledge The Entire Faculty and Staff of PSG College of Nursing for their
valuable feedback and motivation throughout the study.
I extend my gratefulness to The Ethical Committee of PSG institution for
approving the study to be conducted. I express my sincere thanks to all Library Staffs
for rendering all the facilities and support during the time of this study.
³A family is a circle of strength, founded on faith, joined in love and kept by
God´,DPEOHVVHGZLWKDIDPLO\ ZKLFKLQFOXGHVmy dad, Rev. K. R. William, my mom,
Mrs. Amala Bel. C and my dear brother, Noble Berrin. W. A, for their encouragement
through thick and thin. Words cannot express my gratitude. Your prayers and blessings
have brought me till here and I am deeply grateful for everything.
A special mention to Dr. Jacinth Babu and Mrs. Siji Jacinth, for their support
and encouragement during hard times and for being a blessing in my life.
I express my heartfelt thanks to all My Friends, especially to my batch mates
who have been a source of encouragement and support throughout this study. A special
mention to my friend Ms. Nancy.S, my senior Ms. Shanmugapriya, my junior friends
Ashok, Kapil, Masthan and many more for their help throughout this study. I would like
to extend my gratitude to all friends in my congregation for their constant Prayers and
encouragement. No words can express my appreciation and indebtness to many of them
whose names have not been mentioned here but have contributed unselfishly and most
CONTENTS
CHAPTERS TITLE PAGE.NO.
ABSTRACT
CHAPTER I INTRODUCTION
1.1 Background of the study 1
1.2 Need for the Study 3
1.3 Statement of the Problem 4
1.4 Objectives 4
1.5 Assumptions 4
1.6 Hypotheses 5
1.7 Operational Definitions 5
1.8 Projected Outcome 5
1.9 Modified general system model 6
CHAPTER II REVIEW OF LITERATURE
2.1 Literature regarding effects of education modules in
improving the knowledge regarding alcoholism among
college students
8
2.2 Literature regarding use of alcohol among students 10
2.3 Literature regarding motivating factors for alcohol
consumption 11
2.4 Literature regarding ill effects of alcoholism 11
CHAPTER III MATERIALS AND METHODOLOGY
3.1 Research approach and design 13
3.2 Variables of the study 14
3.3 Setting of the study 14
3.4 Population and sampling 14
3.5 Instruments and Tools for Data Collection 15
3.6 Ethical approval 17
3.7 Report of the pilot study 17
CHAPTER IV DATA ANALYSIS AND INTERPATION
4.1 Frequency and percentage distribution of students
according to their demographic data 20
4.2 Frequency and percentage distribution of pre-test and
post-test level of knowledge regarding alcoholism 24
4.3 Frequency and percentage distribution of pre-test and
post-test level of attitude towards drinking and
alcoholism
25
4.4 Effectiveness of sensitization programme on knowledge
regarding alcoholism among college students 26
4.5 Area wise mean and standard deviation of pre-test and
post-test scores of knowledge regarding alcoholism to
find the effectiveness of sensitization programme in all
the areas
27
4.6 Effectiveness of sensitization programme on attitude
towards drinking and alcoholism among college
students
28
4.7 Comparison of pre-test and post-test level of attitude
towards drinking and alcoholism. 29
4.8 Relation between knowledge and attitude level of the
students in pre and post test 32
4.9 Association between pre-test level of knowledge
regarding alcoholism with selected demographic
variables
33
CHAPTER V RESULTS AND DISCUSSION
5.1 Demographic variables of students
36
5.2 Assessment of pre-test knowledge level regarding
drinking and alcoholism 36
5.3 Assessment of effectiveness of sensitization programme
by comparing the pre-test an post-test level of
knowledge regarding drinking and alcoholism
5.4 Correlation between knowledge and attitude among
college students 37
5.5 Association between pre-test levels of knowledge with
selected demographic variables
37
CHAPTER VI SUMMARY AND CONCLUSION
6.1 Major findings of the study 39
6.2 Conclusion 40
6.3 Nursing implications 40
6.4 Limitations 41
6.5 Recommendations 41
BIBLIOGRAPHY
42
ANNEXURE
LIS T OF TABLES
TABLE TITLE PAGE
NO
4.1 Frequency and percentage distribution of students according to
their demographic data
20
4.2
Frequency and percentage distribution of pre-test and post-test
level of knowledge regarding alcoholism 24
4.3
Frequency and percentage distribution of pre-test and post-test
level of attitude towards drinking and alcoholism 25
4.4 Effectiveness of sensitization programme on knowledge
regarding alcoholism among college students 26
4.5
Area wise mean and standard deviation of pre-test and post-test
scores of knowledge regarding alcoholism to find the
effectiveness of sensitization programme in all the areas
27
4.6 Effectiveness of sensitization programme on attitude towards
drinking and alcoholism among college students 28
4.7
Comparison of pre-test and post-test level of attitude towards
drinking and alcoholism. 29
4.8
Relation between knowledge and attitude level of the students in
pre and post test 32
4.9
Association between pre-test level of knowledge regarding
LIS T OF FIGURES
FIGURES TITLE PAGE NO
1.1 Conceptual framework: modified general system model
7
4.1 Bar diagram for frequency distribution of students according
to their age 23
4.2 Bar diagram for frequency distribution of family history of
alcoholism
24
4.3 Bar diagram on comparison of factor wise pre-test and
LIS T OF ANNEXURE
ANNEXURE TITLE PAGE.NO.
I Permission Letter 46
II Institutional Human Ethics Committee Letter 47
III Informed consent 49
IV Tool 52
V Intervention 59
LIS T OF ABBREVATIONS
S l. No
Abbreviations
1
f : frequency2
H : hypothesis3
n : number of sample4
BAC : Blood Alcohol Concentration5
ASSOCHAM : Associate Chambers of industry and businessdevelopment of India
6 DTGD : Drinking to get drunk
7 RR : Risk Rate
ABS TRACT
³(ffectiveness of sensitization programme on knowledge and attitude towards drinking
and alcoholism among students at selected colleges in Coimbatore´
Background of the study: Drinking at college has become a ritual that students often see it
as an integral part of their higher education experience. Some students come to college w ith
established drinking habits and the college environment can exacerbate the problem but in
many students the journey with alcohol starts there. So it is necessary to improve the
VWXGHQWV¶ NQRZOHGJH DQG DWWLWXGH UHJDUGLQJ DOFRKROLVP ZKLFK ZLOO FKDQJH WKHLU EHKDYLRXU
and would also help them lead a quality and fruitful life.
Objective of the Study: To assess the effectiveness of sensitization programme on
knowledge and attitude towards drinking and alcoholism among students
Research Methodology: The study was conducted in PSG College of Arts and S ciences,
Coimbatore and the research design adopted was Quasi-experimental One group pre-test
post-test design. Based on the inclusion criteria, 174 samples were selected. The pre-test
score of knowledge and attitude level were assessed by a structured questionnaire and
standardized attitude scale respectively. Sensitization program on alcoholism and its effects
was given after the pre-test and the post-test assessment was done 7 days after the programme
by using the same tool.
Major Findings of the Study: The study finding displayed an increase in the knowledge
level following the sensitization programme (t value=26.9 at p<0.05). In this study, the
statistical analysis showed that there was an association between demographic variables like
gender and monthly income with pre-test knowledge level at p<0.05.
Conclusion: This study results show that the sensitization programme has helped the students
gain knowledge regarding drinking and alcoholism.
1
CHAPTER I
INTRODUCTION
³
Alcohol: Temporary fun with permanent consequences
´
1.1 Background of the study
Drinking at college has become a ritual that students often see it as an integral part of
their higher education experience. Some students come to college with established drinking
habits and the college environment can exacerbate the problem but in many students the
journey with alcohol starts there. Virtually all college students experience the effects of
college drinking - whether they drink or not.
Worldwide, there were about 3.3 million deaths from alcohol consumption in 2012,
according to the WHO, which averages to about one death per 10 seconds. According to the
WHO, 32% of men and fewer than 11% of women in India, over the age of 15, imbibe
alcohol. For the total population of India, about 28.7% consume liquor. About 7% of the
alcohol consumed is in the form of beer, less than 1% is wine and 93% is in the form of
spirits. (WHO Global Status Report on Alcohol 2014)
Awareness of alcohol use and misuse on college campuses is not new. Available
research indicates that approximately 60% of college student s drink and that half of college
student drinkers engage in heavy episodic drinking. Excessive alcohol intake among college
students is associated with a variety of adverse consequences like fatal and nonfatal injuries,
alcohol poisoning, blackouts, academic failure, violence including rape and assault,
unintended pregnancy, sexually transmitted diseases including HIV/AIDS, property damage
and vocational and criminal consequences that could jeopardize future job prospects.
Students who engage in excessive drinking have an impact not only on just themselves but
also people around them. (Vishal Koshla et.al, 2011)
Fellow students experience second hand consequences ranging from disrupted study
and sleep to physical and sexual assault. Furthermore, the institutions they attend; expend
valuable resources to deal with institutional and personal consequences of their behavior.
(Weshler, 2015)
Drinking among college students is often associated with impulsivity/sensation
seeking or the regulation of negative emotional states which includes depression and anxiety.
Many students are heavily influenced by social factors. (Gayle M. Boyd and Vivian Faden,
2
Although the majority of students coming to college already have some beforehand
experience with alcohol, certain aspects of college life, such as unstructured time, widespread
availability of alcohol, inconsistent enforcement of underage drinking laws and limited
interactions with parents and other adults intensify the problem. In fact, college students hav e
higher binge-drinking rates and a higher incidence of driving under the influence of alcohol
than their non-college going peers.
The first 6 weeks of freshman year is a vulnerable time for heavy drinking and
alcohol-related consequences because of student expectations and social pressure at the start
of the academic year.
An often-overlooked preventive factor involves the continuing influence by the
parents. Research shows that students who choose not to drink often do so because their
parents discussed alcohol use and its adverse consequences with them. (National Institute
on Alcohol Abuse and Alcoholism, 2014)
The transition from high school to college is a significant milestone in a young
SHUVRQ¶V OLIH WKDW LV PDUNHG E\ HQWLUHO\ QHZ VRFLDO HQYLURQPHQWV and the adoption of adult
roles as students become independent of their parents. Although about half of all college
binge drinkers engage in binge drinking before their arrival on campus, an equal number pick
up binge drinking behavior in college. In another study, researcher examined alcohol use
among college students and found that males were less likely to have positive attitudes
toward seeking alcoholism treatment compared with female students . (Tomeshwari, 2014)
Long-term alcohol abuse can cause a number of physical symptoms including
cirrhosis of the liver, pancreatitis, epilepsy, polyneuropathy, alcoholic dementia, heart
disease, nutritional deficiencies, peptic ulcers, sexual dysfunction and can eventually be fatal.
Alcohol abuse is associated with an increased risk of committing criminal offences including
child abuse, domestic violence, rape, burglary and assault. Alcoholism is associated with loss
of employment also. (J Arasumani, 2013)
³ 'Uink has drained more blood, hung more crepe, sold more house, plunged more
people bankruptcy, armed more villains, slain more children, snapped more wedding rings,
defiled more innocence, blind more eyes, twisted more limbs, dethroned more reason,
wrecked more manhood, dishonored more womanhood, broken more hearts, blasted more
lives, driven more to suicide and dug more graves than only other poisoned scourge that ever
swept its death dealing waves across the world´
Thus the problem of alcohol is so severe DQGLVGUDLQLQJSHRSOHV¶KHDOWKSRVVHVVLRQ
3
1.2 Need for the study
There has been a rapid change in patterns and trends of alcohol use in India. Chief
among them is people are beginning to drink at ever-younger ages. The percentage of the
drinking population aged less than 21 years has increased from 2% to more than 14% in the
past 15 years, according to studies in the southern state of Kerala, alarmingly; the study found
WKDW WKH ³ DYHUDJH DJH RI LQLWLDWLRQ´ KDG GURSSHG IURP \HDUV WR years in the past two
decades. (Alcohol and Drugs Information Centre India, a non-governmental
organization (NGO), 2014)
The survey under ASSOCHAM'S Social Development Foundation indicated that
alcohol intake in youth between the age group 19 to 26 in host els has registered a 60 percent
increase over the years. The vast majority of college students are under the legal drinking age
of 21. Alcohol remains the clear drug of choice and the one that contributes to a wide range
of problems. Indian alcohol policy alliance in their article, Alcohol Related Harm in India ± a
fact sheet states that sale of alcohol has been growing steadily at the rate of 6% and is
estimated to grow at the rate of 8% per year. Also it state that people drink at an earlier age
now than before. The mean age of initiation of alcohol use has decreased from 23.36 years in
1950 - 1960 to 19.45 years in 1980 - 1990. (ASSOCHAM, 2012)
National Institute on Alcohol Abuse and Alcoholism in USA states that, drinking
affects college students, their families, and college communities at large. Consequences
include death, injury, assault, sexual abuse, unsafe sex, academic problems, alcohol abuse
and dependence, drunk driving and other consequences include suicide attempts, health
problems, vandalism, property damage, and involvement with the police.
Student Choice and Alcohol Matters, an article about college drinking says that the
participants reported a variety of motives that underpinned their use of alcohol. Some aspects
related to personal and internal factors, others reflected more inter-personal reasons. The
various sub-themes are social factors, drinking to relax, drinking to get drunk and finance. So
it is important for them to have awareness regarding the effects of alcohol to them, their
families and the college environment. (Gillian N Penny & Sarah Armstrong-Hallam, July
2010)
College students encounter problems when others drink too much which include, 60.5
% had study or sleep interrupted, 53.6 % had to take care of a drunken student, 29.3% had
been insulted or humiliated, 20.1 % experienced an unwanted sexual advance (women), 18.6
4
hit, or assaulted, 1.3 % had been a victim of sexual assault or date rape (women). (Wechsler,
H et.al, 2005)
Each year an estimated 1,825 college students from US, between the ages of 18 and
24 die from alcohol related unintentional injuries, including motor vehicle crashes.
When looking at all this statistics it is necessary to LPSURYHVWXGHQWV¶NQRZOHGJHDQG
attitude regarding alcoholism and its ill effects, to make them understand the consequences
by those ill effects on body, their behaviour and to the society by helping them lead a quality
and fruitful life.
Hence the researcher was motivated to undergo this study among the college students.
1.3 Statement of the problem
Effectiveness of Sensitization programme on knowledge and attitude towards
drinking and alcoholism among students at selected colleges in Coimbatore.
1.4 Objectives
1. To assess the knowledge regarding alcoholism among college students.
2. To assess the attitude of college students towards drinking and alcoholism.
3. To assess the effectiveness of sensitization programme on knowledge and attitude
towards drinking and alcoholism among college students.
4. To find the correlation between knowledge and attitude among college students.
5. To find out the association between pre-test level of knowledge with selected
demographic variables.
1.5 Assumptions
It is assumed that:
1. College students may abuse alcohol because they lack knowledge or awareness of
health risks associated with alcohol.
2. ,QFUHDVLQJ WKH VWXGHQW¶V NQRZOHGJH ZLOO FKDQJH WKH VWXGHQW¶V DWWLWXGH WRZDUGV
5
1.6 Hypothesis
H1: There will be a significant difference in the pre and post -test level of knowledge towards
drinking and alcoholism.
H2: There will be a significant difference in the pre and post -test level of attitude towards
drinking and alcoholism.
H3: There will be a significant relationship between knowledge and attitude regarding
alcoholism among college students.
H4: There will be a significant association between the selected demographic variables and
the pre-test levels of knowledge regarding alcoholism.
1.7 Operational definitions
1. Effectiveness: In this study it refers to the extent to which the Sensitization
programme on alcoholism brings desired change in the knowledge and attitude scores
measured by structured questionnaire and 'HEDVLVK %DVX¶V TXHVWLRQQDLUH RQattitude
towards drinking and alcoholism respectively.
2. Sensitization programme: In this study it is creating awareness among college
students regarding alcoholism and its ill effects which in turn will bring change in
their knowledge and attitude towards alcoholism.
3. Knowledge: In this study it refers to the students understanding about alcohol and its
mechanism in the body which produce ill effects physically, psychologically and
socially measured by a structured questionnaire.
4. Attitude: ,Q WKLV VWXG\ LW UHIHUV WR WKH VWXGHQW¶Vway of thinking and understanding
about alcoholism measured by 'HEDVLVK %DVX¶V TXHVWLRQQDLUH RQ attitude towards
drinking and alcoholism.
5. Alcoholism: In this study it refers to the prolonged period of frequently consuming
alcohol containing substances and becomes unable to live a normal and healthy life.
1.8 Projected outcome
Sensitization programme could help to improve knowledge and attitude among first year
6
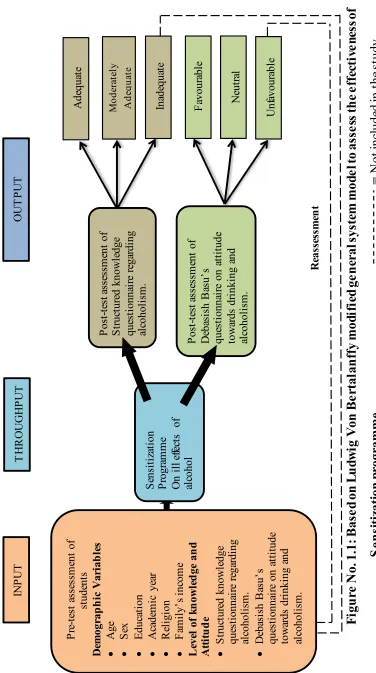
1.9 Conceptual framework
The conceptual framework for this study was derived from general system model
(Ludwig Von Bertalanffy, 1968). It is regarded as a universal grand theory because of its
unique relevancy and applicability. It is composed of both structural and functional
components that interact within a boundary that filters the type and rate of exchange with the
environment. Living system terms are open because there is an ongoing exchange of matter,
energy, and information. Through the process of selecting the system which regulates the
type and the amount of input through self-regulation to maintain the system equilibrium or
homeostasis. Some types of input are used immediately in their original state where as the
other complex transformations are continuously processed through the system and released as
output. The following components in the modified general system model are as follows:
Input: Input is the information needed by the system. It includes demographic variables, an
data assessing the knowledge and attitude, before providing the sensitization programme
using structured knowledge questionnaire and 'HEDVLVK %DVX¶V TXHVWLRQQDLUH RQ attitude
towards drinking and alcoholism.
Through put: Through put is the activity phase. It is a process that allows input to change. It
includes the provision of a sensitization program with the help of computer aided tools for the
students.
Output: The information are continuously processed through the system and released as
output in an altered VWDWH ,W LQFOXGHV HYDOXDWLRQ RI WKH VWXGHQWV¶ NQRZOHGJH DQG DWWLWXGH
towards drinking and alcoholism.
Feedback: It is the response of the environment to the system. Feedback may be positive or
negative or neutral. It is necessary to strengthen the input and throughput and modify them as
desired when the results show any inadequate knowledge or favourable attitude towards
7
F
igu
re
N
o. 1.1: Bas
e
d
on
L
u
d
w
ig
V
o
n
Be
rtal
an
ffy mod
if
ie
d
ge
n
er
a
l s
y
st
em
mod
e
l to as
[image:20.612.126.502.99.772.2]CHAPTER II
REVIEW OF LITERATURE
A literature review is a description and analysis of the literature relevant to a
particular field or topic. It gives the idea about the authors of the articles, the key authors and
the persons who had contributed to the study. It also gives idea about the setting at which it is
done, the population, appropriate research design and the key questions and suggestions
given in the study.
The review of literature in this study was divided into four parts
¾ Literature regarding effects of education modules in improving the knowledge
regarding alcoholism among college students
¾ Literature regarding use of alcohol among students
¾ Literature regarding motivating factor for alcohol consumption
¾ Literature regarding ill effects of alcoholism
2.1 Literature regarding effects of education modules in improving the knowledge
regarding alcoholism among college students
An exploratory survey was conducted at Durg to assess the knowledge and attitude of
engineering students towards alcoholism, to find out the correlation between knowledge and
attitude of engineering students towards alcoholism, to find out the association between
knowledge and attitude with selected demographic variables. Sample of 100 engineering
students with age group of 17-25 years were selected by random sampling technique. A
modified standardized tool for knowledge (Student Alcohol Questionnaire) and standardized
tool for attitude (Understanding of Alcoholism Scale) were used to collect data. The study
revealed that 56% of engineering students had good knowledge and 44% had average
knowledge. It was found that majority 89% of engineering students had neutral attitude and
11% had positive attitude towards alcoholism. There was negative correlation between the
knowledge and attitude. Age, education, occupation of father, type of family were having
significant association with knowledge and age, education were having significant
association with attitude. Students tend to adopt negative attitude towards alcoholism only
after they have good knowledge regarding alcoholism. On the basis of the results of the
and consequences of alcohol consumption so that they may adopt the negative attitude
towards alcoholism and plan their future life accordingly. (Tomeshwari Pandit, 2014)
A study was conducted on knowledge and attitude among late adolescents towards
alcoholism in Bangalore using convenient sampling method. The tool used for the study was
a structured interview schedule. The data was analyzed and interpreted by using simple
descriptive and inferential statistics. Findings show that among 60 adolescents, 61 percent
were having moderately adequate knowledge, 31.7 percent were having inadequate
knowledge and only 6.7 percent were having adequate knowledge. Out of 60 adolescents,
majority of the adolescents 60 percent were having favorable attitude, 25 percent were having
most favorable attitude and only 15 percent were having unfavorable attitude. Credible,
evidence based educational campaigns in the mass media about the consequences of alcohol
abuse have been recommended to prevent alcohol abuse amongst adolescents. (J Arasumani,
2013)
A 30-campus randomized controlled trial in US investigated the effects of Alcoholedu
for College on the frequency of past-30-day alcohol use and heavy drinking among 1102
freshers. Alcoholedu is an online alcohol misuse prevention and harm reduction course for
college students that typically take 2±3 hours to complete. The results of this randomized
controlled trial suggest that Alcoholedu for College demonstrates promise as a means to
prevent or reduce alcohol-related problems among freshmen during the post test that
immediately follows course implementation which had a fall in mean from 5.5 to 3.3.
(Paschall et. al, 2011)
Clinical prevention trials (approaches to educating and counseling) of adolescents
(teens and young adults ages 12 to 25 years old) about risks related to alcohol use indicate
that reduction in adolescent alcohol use is possible with non-physicians as interventionists
and physicians as interventionists supported by patient counseling guides and resources.
Physicians might also be more effective if they are aware of emerging alcohol problems
among youth, systems-level resources for counseling adolescents about prevention and
appropriate guidance for parents (Boekeloo, 2011).
A meta-analysis was conducted in Greece on 62 randomized controlled studies of
individual-level interventions to reduce college student drinking between 1985 and 2007 with
13,750 participants and 98 intervention conditions. At short -term follow up (4-13 weeks post
intervention), intervention participants reduced their quantity and frequency of heavy
drinking and alcohol-related problems. At intermediate follow up (14-26 weeks post
drinking. At long-term follow up (27-195 weeks post intervention), frequency of drinking
days and alcohol-related problems were reduced. The authors concluded that their findings
demonstrate that individually oriented alcohol risk reduction interventions of various forms
can reduce quantity and frequency of drinking as well as alcohol-related problems reported
by college drinkers. (Carey et al. 2007)
2.2 Literature regarding use of alcohol among students
A prospective study examined 100 cases of alcohol in taking students (males only). It
was found that the most common age group of starting alcohol intake was 21-30 years age
group (60%) where the second most was between 11-20 years (17%). The urban population
was mainly affected (57%). The most commonly used beverage was whisky (41%) followed
by beer (20%). The most common reason for starting alcohol intake was found to be curiosity
(67%). (D.S. Bhullar et al, 2013)
A survey study conducted to find the prevalence, pattern and predictors of alcohol
consumption among college students in Ludhiana district of Punjab. Nine colleges were
randomly selected for the study. Of the total 610 students the response rate was 87.9 per cent.
The questionnaire was developed by the authors and pre-tested on a few college students in
Ludhiana. The one time users of alcohol ranged 60%. The overall prevalence of ever alcohol
use was 31.9 %. The mean age of initiation of alcohol consumption was 18.7 year for males
and 19.2 year for females. Three-fourth of the respondents tried their first use with friends.
Among males the reasons for trying the first drink were encouragement from friends (38.8%),
curiosity (25.0%), for fun (20.0%), for celebrations (10.6%) and during depressed mood
(5.6%). Among females the main reasons for trying the first drink were curiosity (54.5%),
celebrations (27.3%), for fun (9.1%) and encouragement by friends (9.1%). Current use of
alcohol was reported only by male students. Prevalence of current use among males was 31.1
per cent. The most preferred places of drinking were hostel (44%), bar (39%) and frieQG¶V
place (17%). Among the current users, most of them (91.1%) drank with their friends and the
remaining 8.9 per cent with their family members. (Vishal Khosla et al., 2011)
A Cross- Sectional study during January-March 2005 among 226 adolescent student
aged of 15 to 18 years belonging to two senior secondary schools in Tadong area of East
Sikkim. Simple Random Sampling Technique was applied by lottery method. It was found
that 85% of respondents were willing to encourage others to stop alcohol consumptio n.
wanted to give up the habit. Among the regular consumers of alcohol, there were 70.3% of
them were males and 29.7% of them females. (Ankur Barua, 2006)
2.3 Literature regarding motivating factor for alcohol consumption
In another survey study which examined 307 incoming freshmen from selected
colleges in England regarding Drinking to get drunk (DTGD). T he majority 76.9%)
self-reported DTGD, in which 64.83% self-reported that they drank by participating in a drinking
game. (Boekeloo, 2011)
2.4 Literature regarding ill effects of alcoholism
In a study about alcohol and cognitive impairment in which they explains that as
alcohol related brain damage previously labeled as alcohol mania and alcohol dementia.
They describe a spectrum of alcohol related cognitive impairment ranging from less severe
through alcohol amnestic syndrome to more severe and widespread impairment. They also
state that alcohol dependent individuals have decreased brain weight related to reductions in
white matter (Harper 2005).Clark (2005) describes that effect of heavy alcohol consumption
on the adolescent brain have shown evidence of white matter and subtle neurocognitive
abnormalities .The heavy use of alcohol at this stage in development may affect structures
involved in behavioral, emotional, and cognitive regulation predisposing these individuals to
further use. (Sameer Jauhar E, 2015)
A meta-analysis study that was carried out in Mexico on the effect of alcohol
consumption and the risk of incident HIV infection which was done by reviewing ten studies
shows that, Alcohol consumers were at 77% higher risk of developing (RR 1.77, 95% CI).
Those consuming alcohol prior to, or at the time of, sexual rel ations were at an 87% increased
risk (RR 1.87, 95% CI). For binge drinkers, the risk was double that of non -binge drinkers
(RR 2.20, 95% CI 1.29-3.74). (Baliunas. D, 2010)
In another retrospective review in Mexico which was done on all the suicide cases
referred in New Mexico Office of the Medical Investigator, the results show that 26% of the
suicides were under the influence of alcohol. (Singh et.al, 2008)
Moderators precede attending college and identify which students are at risk for
associated with drinking in first-year students sensation seeking, gender, religiosity,
precollege alcohol use, and parental influences. (Kraemer et al., 2001)
A number of studies have demonstrated that students increase their alcohol
consumption during the first year of college given by Bishop, Weisgram, Holleque, Lund &
Wheeler-Anderson, 2005, Capone, Wood, Borsari, & Laird, 2011; Grekin & Sher, 2006;
Hartzler & Fromme, 2003; Leibsohn, 1994; McCabe et al., 2005; Weitzman, Nelson, &
Wechsler, 2003; White et al., 2006.
Chapter summary:
This chapter has the literatures about the effectiveness of education modules in
improving the knowledge, literatures about the prevalence of alcoholism am ong college
students, the motivating factors and regarding ill effects of alcoholism. These literatures had
helped the researcher to select the setting, the research design, the population, the sampling
technique and these had been also used in the discussion chapter to relate the present study
CHAPTER III
METHODOLOGY
The present study was designed to determine the effectiveness of sensitization
programme on knowledge and attitude towards drinking and alcoholism. This chapter
includes the research approach and design, the variables in the study, setting of the study,
population and sampling, instruments and tools for data collection, validity and reliability,
techniques of data collection, data collection procedure, ethical approval, report of the pilot
study, changes brought after the pilot study and data analysis plan.
3.1 Research Approach and design
This study was done as a quantitative experimental approach and had used one group
pretest posttest design. This is a type of quasi experimental design where effectiveness of
interventions had to be studied on a particular population. Since the present study is done to
find the effectiveness of sensitization programme on knowledge and attitude towards
drinking and alcoholism among college students this type of design will be helpful. In this
present study first the knowledge and attitude towards drinking and alcoholism was checked
which was followed by the sensitization programme regarding alcoholism. After giving the
sensitization programme the knowledge and attitude level was checked once again to find the
difference between the pretest and the posttest.
One group pretest posttest design.
0
1
0
2
O1: Pre assessment of Knowledge and Attitude towards drinking and alcoholism
X : Sensitization Programme regarding alcoholism
O2: Post assessment of Knowledge and Attitude towards drinking and alcoholism
3.2 Variables of the study
Independent Variable
Sensitization program regarding alcoholism.
Dependent Variable
Knowledge and attitude towards alcoholism.
3.3
Setting of the study
The study was conducted in PSG College of arts and science. This college is situated
near the Coimbatore international airport. This college is a famous college in Coimbatore
which has both self-financed and Government counseled students in it. This college runs all
courses in arts and science.
3.4 Population and sampling
The population of the study consists of all the students in four of the departments
from the college. The four departments are Department of Psychology, Department of
Sociology, Department of English and Department of Economics. The total populations in the
four departments were 428.
3.4.1 Sampling technique and Sample size
Stratified sampling technique
Simple random sampling
Sample size calculation:
n = N*X / (X + N - 1) where,
X = ZĮ2 *p*(1-p) / MOE2 in which,
ZĮ FULWLFDOYDOXHRI WKH1RUPDOGLVWULEXWLRQDWĮLH
MOE = Margin of error
p = Sample proportion
N= population size
By applying this n= 428*376.41/376.41+427 = 161103.48/803.41 = 200.626
Thus the sample size is 200.
The absentees at the sensitization programme and the post -test were 26 which reduce
3.4.2 Sample selection criteria
Inclusion Criteria
1. 1st year under graduate students in selected college.
2. Students who were willing to participate in the study.
3. Both male and female students.
Ex clusion Criteria
1. Those who had already attended any classes regarding alcoholism.
3.5 Instruments and tools for data collection
The tool consists of three parts.
Part I: Socio-Demographic Data.
Part II: Structured Knowledge Questionnaire regarding alcoholism.
Part III: 'HEDVLVK%DVX¶VTXHVWLRQQDLUHRQAttitude towards Drinking and Alcoholism.
Part I : Socio-demographic data:
This tool consists of 12 questions that collects the information about the age, gender,
FRXUVH WKH\VWXGLHVWKHLUUHOLJLRQWKHLUIDWKHU¶VDQGPRWKHU¶VHGXFDWLRQDOVWDWXVWKHLUIDWKHU¶V DQGPRWKHU¶VRFFXSDWLRQDOVWDWXVPRQWKO\LQFRPH of the family, family history of alcoholism
and source of information they have received about alcoholism. These data were collected to
find any of these variables had an influence on their knowledge on alcoholism.
(Annex ure IV)
Part II :Structured Knowledge Q uestionnaire regarding alcoholism:
This is a self-structured tool that consists of 40 questions which test the knowledge of
the students regarding alcoholism. This has 4 areas in it. They are general information about
alcohol, blood alcohol concentration, ill effects of alcohol and misconceptions about alcohol.
Each question carries one mark which gives a total of 40 marks. (Annex ure IV)
Interpretation :
> 75% = Adequate knowledge
51 ± 75% = Average knowledge
Part III : 'HEDVLVK%DVX¶VTXHVWLRQQDLUHRQAttitude towards Drinking and Alcoholism
This is a standardized tool published by Debashish Basu, M.D Psychiatry. This tool is
to assess the attitude of a student towards drinking and alcoholism. This tool also has 4 areas.
They are acceptance, rejection, avoidance and social dimension. This tool is interpreted factor
wise. (Annex ure IV)
Interpretation :
> 75% = Favourable Attitude
51 ± 75% = Neutral Attitude
< 51% = Unfavourable Attitude
3.5.1 Validity and reliability
9DOLGLW\ RI WKH WRRO KDG EHHQ GHWHUPLQHG E\ H[SHUW¶V RSLQLRQ IURP GLIIHUHQW ILHOGV
The experts were requested to give their opinion, clarity and appropriateness, suggestions for
the modification of the tool. Reliability of the tool was identified using split half method. It
ZDV FRPSXWHG XVLQJ .DUO 3HDUVRQ¶VFRUUHODWLRQFRHIILFLHQWPHWKRG7KHUHOLDELOLW\RIWKHWRRO
was found to be 0.72. The tool was found to be reliable and feasible.
3.5.2 Technique of data collection
The data was collected by providing the tool to the students before the sensitization
programme and 7 days after the sensitization programme. It was done for a period of 5
weeks. Sensitization programme was a teaching programme that included the general
information about alcohol, its mechanism, how it works in human body and the ill effects it
can have physiologically, psychologically and socially in a person. The programme also
included information about misconceptions that many people have about drinking,
alcoholism and alcoholics. The programme also consisted of three videos. The first video was
about a child who was just 4 years old who was made to drink by his own uncle and his
friends. The second video was a documentary from a village in north Tamilnad u, which
included interviews being taken from alcoholics and their family members revealing the ill
effects of alcohol on self, his family members and the environment. The third video was a
short film which provide the insights about how alcohol consumptioQ FDQ UXLQ D VWXGHQW¶V
life, his academic performances, how it affects his relationship with his classmates and the
things he do wrong only because of the influence of alcohol. It also shows how dependence
3.5.3 Data collection procedure
x The data collection was started with seeking permission from principal and then from
the respective Head of departments of Psychology, English, Economics and
Sociology.
x After seeking permission the pretest was conducted in the samples that have been
VHOHFWHG IURP WKHIRXU GHSDUWPHQWVRQWKHSHULRGVWKH+2'¶VDOORW
x After the pretest the sensitization programme has been given to those samples.
x The posttest had been done to the sample 7 days after the sensitization programme.
x The same tool was provided on both pretest and posttest with demographic data alone
excluded in the posttest.
3.6 Ethical Approval
7KHSURSRVDOZDVVXEPLWWHGWR³ ,QVWLWXWLRQDO+XPDQ(WKLFV&RPPLWWHH,+(&´36*
Institute of Medical Science and Research. The proposal then was reviewed by the experts in
different fields and approved. Ethical approval is important to start the data collection. So
once the approval had been received the data collection was started. (Annex ure II)
3.7 Report of the Pilot study
The pilot study was conducted on 18-6-15, 19-6-15 and 26-6-15. It was done at PSG
College of arts and science in the departments of BA English and BSc Psychology. The data
was collected and tabulated to find the frequency distribution of students according to the
GHPRJUDSKLF YDULDEOHV 3DLUHG µW¶ WHVW ZDV XVHG WR ILQG WKH HIIHFWLYHQHVV RI WKH VHQVLWL]DWLRQ
programme which gave the finding as the sensitization programme was effective in
enhancing knowledge but not the attitude. Chi-square test was used to find the association
between selected demographic variables and the level of knowledge regarding alcoholism
among college students which gave the inference as there was no association between the
demographic variables and the level of knowledge regarding alcoholism among college
3.7.1 Changes brought after the pilot study
The changes that was made after the pilot study are
x The sampling technique has been changed from systematic sampling
technique to simple random sampling technique.
x The interpretation was attitude scale was changed into factor wise which was
at first interpreted as a whole.
3.8 Data analysis plan
i. Description statistics:
¾ Frequency and percentage distribution of sample to describe knowledge
among college students regarding alcoholism.
¾ Frequency and percentage distribution will be used to describe the attitude of
college students towards drinking and alcoholism.
¾ Mean and standard deviation will be used to assess pretest and posttest
knowledge an attitude level differences.
ii. Inferential statistics:
¾ Paired t ±test will be used to assess the effectiveness of sensitization
programme.
¾ Chi Square test will be done to find out the association between pre-test level
of knowledge with selected demographic variables.
Chapter Summary:
This chapter discuss about the material and methodology followed in the present
study. The method used was a quasi-experimental design. This chapter also deals with the
sample population, sample size, regarding the instruments used, data collecti on methods,
ethical committee approval and the pilot study report. The next chapter will deal on data
CHAPTER IV
DATA ANALYSIS AND INTERPRETATION
Data analysis is the systematic organization and synthesis of research data and testing
of research hypothesis using those data. Interpretation is the process of making sense of the
result of the study and examining their implications. Analysis is the method of rendering
qualitative data as easily understandable and providing intelligent information about the
research problem which will be helpful to study and test the relationship between the
variables.
In this study, the effectiveness of sensitization teaching program on intravenous
administration of chemotherapy was assessed. The data was collected, assembled, analyzed
and tested individually and described. The findings based on the statistical analysis, p resented
in this chapter are.
x 4.1: Frequency and percentage distribution of students according to their demographic
data
x 4.2: Frequency and percentage distribution of pre-test and post-test level of
knowledge regarding alcoholism
x 4.3: Frequency and percentage distribution of pre-test and post-test level of attitude
towards drinking and alcoholism
x 4.4: Effectiveness of sensitization programme on knowledge regarding alcoholism
among college students
x 4.5: Area wise mean and standard deviation of pre-test and post-test scores of
knowledge regarding alcoholism to find the effectiveness of sensitization programme
in all the areas
x 4.6: Effectiveness of sensitization programme on attitude towards drinking and
alcoholism among college students
x 4.7: Comparison of pre-test and post-test level of attitude towards drinking and
alcoholism.
x 4.8: Relation between knowledge and attitude level regarding drinking and alcoholism
x 4.9: Association between pre-test level of knowledge regarding alcoholism with
[image:33.612.88.550.142.580.2]selected demographic variables
TABLE 4.1.1: Frequency and percentage distribution of students according to their
demographic data n=174
Sl.
No Demographic Variables
Frequency
(f)
Percentage
(%)
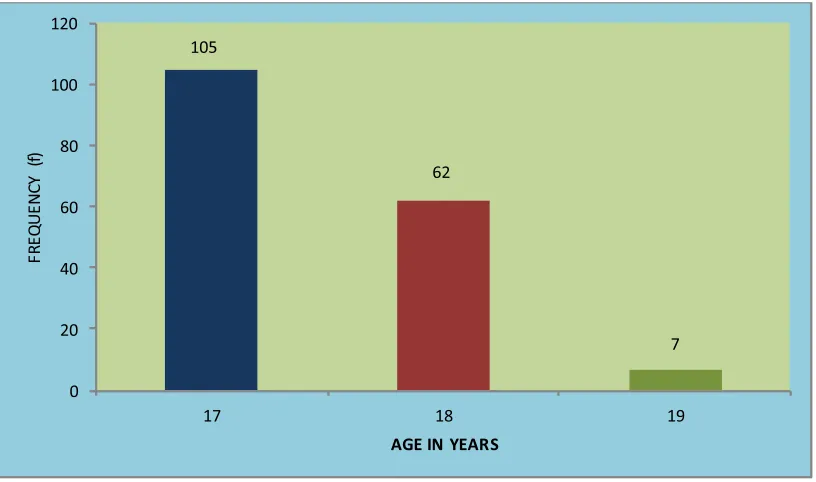
1 Age in years
17 105 60.34
18 62 35.63
19 7 4.03
2 Gender
Male 81 46.55
Female 93 53.45
3 Course
BSc Psychology 47 27.01
BA English 40 22.99
BA Economics 44 25.29
BA Sociology 43 24.71
4 Religion
Hindu 157 90.22
Christian 5 2.87
Muslim 12 6.91
5 Type of Family
Joint family 35 20.11
Nuclear family 125 72.84
Extended family 14 8.05
According to Table 1.1, from the 174 samples, 105 samples were in the age of 17
years (60%) and more than half of them were females 93 (53%). Majority of them 157
(90.22%) were following Hinduism. The course they study was equally presented as
Psychology 47 (27%) followed by Economics 44 (25%), Sociology 43 (25%) and English 40
TABLE 4.1.2: Frequency and percentage distribution of students according to their
demographic data
n=174 Sl.
No Demographic Variables
Frequency
(f)
Percentage
(%)
6 )DWKHU¶V HGXFDWLRQDOVWDWXV
Illiterate 12 6.90
Primary education 24 13.80
Secondary education 38 21.84
Higher secondary education 32 18.39
Diploma 20 11.49
Under graduate 30 17.24
Post graduate 18 10.34
7 0RWKHU¶V HGXFDWLRQDOVWDWXV
Illiterate 9 5.17
Primary education 27 15.52
Secondary education 40 22.99
Higher secondary education 36 20.69
Diploma 9 5.17
Under graduate 32 18.39
Post graduate 21 12.07
8 )DWKHU¶V RFFXSDWLRQDOVWDWXV
Profession 57 32.76
Semi-profession 9 5.17
Clerical, shop-owner, farmer 69 39.66
Skilled worker 26 14.94
Semi-skilled worker 6 3.45
Unskilled worker 4 2.30
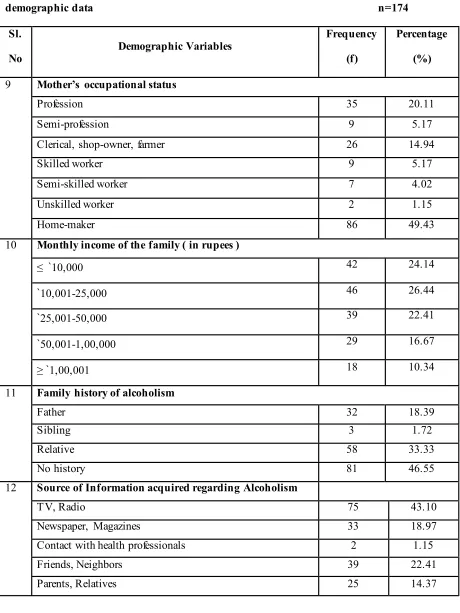
TABLE 4.1.3: Frequency and percentage distribution of students according to their
demographic data n=174
Sl.
No
Demographic Variables
Frequency
(f)
Percentage
(%)
9 0RWKHU¶V RFFXSDWLRQDOVWDWXV
Profession 35 20.11
Semi-profession 9 5.17
Clerical, shop-owner, farmer 26 14.94
Skilled worker 9 5.17
Semi-skilled worker 7 4.02
Unskilled worker 2 1.15
Home-maker 86 49.43
10 Monthly income of the family ( in rupees )
`10,000 42 24.14
`10,001-25,000 46 26.44
`25,001-50,000 39 22.41
`50,001-1,00,000 29 16.67
`1,00,001 18 10.34
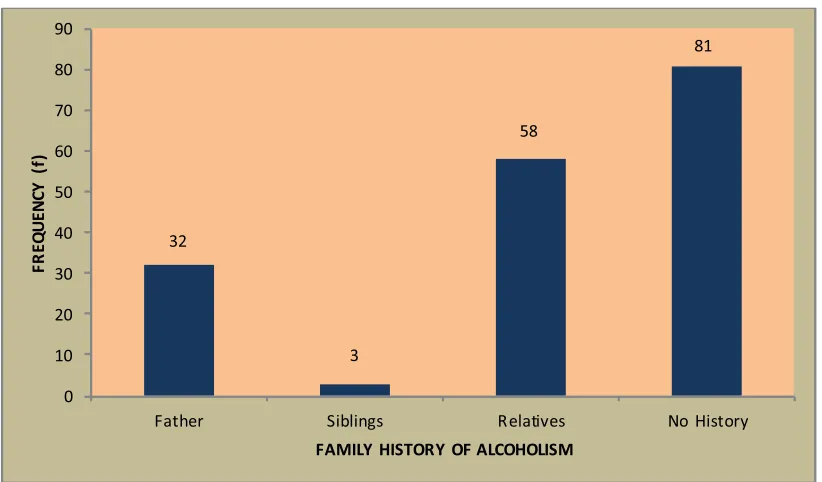
11 Family history of alcoholism
Father 32 18.39
Sibling 3 1.72
Relative 58 33.33
No history 81 46.55
12 Source of Information acquired regarding Alcoholism
TV, Radio 75 43.10
Newspaper, Magazines 33 18.97
Contact with health professionals 2 1.15
Friends, Neighbors 39 22.41
According to Table 1.2 and 1.3, while looking at educational status of the parents of
174 samples, 38 (22%) fathers had completed their secondary education. When looking at the
educational status of mother's, majority of them had completed their secondary education 40
(23%). Less than half of the fathers were occupied under the category of clerical, shop owner
DQG IDUPHU 0RUH QXPEHU RI IDPLOLHV LQFRPHV ZDV EHWZHHQ
ൟ-25000 per month. Less than half of the samples 81 (47%) state that there was no history of
alcoholism in their families. TV and radio plays major role in providing information about
[image:36.612.95.503.228.469.2]alcoholism and about 75 of them had accepted this fact (43%).
FIGURE 4.1: Frequency distribution of students according to their age
105
62
7
0 20 40 60 80 100 120
17 18 19
FR
E
Q
U
E
N
C
Y
(
f)
FIGURE 4.2: Frequency distribution of family history of alcoholism
TABLE 4.2: Frequency and percentage distribution of pre-test and post-test level of
knowledge regarding alcoholism n=174
Levels of Knowledge
PRE-TEST POST-TEST
Frequency (f) Percentage (%) Frequency (f) Percentage (%)
Adequate 0 0 48 27.59
Moderately adequate 22 12.64 123 70.69
Inadequate 152 87.36 3 1.72
In Table 2, frequency and percentage distribution of pre-test and post-test knowledge
scores indicates that, at pre-test none of them had adequate knowledge about alcoholism,
whereas majority 152 (87%) had inadequate knowledge and 22 (13%) had a moderately
adequate knowledge. In post-test, which was done 7 days after the sensitization programme
123(71%) had moderately adequate knowledge, 48 (28%) had adequate knowledge. However
3 (2%) continued to have inadequate knowledge about alcoholism.
32
3
58
81
0 10 20 30 40 50 60 70 80 90
Father Siblings Relatives No History
FR
E
Q
U
E
N
C
Y
(
f)
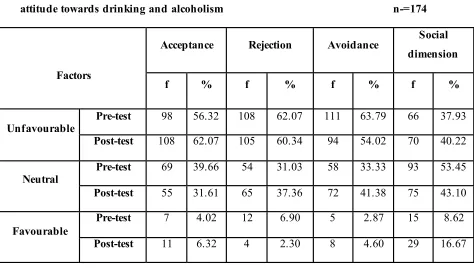
TABLE 4.3 Frequency and percentage distribution of pre-test and post-test level of
attitude towards drinking and alcoholism n-=174
Factors
Acceptance Rejection Avoidance Social dimension
f % f % f % f %
Unfavourable
Pre-test 98 56.32 108 62.07 111 63.79 66 37.93
Post-test 108 62.07 105 60.34 94 54.02 70 40.22
Neutral
Pre-test 69 39.66 54 31.03 58 33.33 93 53.45
Post-test 55 31.61 65 37.36 72 41.38 75 43.10
Favourable
Pre-test 7 4.02 12 6.90 5 2.87 15 8.62
Post-test 11 6.32 4 2.30 8 4.60 29 16.67
According to Table 3, in acceptance, at pre-test there were 98 (56.32%) students who
had a unfavourable attitude towards drinking and alcoholism whereas in post -test which was
done 7 days after the sensitization programme it increased to 108 (62.07%) students which
indicates the programme was effective.
In rejection, at pre-test there were 54 (31.03%) students who had a neutral attitude
which had increased to 65 (37.36%) post-test also in pre-test there were 108 (62.07%)
students who had unfavourable attitude which reduced to 105 (30.34%) after post-test which
VKRZVWKDWWKHSURJUDPGLGQ¶WKDYHDQ\LPSDFW
Looking at avoidance, at pre-test there were 111 (63.79%) students who had an
unfavourable attitude whereas in post-test the students who had unfavourable attitude had
UHGXFHG WR7KLVVKRZVWKHSURJUDPPHGLGQ¶WKDYHDQLPSDFWLQWKLVIDFWRU
Also while looking social dimension, at pre-test there were 15 (8.62%) students who
had a favourable attitude whereas after the sensitization programme the students who had
favourable attitude towards alcoholism on social dimension increased to 29 (16.67%) which
TABLE 4.4: Effectiveness of sensitization programme on knowledge regarding
alcoholism among college students
n=174
Knowledge Mean Mean
difference SD
³W´YDOXH
Calculated value Table value
Pre-test 17.44
9.95
3.30
26.9* 3.29
Post-test 27.39 3.99
P<0.05, *= Statistically significant
3DLUHG µW¶ WHVW ZDV GRQH WR DVVHVV WKHeffectiveness of sensitization programme on
knowledge regarding alcoholism among college students. The calculated value 26.9 was
greater than the tabulated value 3.29 at p<0.05 level. This shows there was a significant
difference in the pre and post-test level of knowledge regarding alcoholism. This shows the
sensitization programme on alcoholism was effective in improving the knowledge about
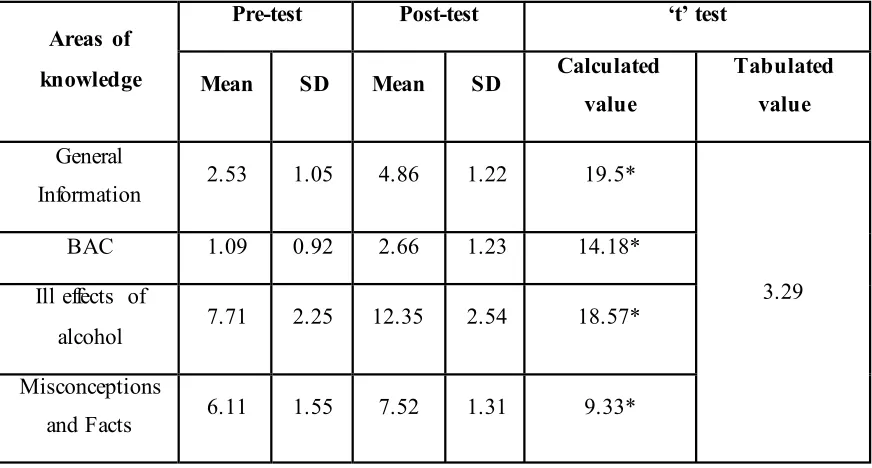
TABLE 4.5: Area wise mean and standard deviation of pre-test and post-test scores of
knowledge regarding alcoholism to find the effectiveness of sensitization programme in
all the areas n= 174
Areas of
knowledge
Pre-test Post-test µW¶WHVW
Mean SD Mean SD Calculated value
Tabulated
value
General
Information
2.53 1.05 4.86 1.22 19.5*
3.29
BAC 1.09 0.92 2.66 1.23 14.18*
Ill effects of
alcohol 7.71 2.25 12.35 2.54 18.57*
Misconceptions
and Facts 6.11 1.55 7.52 1.31 9.33*
P<0.05, *= statistically significant
The area wise distribution data of mean and standard deviation about knowledge of
college students regarding alcoholism GHSLFWHGLQWDEOHVKRZVWKDWWKHFDOFXODWHGµW¶YDOXHV
in all the areas; general information, BAC, ill effects of alcohol and misconceptions were
19.5, 14.18, 18.57 and 9.33 respectively. These calculated values in all areas were more than
the tabulated value, 3.29 at p<0.05 level of significance, which shows a significant difference
between pre-test and post-test level of knowledge. This shows the sensitization programme
on alcoholism was effective in improving the knowledge about alcoholism among college
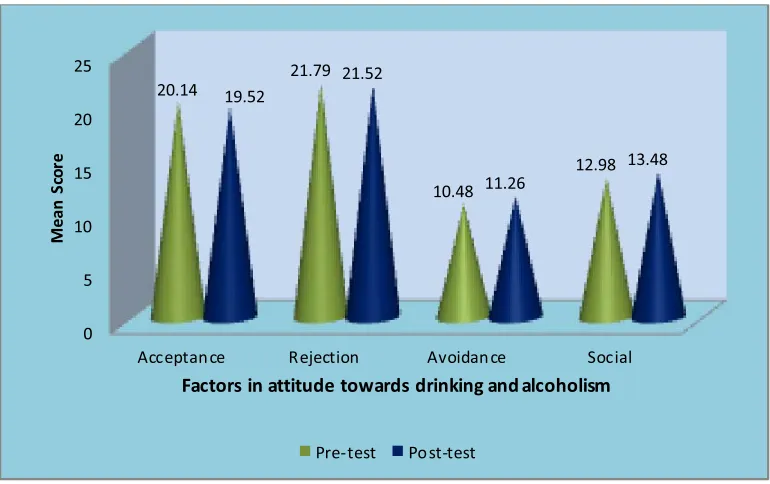
[image:40.612.89.525.132.366.2]TABLE 4.6: Effectiveness of sensitization programme on attitude towards drinking and
alcoholism among college students n=174
Factors
Pre-test Post-test µW¶YDOXH
Mean SD Mean SD Calculated value
Table value
Acceptance 20.14 7.25 19.52 7.80 0.91 (N.S)
3.29
Rejection 21.79 7.95 21.52 7.17 0.38 (N.S)
Avoidance 10.48 3.74 11.26 4.04 2.23 (N.S)
Social dimension 12.98 3.98 13.48 5.04 1.17 (N.S)
P<0.05, N.S= Not significant
3DLUHG µW¶ WHVW ZDV GRQH WR DVVHVV WKH HIIHFWLYHQHVV RI VHQVLWL]DWLRQ SURJUDPPH RQ
attitude towards drinking and alcoholism among college students. The calculated value of the
factors which consists of acceptance, rejection, avoidance and social dimension were 0.91,
0.38, 2.23 and 1.17 respectively which was not significant at 5% level of significance (Table
7). This shows there was no significant difference in the pre and post-test scores on attitude
[image:41.612.94.479.431.673.2]towards alcoholism among college students.
Figure 4.3: Comparison of factor wise pre-test and post-test mean scores of attitude
towards drinking and alcoholism
0 5 10 15 20 25
Acceptan ce Rejection Avoidan ce Social
20.14
21.79
10.48
12.98 19.52
21.52
11.26
13.48
Me
an
S
co
re
Factors in attitude towards drinking and alcoholism
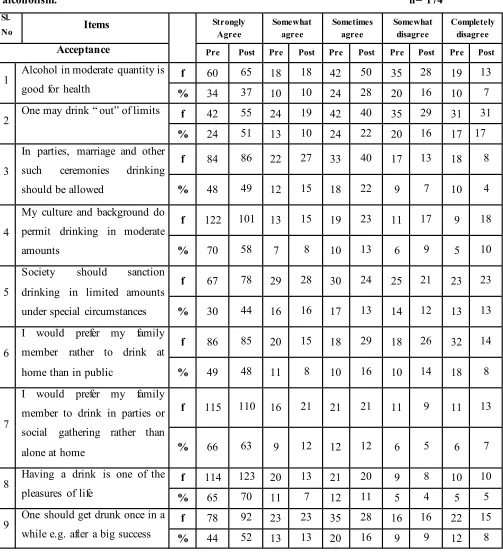
Table 4.7.1: Comparison of pre-test and post-test level of attitude towards drinking and
alcoholism. n= 174
Sl.
No Items
Strongly Agree
Somewhat agree
Sometimes agree
Somewhat disagree
Completely disagree
Acceptance Pre Post Pre Post Pre Post Pre Post Pre Post
1
Alcohol in moderate quantity is
good for health
f 60 65 18 18 42 50 35 28 19 13
% 34 37 10 10 24 28 20 16 10 7
2 2QHPD\GULQN³ RXW´RIOLPLWV f 42 55 24 19 42 40 35 29 31 31
% 24 51 13 10 24 22 20 16 17 17
3
In parties, marriage and other
such ceremonies drinking
should be allowed
f 84 86 22 27 33 40 17 13 18 8
% 48 49 12 15 18 22 9 7 10 4
4
My culture and background do
permit drinking in moderate
amounts
f 122 101 13 15 19 23 11 17 9 18
% 70 58 7 8 10 13 6 9 5 10
5
Society should sanction
drinking in limited amounts
under special circumstances
f 67 78 29 28 30 24 25 21 23 23
% 30 44 16 16 17 13 14 12 13 13
6
I would prefer my family
member rather to drink at
home than in public
f 86 85 20 15 18 29 18 26 32 14
% 49 48 11 8 10 16 10 14 18 8
7
I would prefer my family
member to drink in parties or
social gathering rather than
alone at home
f 115 110 16 21 21 21 11 9 11 13
% 66 63 9 12 12 12 6 5 6 7
8 Having a drink is one of the
pleasures of life
f 114 123 20 13 21 20 9 8 10 10
% 65 70 11 7 12 11 5 4 5 5
9 One should get drunk once in a
while e.g. after a big success
f 78 92 23 23 35 28 16 16 22 15
% 44 52 13 13 20 16 9 9 12 8
This table shows no major changes in the pre-test and post-test values, which
[image:42.612.58.561.94.648.2]Table 4.7.2: Comparison of pre-test and post-test level of attitude towards drinking and
alcoholism. n=174
Sl.
No Items
Strongly Agree
Somewhat Agree
Sometimes agree
Somewhat disagree
Completely disagree
Rejection Pre Post Pre Post Pre Post Pre Post Pre Post
10 All alcoholics should be put in
the jail.
f 64 53 21 17 30 33 29 32 30 39
% 36 30 12 9 17 18 16 18 17 22
11 Legal sale of alcohol should be
banned.
f 110 121 20 19 13 15 11 8 20 11
% 63 69 11 10 7 8 6 4 11 6
12
There is practically no
difference between drinking
and drunkenness
f 54 56 47 42 24 40 23 14 26 22
% 31 32 27 24 13 22 13 8 14 12
13
Alcohol is always harmful,
irrespective of the quantity,
frequency and duration of
drinking
f 98 103 28 23 19 23 15 10 14 15
% 56 59 16 13 10 13 8 5 8 8
14
If feasible, I would not allow
any of my family members to
enter the house if they came
dead drunk late at night
f 113 96 21 23 13 22 9 10 18 23
% 64 55 12 13 7 12 5 5 10 13
15 Alcoholism is a sin. f 107 96 17 26 16 27 13 8 24 17
% 61 55 9 14 9 15 7 4 13 9
16
I would not like that any of my
family member drink at all
f 110 113 12 17 10 14 9 7 33 23
% 63 64 6 9 5 8 5 4 18 13
17
Alcoholism is a
moral/character disorder.
f 92 90 34 31 21 25 11 17 16 11
% 52 51 19 17 12 14 6 9 9 6
18
Drinking should be a taboo in
every family
f 65 60 18 30 22 32 17 16 52 36
% 37 34 10 17 12 18 9 9 29 20
19
Drinking is just another way of
committing suicide.
f 97 94 29 33 21 22 16 16 17 9
% 55 54 16 18 12 12 9 9 9 5 This table shows no major changes in the pre-test and post-test values, which
Table 4.7.3: Comparison of pre-test and post-test level of attitude towards drinking and
alcoholism. n=174
Sl.
No Items
Strongly Agree
Somewhat Agree
Sometimes agree
Somewhat disagree
Completely disagree
Avoidance Pre Post Pre Post Pre Post Pre Post Pre Post
20
It is better not to touch alcohol
in the first place.
f 140 119 10 21 12 16 5 5 7 13
% 80 68 5 12 6 9 2 2 4 7
21 I would feel ashamed if anyone
in my family ever got drunk
f 91 88 30 19 7 19 12 10 34 38
% 22 50 17 10 4 10 6 5 19 21
22
Drink often brings out the
animal (Monster) inside the
human
f 116 98 26 27 12 17 6 7 14 25
% 66 56 14 15 6 9 3 4 8 14
23 Foreigners may drink but not
an Indian.
f 48 51 17 18 26 32 17 9 66 64
% 27 29 9 10 14 18 9 5 37 36
24
If I come across a drunk person
on the road, I will promptly go
to the other side
f 104 92 27 26 17 29 12 9 14 18
% 59 52 15 14 9 16 6 5 8 10