Estimating the
impact of
Traineeships
Final Report
June 2019
Richard Dorsett, Helen Gray
Stefan Speckesser and Lucy Stokes
National Institute of Economic and Social
2
Contents
List of figures 5
List of tables 6
Acknowledgements 8
Executive summary 9
Introduction 9
Methods 9
Results 10
Discussion and limitations 11
1. Introduction 14
1.1 The Traineeships programme 14
1.1.1 Policy background 14
1.1.2 Purpose of the programme 15
1.1.3 Changes to the eligibility criteria 15
1.2 The evaluation 16
1.3 Findings of the feasibility study 17
1.3.1 Data 17
1.3.2 Methods 17
1.4 Report outline 18
2. Data 19
2.1 Introduction 19
2.2 Data sources: contents, coverage and linkage 19
2.2.1 ILR-NCCIS-NPD 20
2.2.2 ILR-WPLS 22
2.3 Outcome measures 23
2.4 Observing eligibility for Traineeships 25
2.4.1 Adhering to the age requirements 25
2.4.2 Adhering to qualification requirements 26 2.4.3 Requirement that trainee has little previous work experience and is focused on
3
2.4.4 Additional data sources 27
3. Characteristics of Trainees 29
3.1 Introduction 29
3.2 Personal characteristics 29
3.3 Educational participation prior to Traineeship 31 3.4 Educational attainment prior to Traineeship 33
3.5 Timing of Traineeship start 36
3.6 Descriptive outcomes 37
3.6.1 Apprenticeship starts 38
3.6.2 Educational outcomes 39
3.6.3 Employment outcomes 39
3.6.4 Any positive outcome 40
4. Methods 42
4.1 Methodology of a non-experimental impact analysis 42
4.2 Propensity score matching 42
4.2.1 Constructing the comparison group 44
4.3 Instrumental Variables analysis 49
4.3.1 Overview 49
4.3.2 Constructing the instrument 51
4.3.3 Approach 53
5. Results 54
5.1 Introduction 54
5.2 Key findings 55
5.3 Propensity score matching estimates 56
5.3.1 Effects of Traineeships on take-up of Apprenticeships 56 5.3.2 Effects of Traineeships on further learning 59 5.3.3 Effects of Traineeships on employment 62 5.3.4 Effects of Traineeships on attainment of any positive outcome (apprenticeship,
further learning or employment) 63
5.4 IV estimates 65
4
6. Conclusions 74
6.1 Introduction 74
6.2 Effects of Traineeships on take-up of apprenticeships 74 6.3 Effects of Traineeships on further learning 74 6.4 Effects of Traineeships on employment 74 6.5 Effects of Traineeships on attaining any positive outcome 75
6.6 Discussion and limitations 75
References 77
Appendices 78
Appendix 1: NCCIS activity groups 78
Appendix 2: Characteristics of 19-23 year old Trainees 80 Appendix 3: Full detail on Propensity score matching 83
Implementation 83
Identification and estimation of programme impacts 83
Propensity scores and bootstrapping 85
Full results of the empirical analysis 87
Balancing tests 93
Appendix 4: Impact estimates by gender 99
5
List of figures
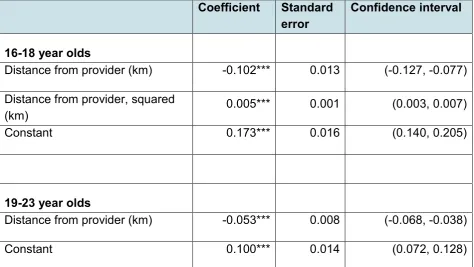
Figure 1 Histograms of propensity scores, ILR-NCCIS-NPD 46 Figure 2 Histograms of propensity scores, ILR-WPLS 47 Figure 3 The probability of Traineeship participation as a function of distance from
provider 52
Figure 4 Marginal treatment effect of Traineeship participation on becoming an
apprentice, 16-18 year olds 70
Figure 5 Marginal treatment effect of Traineeship participation on becoming an
apprentice, 19-23 year olds 70
Figure 6 Marginal treatment effect of Traineeship participation on employment, 16-18
year olds 71
Figure 7 Marginal treatment effect of Traineeship participation on employment, 19-23
year olds 72
Figure 8 Marginal treatment effect of Traineeship participation on unemployment, 19-23
6
List of tables
Table 1 Key data sources used in construction of linked datasets 20
Table 2 Summary of outcome measures 23
Table 3 Characteristics of Trainees and non-Trainees 30 Table 4 Educational participation prior to Traineeship 32 Table 5 Educational attainment prior to Traineeship (compulsory schooling) 33 Table 6 Educational attainment prior to Traineeship (post-compulsory schooling) 35
Table 7 Timing of Traineeship start 37
Table 8 Descriptive outcomes – summary: apprenticeships, further learning, employment 38
Table 9 Apprenticeships 38
Table 10 Learning outcomes 39
Table 11 Employment outcomes 40
Table 12 Any positive outcome (apprenticeship, further learning or employment) 41 Table 13 Impact of Traineeships on Apprenticeship starts 57 Table 14 Impact of Traineeships on Apprenticeship starts by age 58 Table 15 Impact of Traineeships on educational attainment 59 Table 16 Impact of Traineeships on educational attainment by age 61 Table 17 Impact of Traineeships on employment status 12 months after Traineeship
start, 16-18 year olds 62
7
Table 22 The results of estimating a probit model of Traineeship participation for the
matched sample 65
Table 23 Estimates of the average impact of Traineeship participation, IV and PSM 68
Table 24 NCCIS activity groups 78
Table 25 Characteristics of Trainees and non-Trainees, 19-23 year olds 80 Table 26 Prior attainment, 19-23 year olds 81 Table 27 Employment history, 19-23 year olds 82 Table 28 Propensity score estimates for Traineeship participants 2013/14, all 87 Table 29 Propensity score estimates for Traineeship participants 2013/14, age group
19+, ILR-WPLS 91
Table 30 Post matching tests of differences in observable characteristics, all participants 93 Table 31 Post matching tests of differences in observable characteristics, 19+ year old
participants, ILR-WPLS 97
Table 32 Impact of Traineeships on Apprenticeship starts by gender 100 Table 33 Impact of Traineeships on educational attainment by gender 101 Table 34 Impact of Traineeships on employment,16-18 year olds, by gender 102 Table 35 Impact of Traineeships on employment,19-23 year olds, by gender 102 Table 36 Impact of Traineeships on unemployment,19-23 year olds, by gender 103 Table 37 Impact of Traineeships on attaining any positive outcome,16-18 year olds, by
gender 104
Table 38 Impact of Traineeships on attaining any positive outcome,19-23 year olds, by
8
Acknowledgements
The evaluation of Traineeships was originally commissioned by the former Department for Business, Innovation and Skills (BIS).
We thank both Sophie Gerrard, who managed the project while at BIS, and Robert Haynes from the Department for Education (DfE), who became project manager during the project’s latter stages, for their advice and support. We are also grateful to Sophie Hedges (formerly of the Institute for Employment Studies) for her assistance with data setup.
9
Executive summary
Introduction
Traineeships are an education and training programme that provide young people aged 16-24 with an intensive period of work experience and work preparation training, as well as offering them support in improving their English and maths, to give them the best opportunity of entering an apprenticeship or employment.
This report estimates the impact of participating in a Traineeship. It forms part of a wider evaluation of the Traineeships programme. The evaluation includes the following strands:
• Surveys of trainees, employers and providers;
• Qualitative provider case studies to build up an in-depth picture of implementation;
• An analysis of national administrative data to estimate the impact of Traineeships. This report is based on the analysis of national administrative data and estimates the effect of participating in a Traineeship on the three intended outcomes of progress into an apprenticeship, further learning or employment. The impact is estimated by comparing the outcomes observed for those participating in Traineeships against an estimate of their expected outcomes if they had not participated in the programme.
Traineeships were introduced in August 2013 and the analysis in this report focuses on the cohort of young people who started a Traineeship in the 2013/14 academic year. The results presented in this report are therefore specific to participants in 2013/14. A number of changes to Traineeships have been made since the policy was introduced, which may have had an impact on the overall effectiveness of the programme.
Methods
The evaluation estimates impacts using propensity score matching (PSM). PSM is an econometric method that attempts to estimate the effect of an intervention by comparing the outcomes of participants to the outcomes of non-participants who have similar characteristics. It requires that we control for all influences on outcomes that differ between participants and non-participants.
10
Results
Overall, Trainees had positive outcomes in the 12 months after starting their Traineeship, with 29% beginning an apprenticeship and 57% starting further learning within this time frame. There is a more marked divide between 16-18 and 19-23 year old trainees, with the younger group less likely to begin employment1 within 12 months of starting a
Traineeship – 19% compared with 53%. The combined picture shows that around 75% of Trainees have started in any positive destination within 12 months of starting the
Traineeship.
The estimates of the impact of undertaking a Traineeship are based on PSM and IV techniques, comparing the outcomes observed for Trainees with an estimate of their expected outcomes had they not participated in the programme2. Key outcome variables
of the impact analysis were the comparative likelihood of Trainees progressing into an apprenticeship, further learning or a job, within 12 months of starting their Traineeship – and their status 12 months after their Traineeship start date. The intention of a
Traineeship is to give the trainee the skills to do a suitable level apprenticeship, Further Education (FE) course or job, once they are considered able to undertake these – this should be borne in mind when interpreting the various destinations of trainees.
Effects of Traineeships on attaining any positive outcome
• The PSM estimates indicate that for 16-18 year olds, Traineeships increased the likelihood of being in any positive destination (apprenticeship, further learning or employment) 12 months after starting the programme. There was also a significant impact on attaining any positive outcome within 12 months.
• For 19-23 year olds, there was also a significant positive impact on both being in a
positive destination 12 months after starting the Traineeship and on attaining any positive outcome within 12 months.
Effects of Traineeships on take-up of apprenticeships
• For 16-18 year olds, the PSM estimates indicate that Traineeships increased the
probability of being in an apprenticeship 12 months following the start of the
1 In this report, the outcomes for Trainees and non-Trainees are assessed as the likelihood of progressing
into further learning, an apprenticeship or employment. Here employment means “a job that is not an apprenticeship”, as apprenticeships contain a work-based element in addition to training.
2 It is important to note that not participating does not mean not doing anything; learners eligible for
11
Traineeship, and of starting an apprenticeship within 12 months. A positive impact was also apparent for Trainees aged 19 and over.
• Results from the IV analysis also show a positive impact on being an apprentice at 12 months for 16 to 18 year olds, but not for 19-23 year olds.
•
The PSM estimates indicate no impact on progression to an advanced or higher apprenticeship. Given outcomes were assessed 12 months after starting the Traineeship, it is perhaps not surprising that no impact was seen for progression to higher-level apprenticeships at this point.Effects of Traineeships on further learning
• Traineeships increased the likelihood of 16-18 year olds and 19-23 year olds
undertaking further learning 12 months following the start of the Traineeship.
• However, the impact was focused on low-level qualifications (Level 2), with some evidence that Traineeships reduced the likelihood of progressing to vocational education above Level 2 compared to what would have happened if the young person had not participated in a Traineeship. This is likely to be at least partly driven by the fact that Trainees had lower levels of educational attainment prior to starting their Traineeship.
Effects of Traineeships on employment
• Results from both the PSM and IV analysis for 16-18 year olds suggested that
Traineeships had no significant impact on the likelihood of a young person being employed 12 months after starting on the programme.
• For 19-23 year olds, the PSM analysis indicates a positive impact on being in employment 12 months after starting the Traineeship. The IV analysis found no significant effect on employment at 12 months.
Discussion and limitations
The PSM estimates indicate positive impacts of the Traineeships programme on progression to apprenticeships, and to further learning at Level 2, as well as negative effects on participation in Level 3 vocational education. This is likely to be at least partly driven by the fact that Trainees had lower levels of educational attainment prior to starting their Traineeship. For older Trainees, the PSM estimates suggest a positive impact on progression to employment.
12
apprenticeships for 16-18 year olds. However, no significant employment effect was found for either age group.
The differing results between the two approaches suggest our PSM estimates may be upward-biased. While the data used in our analysis are relatively rich, unobserved
characteristics are likely to affect whether individuals participate in a Traineeship. If these unobserved characteristics are also associated with achieving better outcomes, the resulting estimates may overstate the positive impact of the programme. As an aside, the ability to probe the assumptions underpinning PSM in this way arose from the detailed geographic information included in the data. While the results end up more ambiguous as a result of this sensitivity analysis, this helps avoid the problem of “incredible certitude” (Manski, 2011).
Some limitations of the analysis stem from the nature of the available data and the evolving policy landscape. With regard to data, impacts are estimated over a relatively short period of time (the 12 months after the learner had started on the programme). Repeating the analysis using later data extracts would make it possible to assess the impact of Traineeships over a longer period of time. With regard to policy, a number of changes to Traineeships have been made since the policy was introduced. These might have an impact on the overall effectiveness of the programme and so it should be borne in mind that the results presented in this report are specific to participants in the
academic year 2013/14.
With these caveats in mind, there is the question of how we assess the overall value of the programme. Apprenticeships and learning at level 2 appear to be boosted, while learning at a higher level is reduced, especially among younger Trainees. How to consider the balance of these effects is a question of judgement. The effects on employment are mixed; not significant for 16-18 olds and positive for 19-23 year-olds, although the IV results sound a note of caution for the latter. A fundamental question is whether promoting employment among 16-18 year-olds is an optimal aim when set against the alternatives of, for example, an apprenticeship. Longer-term, one might expect the latter to be associated with higher earnings. In this light, little
employment effect on younger Trainees might be viewed as a positive social outcome. In terms of effects on learning, it may be that a Traineeship guides learners to the
appropriate next level of study. In future analyses it would be valuable to consider whether such individuals are more likely to successfully complete their course, and their progression beyond that, compared with individuals who moved directly to higher
13
In the longer-term, an analysis based on Longitudinal Education Outcomes (LEO)3 data
might be beneficial, as it would provide more detailed information on young people, both in terms of outcomes and on individuals’ prior educational participation and achievement. This could potentially improve the match between treatment and comparison groups and reduce the likelihood that currently unobserved characteristics influence outcomes. Furthermore, rather than simply identifying whether there is an impact on being in employment or not, the LEO data would also allow examination of earnings, enabling exploration of whether Trainees not only progress to any job, but jobs with higher earnings in the longer-term.
3 LEO brings together data on education with data on employment, benefits and earnings, enabling
14
1. Introduction
Traineeships are an education and training programme that provide young people aged 16-24 with an intensive period of work experience and work preparation training, as well as offering them support in improving their English and maths, to give them the best opportunity of entering an apprenticeship or employment.
Traineeships were introduced in 2013 and this report presents estimates of the impact of Traineeships on the intended outcomes of progression to an apprenticeship, further learning or employment, based on the first year of the programme.
1.1 The Traineeships programme
1.1.1 Policy background
Traineeships are an integral part of the Government’s plans to tackle youth
unemployment. Backed by employers, they give motivated young people the skills, qualifications, experience and behaviours that employers look for when recruiting for apprenticeships and other jobs.
Traineeships are primarily intended for young people who:
• are not currently in employment and have little work experience, but who are focused on work and the prospect of it;
• are aged 16-24 (25 with an Education, Health and Care plan or Learning Difficulty Assessment)4 and qualified below level 3; and
• are believed by providers and employers to have a reasonable chance of being ready for employment or an apprenticeship within six months of engaging in a Traineeship (Department for Education and Department for Business, Innovation and Skills, 2015).
Traineeships are intended to last between six weeks and six months. The high degree of flexibility and freedom in the way Traineeships have been designed allows providers and employers to tailor Traineeships to the needs of individual Trainees as well as local employers. This flexibility is also reflected in the range of organisations that are involved in referring Trainees and delivering Traineeships – including Jobcentre Plus (JCP), local authorities, schools, colleges, Youth Contract providers, National Careers Service
advisers and National Citizen Service providers. Traineeships are built around several of
15
the same principles as apprenticeships; however, Traineeships are not jobs (unlike apprenticeships) so offer unpaid work experience.
1.1.2 Purpose of the programme
A successful Traineeship programme is one that secures a positive outcome for participants in the form of further training, apprenticeships or other sustainable
employment, reducing the proportion of young people not in employment, education and training (NEET).
This report focuses on the cohort of young people who started a Traineeship in the
2013/14 academic year. In this year, Traineeships were targeted at individuals who were:
• aged between 16 and 18 on 31 August in the relevant funding year and with qualifications below level 3.
• aged between 19 and 23 at the start of the Traineeship and with qualifications
below level 2.
• aged between 16 and 24 and subject to a Learning Difficulty Assessment (LDS) or
an Education, Health and Care Plan (EHCP) issued by their home local authority. As noted above, the learner must also be assessed as having a reasonable chance of being ready for employment or an Apprenticeship within six months of starting the
Traineeship. Participation was voluntary, so only a small proportion of young people who were eligible for a Traineeship actually chose to take part. However, over 10,000 young people participated in Traineeships in their first year of operation (BIS 2014: 3).
Experimental statistics for this cohort of Trainees indicated that 71 per cent of learners who completed their Traineeship in 2013/14 progressed to a sustained positive
destination5 (Department for Education, 2016).
1.1.3 Changes to the eligibility criteria
The original eligibility criteria for the programme were adjusted in August 2014 and
January 2015. From 1 August 2014 Traineeships became available to a slightly older age group – namely to those under the age of 25 at the start of the programme (i.e. including those without a LDS or EHCP). The qualification requirements were also standardised across the 16 to 18 and 19 to 24 age groups from 1 January 2015, so that learners with a
5 Defined as progressing to a sustained learning destination, including apprenticeships, a sustained
16
qualification below level 3 were potentially eligible for the programme provided they were in the 16-24 age range (BIS and DfE 2015: 4-5). As the analysis presented in this report focuses on a cohort of young people who started a Traineeship in the 2013/14 academic year, these changes would not affect the findings of the current study. However, it is possible that impacts for later Trainees would differ from those estimated in this report due to these changes.
An overview of the Traineeship programme and policy changes made since August 2014 are included in the 2015/16 Framework for Delivery (Department for Education and Department for Business, Innovation and Skills, 20156).
1.2 The evaluation
The evaluation team consists of a consortium of independent research partners, led by Kantar Public. NIESR was initially responsible for the analysis of national administrative data, with IES and Richard Dorsett playing an active role in the later stages of research. This report forms part of a wider evaluation of the impact of Traineeships. The evaluation includes the following strands:
• Surveys of trainees, employers and providers;
• Qualitative provider case studies to build up an in-depth picture of implementation;
• An analysis of national administrative data to estimate the impact of Traineeships.
Findings from a process evaluation on the first few months of the programme, based on surveys of trainees, providers and employers, were published in March 2015 (BIS 20157),
and findings from the process evaluation of year two of the Traineeship programme were published in July 2017 (Fitzpatrick et al., 20178).
This report is based on the analysis of national administrative data and estimates the effect of participating in a Traineeship on the three outcomes of progression into
employment, an apprenticeship or further learning. The impact is estimated by comparing
6
https://assets.publishing.service.gov.uk/government/uploads/system/uploads/attachment_data/file/410737/ Framework_for_delivery_2015-2016.pdf
7
https://www.gov.uk/government/uploads/system/uploads/attachment_data/file/412424/bis-15-189-traineeships-first-year-process-evaluation.pdf
8
17
the outcomes observed for those participating in Traineeships (also known as the
treatment group) against an estimate of their expected outcomes if they had not
participated in the programme (known as the counterfactual). To estimate the counterfactual it is necessary to observe outcomes for a comparison group of similar individuals. We discuss the methods used in our analysis in Chapter 4 of this report. The analysis presented in this report draws on the recommendations of an earlier feasibility study which used management information from the Individualised Learner Record (ILR), the Local Authorities National Client Caseload Information System
(NCCIS), and other sources on the population of interest, to understand the provision of Traineeships and identify methods suited to the robust evaluation of the programme. As part of this task, the feasibility study also considered data requirements for the impact evaluation. We briefly summarise the findings of the feasibility study below.
1.3 Findings of the feasibility study
1.3.1 Data
The feasibility study recommended that the evaluation used linked data from the ILR, the NCCIS and the National Pupil Database (NPD) to estimate the impact of participation in a Traineeship for young people aged between 16 and 19. The ILR provides management information on participation in Traineeships, as well as other further education, but does not include young people who have not participated in further education. As a result, a comparison group drawn from this source alone would exclude young people without prior participation in further education. The NCCIS provides information on the wider population of young people (aged 16-19), including those not in employment, education or training and therefore excluded from the ILR. Linking the NCCIS and ILR data to the NPD makes it possible to build up a more complete picture of educational participation and engagement prior to the Traineeship, which is vital to ensure that the treatment and comparison groups are well-matched.
As older learners are not observed in the NCCIS, the feasibility study also suggested using ILR data linked to information on employment and benefits from the Work and Pensions Longitudinal Study (WPLS) to estimate impacts for those aged between 16 and 23. In practice, it was only possible to obtain linked WPLS data for those aged 19 and above. These data provided information on the activities, or more specifically,
employment, of older Trainees.
1.3.2 Methods
18
sustained employment, an apprenticeship or further learning. This report estimates the effect of participating in a Traineeship rather than participating in the range of activities that eligible learners might have otherwise undertaken. It does not consider the impact of participating in a Traineeship compared to doing nothing.
The feasibility study recommended the use of propensity score matching and
instrumental variables analysis to estimate the impact of Traineeships on the outcomes of interest. Both methods were identified as likely to be appropriate, given the available data. The use of two different approaches also makes it possible to assess the
robustness of the findings to varying the method of analysis. The reasons for the choice of these two methods are explained later in the report, see chapter 4.
1.4 Report outline
Chapter 2 of this report describes the data used in the analysis and sets out the outcome measures considered. It also explains the main limitations of the available data for the purposes of addressing the current research questions and the approaches taken to seek to minimise these problems.
Chapter 3 uses these data to explore the characteristics of Trainees, including their demographic characteristics and background in terms of their participation in education and prior qualifications. It then moves on to consider their outcomes after starting on the programme, in terms of progression to an apprenticeship, further learning, or
employment.
Chapter 4 sets out the methods applied and explains how the analysis sought to estimate the impact of Traineeships and the assumptions which need to be met for the findings to be credible. It also assesses whether these assumptions are likely to hold.
19
2. Data
2.1 Introduction
The feasibility study identified a range of data sources that could be used for this evaluation, covering participation in Traineeships and other further education (the ILR), local authority data on the economic activity of young people (the NCCIS), background information on participation in education and educational attainment (the NPD) and data on benefit claims and employment (the WPLS). The feasibility study also proposed how these data sources could be combined for the purposes of this evaluation. This chapter describes the contents of these datasets, their coverage of the population of those eligible for Traineeships, and how they are linked together for analysis. It also sets out the main outcome measures that can be observed from these sources. Throughout the chapter the potential limitations of the linked datasets derived from these data sources are highlighted, along with the steps that were taken to seek to mitigate these limitations, where that was in fact possible.
2.2 Data sources: contents, coverage and linkage
The feasibility study proposed the use of two linked datasets to conduct the evaluation:
• Merged ILR-NCCIS-NPD
• Merged ILR-WPLS
20
Table 1 Key data sources used in construction of linked datasets
ILR-NCCIS-NPD ILR-WPLS (19-23)
ILR NCCIS NPD ILR WPLS
Demographic
characteristics √ √
Prior attainment √ √ √
Prior activity/employment √ (16-18) √
Prior educational participation (including absence, exclusions)
√
Employment outcomes √ (16-18) √ (19-23)
Apprenticeship √ √
Further learning √ √
2.2.1 ILR-NCCIS-NPD
Individualised Learner Record (ILR)
The ILR collects information on learners and their learning in the Further Education system in England. The ILR is constructed from records kept by the learning provider and includes contact details, demographic information, prior attainment, funding, details of the learning undertaken (known as a learning aim, and including start and end dates of each spell as well as the outcome), their employment status and their destination on
completing learning. An individual learner may have multiple records in an academic year if they undertake different learning aims, or study with different providers, or if their
circumstances change.9
A series of variables on the ILR recorded whether the learner was participating in a Traineeship and so these were used to identify the treatment group. The ILR records spells in further education (covering academic10 and vocational qualifications), but
excludes young people in other types of education, employment, unemployment or
9 For example, the provider is required to record employment status when the learner commences a
learning aim with them and then to update employment records when employment status changes (also recording the start and end dates of spells). Each update is recorded separately, rather than overwriting existing records.
10 This could include, for example, A levels or higher level qualifications (such as Level 4 or 5), as long as
21
inactivity. As a result, whilst the ILR should be completed by all providers offering Traineeships and therefore provide coverage of all Trainees, some young people who are eligible for a Traineeship, but do not participate (i.e. the potential comparison group) cannot be observed in ILR data.
National Client Caseload Information System (NCCIS)
As noted above, the key limitation of the ILR is that only individuals in further education are observed. As young people who had not had contact with a further education provider covered by the ILR could also be eligible for Traineeships, basing the analysis on the sample of learners observed on the ILR might mean that the comparison group differed from those actually undertaking Traineeships. Because the NCCIS covers all young people in England, it has the potential to provide a more representative sample of non-participants.
The NCCIS is compiled from information supplied by local authorities to the Department for Education. The NCCIS covers all those who are in year 11 and below school leaving age, to those below the age of 20, or below 25 if they have a learning difficulty or
disability. It records detailed monthly activity status11, covering employment, education
and training, along with individual characteristics. As the NCCIS only covers younger learners, we only use NCCIS to consider outcomes in our analysis for 16-18 year olds (we describe the outcome measures used for this evaluation in Section 2.3). The NCCIS data available for this analysis cover a 60-month period from September 2010 to August 2015.
National Pupil Database (NPD)
The NPD provides detailed information on pupils and the schools they attend. These detailed data are collected for pupils and schools in the state sector.12 The feasibility
study recommended that the ILR and NCCIS be combined with pupil-level data from the NPD to provide detailed background information on young people, including their
qualifications prior to undertaking the Traineeship. As well as providing demographic information, such as gender, age, ethnicity and region, the NPD extract contained
information on whether the pupil had special educational needs (SEN), their attainment at Key Stages 2, 3 and 4 (KS2, KS3 and KS4), school attendance and whether the pupil had been excluded from school for a fixed period of time. It was considered important to ensure that treatment and comparison groups were well-matched in terms of their rate of absenteeism whilst at school and whether they were excluded from school as it is
11 The detailed activity codes available on the NCCIS were combined into 11 broad categories; details are
provided in Appendix 1.
12 The same information is not available for pupils and schools in the independent sector, with the
22
possible that these might be related to their later motivation to find employment – one of the eligibility criteria for the Traineeships programme.
Merged ILR-NCCIS-NPD
The resulting linked dataset enables us to compare outcomes for Trainees with not only Trainees who were learners, but also to compare with the wider group of
non-Trainees who may not be learners (and therefore not observed in ILR), but who would be eligible to participate.
Overall, just over 10,000 young people were listed as Trainees in the ILR in 2013/14, and are used as the basis for the analysis using this linked dataset. While the ILR and NPD data allow us to conduct analysis for Trainees of all ages, NCCIS data are only available up to the age of 20. From this source we are therefore not able to explore impacts on employment outcomes for older Trainees. For this purpose, we instead use linked ILR-WPLS data.
2.2.2 ILR-WPLS
Work and Pensions Longitudinal Study (WPLS)
The Work and Pensions Longitudinal Study (WPLS) is an administrative dataset that links benefit and programme information held by the Department for Work and Pensions on its customers to employment and earnings records from HMRC. Data from the ILR could be linked to the WPLS for those individuals aged 19 and over, enabling us to examine impacts on employment.
Merged ILR-WPLS
Linked ILR-WPLS data were provided by the DfE. These data cover Trainees aged 19 and over. A separate ILR extract was provided to that used for constructing the linked ILR-NCCIS-NPD dataset. The ILR data provided for linking to WPLS comprised records for all learners aged between 19 and 23 who began a Traineeship in 2013/14, along with records for all learners aged between 19 and 23 who participated in any aim below level 3 in 2013/14 (this restriction aimed to ensure the non-Trainee group were more likely to be comparable). Records for learners who were undertaking an aim below level 3 in the previous year, 2012/13, were also provided (thus could also be considered as part of the potential non-Trainee comparison group). Where possible, for all of the above learners, records were linked to any learning aims undertaken in 2014/15 (and 2013/14 for the 2012/13 cohort), and also to WPLS records.
23
point, have been ILR learners. It also does not allow us to explore impacts for Trainees aged 16-18. At the time of this study, it was not possible to link WPLS data to the linked ILR-NCCIS-NPD dataset.
An indicator for participation in a Traineeship was provided on the dataset by the DfE. This linked dataset comprises information for just over 3,289 Trainees, who form the basis for the analysis using this linked dataset.
2.3 Outcome measures
In considering outcomes, we explore whether individuals were engaged in an
apprenticeship, further learning or employment 12 months following the start of their Traineeship. That is, if they began their Traineeship in September 2013, we consider their outcomes in September 2014. We also consider whether individuals undertook any of these activities within 12 months of starting their Traineeship, that is, at any point during the year following the start of their Traineeship. Table 2 summarises the outcome measures used in our analysis, the sources from which they are taken and the age range they cover; we describe these measures in further detail below.
As well as employment, we also consider outcomes in terms of unemployment for those aged 19-23, measured in terms of whether individuals were recorded as being in receipt of Jobseekers’ Allowance (JSA) in the WPLS. Finally, we also combine information on whether learners progress to an apprenticeship, further learning or employment, in order to ascertain whether they achieve “any positive outcome”. Due to the limitations of the data (i.e. that assessing impacts on employment relies on the use of different datasets), we explore this separately for 16-18 year olds and for 19-23 year olds.
As mentioned in the introduction to this report, our analysis involves the comparison of outcomes for Trainees with those of a comparison group. As this comparison group did not participate in the programme, it is necessary to assign them an artificial date of starting on the programme (known as a pseudo-start date), so that outcomes can be measured from this point onwards. This pseudo-start date is derived by assigning young people at random to a start date which follows the known distribution of start dates observed for programme participants.
Table 2 Summary of outcome measures
Outcome Measure Age
range Source dataset Linked
Apprenticeships In apprenticeship 12 months post
24
Outcome Measure Age
range Source dataset Linked
Began apprenticeship within 12
months of (pseudo-) start All ILR ILR-NCCIS-NPD In advanced or higher
apprenticeship aim 12 months post (pseudo)-start
All ILR ILR-NCCIS-NPD
Began advanced or higher
apprenticeship aim within 12 months of (pseudo-) start
All ILR ILR-NCCIS-NPD
Further learning In learning 12 months post
(pseudo)-start All ILR ILR-NCCIS-NPD
Began another learning aim within
12 months of (pseudo-) start All ILR ILR-NCCIS-NPD Undertaking a Level 2 learning aim
12 months post (pseudo)-start All ILR ILR-NCCIS-NPD Undertaking a Level 3 or higher
learning aim 12 months post (pseudo)-start
All ILR ILR-NCCIS-NPD
Any non-traineeship aim (Level 2) started within 12 months of (pseudo-) start
All ILR ILR-NCCIS-NPD
Any non-traineeship aim (Level 3 or higher) started within 12 months of (pseudo-) start
All ILR ILR-NCCIS-NPD
Employment In employment 12 months post
(pseudo)-start 16-18 NCCIS ILR-NCCIS-NPD Any employment within 12 months of
(pseudo)-start 16-18 NCCIS ILR-NCCIS-NPD In employment 12 months post
(pseudo)-start 19-23 WPLS ILR-WPLS Any employment within 12 months of
25
Outcome Measure Age
range Source dataset Linked
Unemployment Receiving JSA 12 months post
(pseudo)-start 19-23 WPLS ILR-WPLS Any JSA received within 12 months
of (pseudo-) start 19-23 WPLS ILR-WPLS
Any positive
outcome In apprenticeship, further learning or employment 12 months post(pseudo)-start
16-18 ILR,
NCCIS ILR-NCCIS-NPD
Starts apprenticeship, further learning or employment within 12 months of (pseudo-) start
16-18 ILR,
NCCIS ILR-NCCIS-NPD
In apprenticeship, further learning or employment 12 months
post(pseudo)-start
19-23 ILR,
WPLS ILR-WPLS
Starts apprenticeship, further learning or employment within 12 months of (pseudo-) start
19-23 ILR,
WPLS ILR-WPLS
2.4 Observing eligibility for Traineeships
For the treatment and comparison groups to be well-matched, it was necessary to draw the comparison group from a sample of young people who were eligible for Traineeships. This section explains how the linked data were used to identify those likely to be eligible for Traineeships. Ultimately, a number of other characteristics are also used in order to construct the comparison group, as discussed in Chapter 4.
2.4.1 Adhering to the age requirements
26
2.4.2 Adhering to qualification requirements
The qualification requirements for Traineeship eligibility only applied to learners aged between 16 and 23. The ILR contained information on qualifications held by learners prior to starting the Traineeship. However, this variable suffers from consistent underreporting. For the linked ILR-NCCIS-NPD data, the pre-existing qualifications
included in this analysis were taken from KS4 leaver data within the NPD and the post-16 learning participation and outcomes data from the ILR. For the linked ILR-WPLS data, it was necessary to rely on prior attainment as recorded on the ILR.13
2.4.3 Requirement that trainee has little previous work experience and
is focused on work
The ILR records the learner’s employment status prior to enrolment. This is recorded by the provider at the point when they enrol. Traineeships are supposed to be targeted at individuals who are not working, have little work experience, but are focused on work. The ILR does not provide the sort of information that could be used to quantify the amount of work experience that the learner has. However, in the linked ILR-NCCIS-NPD data it was possible to use information from the NCCIS on what the learner was doing three months before starting the Traineeship to ensure that the treatment and
comparison groups were well-matched in terms of prior activities. In the linked ILR-WPLS data, it was possible to use information on prior employment based on the WPLS to match individuals based on previous work histories.
It was not possible to observe whether an individual met the requirement of being
focused on work within any of the available data, or to develop a measure that might act as a proxy for this. This results in a potential unobserved difference between the
treatment and comparison groups which might result in differences in outcomes for the two groups if Trainees are better-motivated to find work than those in the comparison group, for example. There is a risk that this biases the PSM impact estimates, as any difference in outcomes between the treatment and comparison groups may be partly due to differences in their level of motivation, rather than the impact of the Traineeships programme. Access to richer data might reduce this risk, although it is unlikely to resolve it, due to the difficulty in capturing attitudinal information within large-scale administrative data.
13 If we observed that an individual achieved a higher level qualification based on the most recent aim prior
27
2.4.4 Additional data sources
Having constructed the linked ILR-NCCIS-NPD and linked ILR-WPLS datasets, some gaps remained in the range of information available on Trainees and the potential comparison group. In many cases it was possible to match on information from other sources to build up a more complete picture of provision for participants and non-participants. This process is described in the subsections which follow.14
Identifying potential providers of Traineeships
When Traineeships were first introduced, not all providers were eligible to offer these. As the ILR data extract did not contain information on whether the provider met the criteria to offer Traineeships, this information was matched on from a spreadsheet produced by the Skills Funding Agency (SFA).15 Providers with an Ofsted rating of Outstanding or Good
on 1 August 2013, which did not subsequently receive a grade 4 rating, or a notice of concern, were able to offer Traineeships.16 It was assumed that if a provider did not
appear on the SFA list of providers, they were therefore ineligible to offer Traineeships.17
Identifying distance to Traineeship providers
The May 2014 version of the National Statistics Postcode Look-up file (NSPL) was used to identify the precise location of providers (using Northings and Eastings) so that the distance from the delivery location to the learner’s home could be calculated. At the time of conducting the feasibility study, information on learner postcodes was available, and used in constructing a measure of distance to the nearest provider. This remained possible for our analysis using the linked ILR-WPLS data. However, learner postcodes were not available in our linked NPD-NCCIS-ILR data, and so analysis of these data instead make use of the Lower Layer Super Output Area (LSOA) of the learner instead. We discuss this issue in more detail in Chapter 4.
14 In addition to the data described below, the Learning Aims Reference Service (LARS) dataset was
used to match on subject area categories and qualification levels for the aims undertaken by learners, since only codes were included in the ILR data extract.
15 The analysis used the version dated 26 June 2014.
16 The requirement for providers to meet the specified Ofsted criteria was removed with effect from 1
February 2016.
28
Local area characteristics
Data on local area characteristics was also matched on, namely data on the unemployment rate18 and on the urban-rural classification of the local area.19
18 Unemployment rate for 16-64 year olds, 12 months prior to September 2013, Travel To Work Areas.
Source: Annual Population Survey, ONS, downloaded from NOMIS 12 September 2014 (ONS Crown Copyright).
19 In the ILR-NCCIS-NPD data, information on the urban-rural classification was matched on at LSOA level;
29
3. Characteristics of Trainees
3.1 Introduction
This chapter compares the characteristics of Trainees with those of individuals who do not undertake a Traineeship (referred to from here onwards as non-Trainees). The chapter begins by describing the demographic characteristics and background of both groups, including their participation in education and their educational attainment prior to the Traineeship. In describing these characteristics we focus on the Trainees and non-Trainees observed in the linked ILR-NCCIS-NPD data, which covers the full eligible age range. Here non-Trainees are those KS4 leavers who do not go on to undertake a Traineeship - they may however have been undertaking other learning, pre-employment programmes or work. It is possible to identify 92 per cent of Trainees in the NPD.
However, for some characteristics data are not available for all individuals; for each characteristic the number of observations on which the analysis is based is reported. Equivalent characteristics based on the linked ILR-WPLS data, which covers those aged 19 and over, are presented in Appendix 2.
The chapter then goes on to provide information on when learners started their
Traineeship, based on both the NCCIS-NPD for all Trainees, and based on the ILR-WPLS for the subset of Trainees aged 19-23. Finally the chapter describes outcomes for Trainees and the comparison group, using both the ILR-NCCIS-NPD and the ILR-WPLS. These outcomes include further learning, apprenticeships and employment, as discussed in Chapter 2.
Throughout this chapter, history and outcomes are considered in relation to the pseudo-start date for the comparison group, since they did not actually pseudo-start a Traineeship over the time period considered. In order to make data processing manageable, our analysis is based on a random ten per cent sample of non-Trainees. Alldescriptives for non-Trainees presented in this chapter are therefore also based on this random ten per cent sample of non-Trainees.
All the analysis presented in this chapter is based on a comparison between Trainees and the comparison group prior to matching. It cannot therefore be used to draw conclusions about the impact of Traineeships.
3.2 Personal characteristics
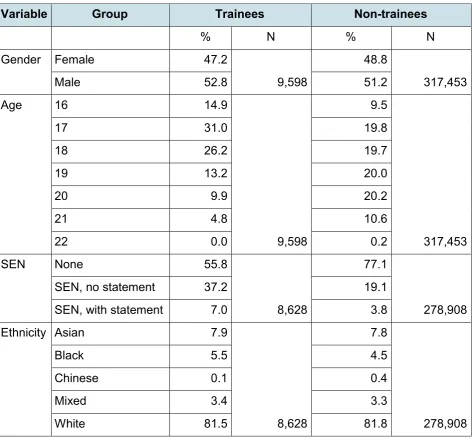
Table 3 shows the demographic characteristics of Trainees compared with non-Trainees.
• A slightly higher percentage of Trainees were male (53% compared with 51% of
30
• Trainees were typically younger than non-Trainees; 72 per cent were aged between 16 and 18 compared with 49 per cent of non-Trainees.
• Trainees were more likely to have been identified as having special educational needs (SEN), seven per cent had a statement of SEN, while a further 37 per cent were identified as having SEN but had not been issued with a statement. The equivalent percentages for non-Trainees were four per cent and 19 per cent respectively.
• The distribution of Trainees by broad ethnic group was similar to that of
non-Trainees.
• Trainees were more commonly from the North West; one quarter (25%) were
[image:30.595.59.532.299.741.2]located in this region at the time they completed KS4, compared with 14 per cent of non-Trainees.
Table 3 Characteristics of Trainees and non-Trainees
Variable Group Trainees Non-trainees
% N % N
Gender Female 47.2
9,598
48.8
317,453
Male 52.8 51.2
Age 16 14.9
9,598
9.5
317,453
17 31.0 19.8
18 26.2 19.7
19 13.2 20.0
20 9.9 20.2
21 4.8 10.6
22 0.0 0.2
SEN None 55.8
8,628
77.1
278,908
SEN, no statement 37.2 19.1
SEN, with statement 7.0 3.8
Ethnicity Asian 7.9
8,628
7.8
278,908
Black 5.5 4.5
Chinese 0.1 0.4
Mixed 3.4 3.3
31
Variable Group Trainees Non-trainees
Any other group 0.6 1.2
Unclassified/other 1.0 1.1
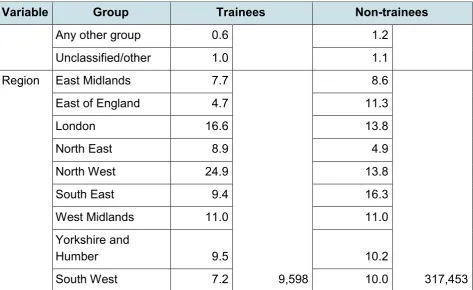
Region East Midlands 7.7
9,598
8.6
317,453
East of England 4.7 11.3
London 16.6 13.8
North East 8.9 4.9
North West 24.9 13.8
South East 9.4 16.3
West Midlands 11.0 11.0
Yorkshire and
Humber 9.5 10.2
South West 7.2 10.0
Note: Unweighted bases differ due to differing levels of missing values on the variables presented. Source: Linked ILR-NCCIS-NPD
[image:31.595.58.532.55.345.2]3.3 Educational participation prior to Traineeship
Table 4 describes young people’s previous participation in education.
• Trainees were more likely to have completed their Key Stage 4 (KS4)
qualifications more recently than non-Trainees, reflecting the fact that they tended to be younger.
• The school attendance of Trainees in their final year of KS4 was lower than for non-Trainees. Furthermore, when looking at unauthorised absence, whilst 61 per cent of non-Trainees had no unauthorised absence in their final year of KS4 education, this was the case for just 45 per cent of Trainees.
• Trainees were also more likely to have been excluded from school in this final year, with nearly 10 per cent receiving one or more fixed-period exclusions, compared to less than 5 per cent of non-Trainees.
• Trainees and non-Trainees were fairly similar in terms of the amount of time that they spent in education after the age of 16. The younger age profile of Trainees may explain why Table 4 indicates that Trainees appeared to have fewer
32
Table 4 Educational participation prior to Traineeship
Variable Group Trainees Non-trainees
% N % N
KS4 final
year 2009 7.9
9,598
20.3
317,453
2010 11.5 20.1
2011 20.8 19.8
2012 29.0 19.7
2013 30.7 20.1
Sessions
missed No session missed 17.1
10,383
15.8
318,006
One session missed 1.3 1.9
Two to nine sessions
missed 14.5 24.0
Ten to 24 sessions
missed 25.6 29.7
25 to 49 sessions missed 22.0 18.9 More than 50 sessions
missed 19.6 9.6
Unauthorised
sessions No session missed 45.0
10,383
60.6
318,006
One session missed 4.6 6.3
Two to nine sessions
missed 22.8 19.9
Ten to 24 sessions
missed 12.5 7.3
25 to 49 sessions missed 7.3 3.1 More than 50 sessions
missed 7.8 2.8
Exclusions None 90.3
10,383
95.3
318,006
One or more 9.7 4.7
Years of
post-16 FE None 45.4
10,383
48.3
318,006
One 27.3 19.0
Two 17.9 21.1
33
Variable Group Trainees Non-trainees
Four 2.1 2.6
Source: Linked ILR-NCCIS-NPD
3.4 Educational attainment prior to Traineeship
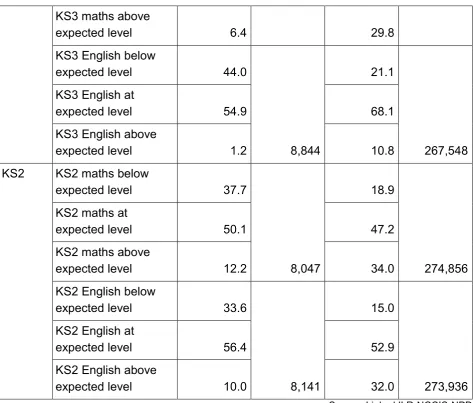
• Moving on to the qualifications held by learners before they started a Traineeship,
Table 5 shows that Trainees were much less likely to have attained any A*-C grade GCSEs than non-Trainees. Just 11 per cent of Trainees had five or more GCSEs at grades A*-C, compared with 53 per cent of non-Trainees.
• Key Stage 3 (KS3) qualifications for Trainees were also lower than those for non-Trainees. Around two-in-five Trainees (44%) were below the expected level in Maths, compared with one-in-five non-Trainees (19%). Similarly, 44 per cent of Trainees were below the expected level in English compared with 21 per cent of non-Trainees.
• Trainees were also more likely to be below the expected levels in Maths and
English at Key Stage 2 (KS2).
• These findings suggests that Trainees experienced lower levels of
educational attainment than non-Trainees and that this divergence occurred
at an early stage in their schooling.
Table 5 Educational attainment prior to Traineeship (compulsory schooling)
Variable Group Trainees Non-trainees
% N % N
GCSEs 0 GCSE A*-C passes 47.4
9,598
17.9
317,453
1 GCSE A*-C pass 16.0 7.6
2 GCSE A*-C passes 9.6 5.8
3 GCSE A*-C passes 7.0 5.2
5 GCSE A*-C passes 9.0 10.4
More than 5 GCSE
A*-Cs 11.0 53.1
KS3 KS3 maths below
expected level 43.5
8,851
19.1
268,039 KS3 maths at
34 KS3 maths above
expected level 6.4 29.8
KS3 English below
expected level 44.0
8,844
21.1
267,548 KS3 English at
expected level 54.9 68.1
KS3 English above
expected level 1.2 10.8
KS2 KS2 maths below
expected level 37.7
8,047
18.9
274,856 KS2 maths at
expected level 50.1 47.2
KS2 maths above
expected level 12.2 34.0
KS2 English below
expected level 33.6
8,141
15.0
273,936 KS2 English at
expected level 56.4 52.9
KS2 English above
expected level 10.0 32.0
[image:34.595.58.532.51.454.2]Source: Linked ILR-NCCIS-NPD
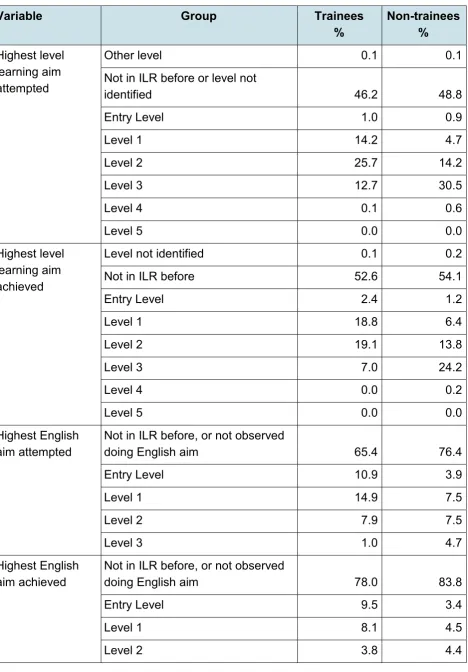
Table 6 considers the qualifications attained by Trainees after they reached the end of compulsory schooling, but prior to starting their Traineeship.20 It generally suggests that
Trainees attempted and achieved learning aims which were at a lower level to those attempted and achieved by non-Trainees. It was also the case that Trainees appeared to be attempting to gain, and achieving, lower-level aims in English and Maths than non-Trainees before they started the non-Traineeship. This could in part reflect the younger age profile of Trainees compared with non-Trainees.
20 A sizeable proportion are not observed in the ILR, which will in part be due to the fact that many are
35
Table 6 Educational attainment prior to Traineeship (post-compulsory schooling)
Variable Group Trainees
% Non-trainees %
Highest level learning aim attempted
Other level 0.1 0.1
Not in ILR before or level not
identified 46.2 48.8
Entry Level 1.0 0.9
Level 1 14.2 4.7
Level 2 25.7 14.2
Level 3 12.7 30.5
Level 4 0.1 0.6
Level 5 0.0 0.0
Highest level learning aim achieved
Level not identified 0.1 0.2
Not in ILR before 52.6 54.1
Entry Level 2.4 1.2
Level 1 18.8 6.4
Level 2 19.1 13.8
Level 3 7.0 24.2
Level 4 0.0 0.2
Level 5 0.0 0.0
Highest English
aim attempted Not in ILR before, or not observed doing English aim 65.4 76.4
Entry Level 10.9 3.9
Level 1 14.9 7.5
Level 2 7.9 7.5
Level 3 1.0 4.7
Highest English
aim achieved Not in ILR before, or not observed doing English aim 78.0 83.8
Entry Level 9.5 3.4
Level 1 8.1 4.5
36
Variable Group Trainees
% Non-trainees %
Level 3 0.6 3.9
Highest maths aim
attempted Level not identified Not in ILR before, or not observed 0.0 0.0
doing Maths aim 68.5 78.3
Entry Level 11.3 4.1
Level 1 13.9 7.0
Level 2 5.7 6.5
Highest maths aim
achieved Level not identified Not in ILR before or not observed 0.0 0.0
doing Maths aim 80.0 85.3
Entry Level 10.6 3.8
Level 1 6.5 4.0
Level 2 2.6 4.1
Base: 10,383 Trainees and 318,006 non-Trainees. Source: Linked ILR-NCCIS-NPD
3.5 Timing of Traineeship start
37
Table 7 Timing of Traineeship start
ILR-NCCIS-NPD (19-23 year olds only) ILR-WPLS
Start date/Pseudo start
date Trainees % trainees
Non-%
Trainees %
Non-trainees
%
Aug-13 4.7 4.7 6.4 6.3
Sep-13 8.2 8.2 10.3 10.3
Oct-13 6.6 6.6 6.8 6.9
Nov-13 6.4 6.4 5.5 5.4
Dec-13 3.9 3.8 3.2 3.1
Jan-14 10.4 10.4 9.5 9.5
Feb-14 9.0 8.9 8.4 8.3
Mar-14 12.2 12.2 11.7 11.8
Apr-14 8.9 8.9 11.5 11.6
May-14 8.9 8.9 10.4 10.3
Jun-14 8.3 8.3 8.8 8.8
Jul-14 10.0 10.0 7.6 7.6
Aug-14 2.5 2.5 - -
Base: ILR-NCCIS-NPD:10,383 Trainees, 318,006 Trainees; ILR-WPLS: 3,289 Trainees, 414,679 non-Trainees
3.6 Descriptive outcomes
The following sections describe observed outcomes for Trainees and non-Trainees. As noted earlier, the descriptives for non-Trainees are based on findings for a random ten per cent sample of non-Trainees; they do not take account of differences in the
characteristics of Trainees and non-Trainees. As such, these descriptive outcomes
should not be used to draw conclusions about the impact of Traineeships.21 Table
8 presents a summary of these descriptive outcomes, from which it can be seen that Trainees were more likely than non-Trainees to have started an apprenticeship, further
21 Note that these percentages differ from those presented later in Chapter 5 due to the different sample on
38
[image:38.595.60.534.119.320.2]learning (excluding learning in schools) or employment within 12 months of the start (or pseudo-start) of the Traineeship.
Table 8 Descriptive outcomes – summary: apprenticeships, further learning, employment
Variable Trainees
% Non-trainees %
Any positive outcome within 12 months: 16-18 years 74.1 48.8 Any positive outcome within 12 months: 19-23 years 75.8 46.4
Started apprenticeship within 12 months 28.6 4.6 Started further learning within 12 months 56.7 24.2 Started employment within 12 months: 16-18 years 19.4 11.7 Started employment within 12 months: 19-23 years 52.9 28.5
Base: 10,383 Trainees and 318,006 non-Trainees
3.6.1 Apprenticeship starts
Table 9 shows that Trainees were much more likely to be in an apprenticeship than non-Trainees 12 months following the (pseudo-)start of the non-Traineeship, and to have begun an apprenticeship within 12 months of this date. The following chapter explores whether this difference can be attributed to the impact of the programme. Trainees were also more likely to have started an advanced or higher apprenticeship.
Table 9 Apprenticeships
Variable Trainees
% Non-trainees %
Started apprenticeship within 12 months 28.6 4.6 In apprenticeship 12 months post-start 23.7 4.0
Started advanced or higher apprenticeship
within 12 months 3.6 1.9
In advanced or higher apprenticeship 12
months post-start 3.3 1.7
39
3.6.2 Educational outcomes
Table 10 shows Trainees were more likely to be observed on the ILR as participating in a learning aim 12 months following the start of the Traineeship than non-Trainees.
Trainees were also more likely to have started another learning aim within 12 months of starting the Traineeship. It is important to bear in mind that these are learning outcomes based on whether individuals are observed in the ILR. Non-Trainees may be engaged in learning in schools, or for older individuals, in higher education, neither of which would be captured in these measures. However, it is unlikely that those non-Trainees who are undertaking KS5, or are in higher education, are likely to form the most appropriate comparison group for those individuals undertaking a Traineeship.
Table 10 Learning outcomes
Variable Trainees
% Non-trainees %
Started another learning aim within 12 months 56.7 24.2 In learning 12 months post-start 40.1 17.2
Level 2 aim started within 12 months 36.7 8.2 Level 3 or higher aim started within 12 months 8.6 12.4 In level 2 learning 12 months post start 27.7 5.6 In level 3 or higher learning 12 months post
start 6.8 9.8
Base: 10,383 Trainees and 318,006 non-Trainees. Note if an individual undertook both a Level 2 and Level 3 or higher aim, they are counted once within the Level 3 or higher category.
Differences are apparent however by the level of learning. Trainees were more likely to be undertaking a Level 2 or higher learning aim 12 months post-starting the Traineeship. Further exploration shows that this is driven by Trainees being more likely to undertake further learning at Level 2; non-Trainees were more likely to be undertaking a Level 3 or higher learning aim. This is likely to be at least partly driven by the fact that Trainees had lower levels of educational attainment prior to starting the Traineeship, as discussed earlier in section 3.1.3.
3.6.3 Employment outcomes
Table 11 reports employment outcomes for the two separate age groups considered in our analysis. Among 16-18 year olds, around 15 per cent of Trainees were in
40
For 19-23 year olds, Trainees were more likely to be in employment 12 months following the start of the Traineeship (40% of Trainees compared with 23% of non-Trainees). A similar pattern is observed if we instead consider whether individuals had any
employment spell within 12 months of starting the Traineeship.
Table 11 Employment outcomes
Variable Trainees
% Non-trainees %
16-18 year olds
Any employment within 12 months 19.4 11.7
In employment 12 months post-start 14.8 9.8
19-23 year olds
Any employment spell within 12 months 52.9 28.5 In employment 12 months post-start 40.1 22.5
Base: 16-18 year olds (6,190 Trainees and 134,974 non-Trainees); 19-23 year olds (3,289 Trainees and 414,679 non-Trainees)
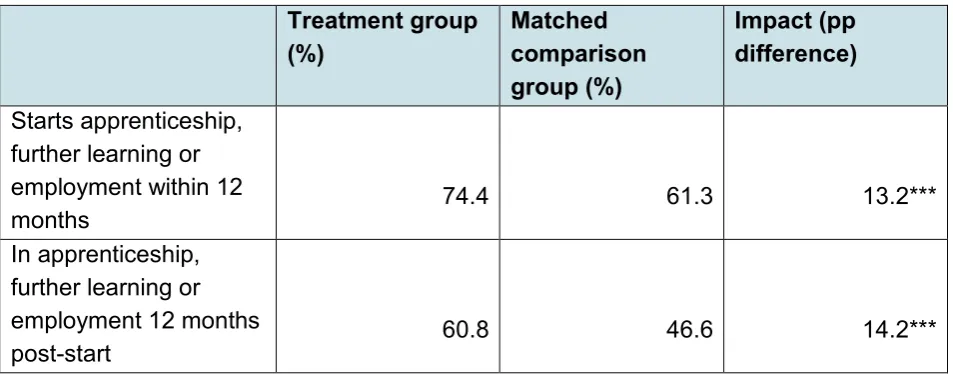
3.6.4 Any positive outcome
Table 12 summarises differences in obtaining any positive outcome. For both age
41
Table 12 Any positive outcome (apprenticeship, further learning or employment)
Variable Trainees
% Non-trainees %
16-18 year olds
Starts apprenticeship, further learning or
employment within 12 months 74.1 48.8
In apprenticeship, further learning or
employment 12 months post-start 60.5 38.9
19-23 year olds
Starts apprenticeship, further learning or
employment within 12 months 75.8 46.4
In apprenticeship, further learning or
employment 12 months post-start 55.2 35.5
42
4. Methods
4.1 Methodology of a non-experimental impact analysis
This report aims to provide estimates of the quantitative impact of Traineeship
participation on outcomes of participants in the year 2013/14. As described earlier in this report, we consider outcomes in terms of progression to apprenticeships, further learning and employment.
The impact estimates in this report represent an effect of the programme on participants (i.e. treatment on the treated). As mentioned in the introduction to this report, two main methods are used to conduct the impact analysis – propensity score matching and
instrumental variables analysis. The following sections describe how each of these methods attempt to estimate the counterfactual and to compare this to observed outcomes for participants in order to estimate the impact of Traineeships.
4.2 Propensity score matching
Participation in Traineeships is not a random process22. Therefore, participants and
non-participants show notable differences in characteristics affecting both participation and outcomes as shown in the previous chapter on the ‘Characteristics of Trainees’. As a consequence, the unadjusted observed outcomes of non-participants do not represent a valid counterfactual estimate for participants.
For this reason, we estimate the counterfactual outcome using propensity score matching23. Propensity score matching is an econometric method that attempts to
estimate the effect of an intervention by comparing the outcomes of participants to the outcomes of non-participants who have similar characteristics. When participation appears to be determined by several factors it is difficult to find distinct individuals in the two groups who are similar in terms of (or can be ‘matched on’) every relevant
characteristic. Propensity Score Matching deals with this by taking into account all the relevant factors to determine the probability of each individual’s participation, and matching them for comparison with non-participants who had similar estimated probabilities of participating. The possibility of bias arises when some of those characteristics are unobserved. In this case the conditional independence
22 Although some element of randomness exists with regard to local availability of Traineeship options,
which we exploit in the IV analysis described below to provide an alternative estimate of programme impacts.
43
assumption24 is not met. The richness of the data, which includes education
biographies, information about previous educational attainment back to primary school (at least in the case of the linked ILR-NCCIS-NPD data) and the record of participation and attainment in education of participants and non-participants after leaving secondary school, allows a great deal of the young people’s education trajectories to be observed and included in the propensity score matching. This reduces the sources of unobserved heterogeneity.
The majority of our analysis is conducted using the linked ILR-NCCIS-NPD data. Since all of the participants analysed here, observed with pre-existing qualifications in the NPD, left secondary school between July 2009 and July 2013, the universe of all
non-participants was drawn as a ten per cent random sample from the KS4 leavers of these five school years. Using these data, we observe the particular characteristics of
Traineeship participants and then – using propensity score matching – estimate a counterfactual outcome with similar characteristics, in particular previous education achievement and the pre-programme education and labour market biography. The difference between observed labour market and education outcomes after the
programme of the participants and the estimated non-participation counterfactual can be interpreted as an estimate of the programme effect if specific assumptions, which we outline in the next section, are likely to hold.
Propensity scores were estimated using binomial Probit models explaining individual participation of particular groups (by age and by gender) in the Traineeship programme compared to non-participation25 on the basis of the following observable characteristics:
• Socio-economic/demographic characteristics (Sex, Age, Ethnic group, SEN,
Region, Year of KS4)
• Achievement and behaviour in final year of KS4 (Number of GCSEs A*-C,
Number of sessions absent from class, Unauthorised absence, Number of exclusions)
• Post-16 education participation and outcomes as found in ILR (Years of
post-16 education, Level of highest aim attempted post-post-16, Level of highest aim achieved post-16)
24 The conditional independence assumption requires that all difference