http://www.iemss.org/society/index.php/iemss-2014-proceedings
Global sensitivity analysis of key parameters in a
process-based sugarcane growth model – A
Bayesian approach
Justin Sextona, Yvette Everinghama a
School of Engineering and Physical Sciences, James Cook University, Townsville 4811, [email protected]
Abstract: While several statistical methods are available to analyse model sensitivity, their application to complex process-based models is often impractical due to the large number of simulation runs required. A Bayesian approach to global sensitivity analysis can greatly reduce the number of simulation runs required by building an emulator of the model which is less computationally demanding. A Gaussian Emulation Machine (GEM) was used to efficiently assess the sensitivity of key agronomic outputs from the APSIM-Sugar crop model to influential input parameters. The sensitivity of simulated biomass and sucrose at harvest was assessed on 14 parameters representing varietal differences and growth response to water stress. Analysis was performed under irrigated and water stressed conditions. Simulated biomass and sucrose were found to be insensitive to 4 of the parameters tested under both irrigated and stressed conditions. Both outputs were most sensitive to radiation use efficiency under irrigated conditions and transpiration efficiency under stressed conditions. Output sensitivity was often non-linear and for a given parameter, could vary between well irrigated and water stressed conditions. Understanding how these parameters affect simulation outputs and which parameters are most influential can help improve simulations of interactions between sugarcane varieties and growing environments. This in turn can help better guide management decisions in the future. The Bayesian approach to sensitivity analysis proved an efficient alternative requiring far fewer model simulations than other approaches to sensitivity analysis and effectively provided insight into influential and negligible model parameters.
Keywords: Gaussian Process, APSIM, Sugarcane, BACCO
1. INTRODUCTION
Sugarcane crop models have been used as support tools for various management decisions. Lisson
et al. 2005 reviews the use of sugarcane crop models to optimize irrigation and harvest scheduling and perform yield forecasts. More recently crop models have been used to project climate change impacts on productivity and nutrient management (Biggs et al., 2013; Everingham et al., 2014). Research has also expanded into modelling variety specific traits that could improve yield under water stressed conditions (Inman-Bamber et al., 2012). This has the potential to guide the development of new cane varieties as well as improve irrigation management. Despite the potential advantages in variety simulations current sugarcane models such as the Agricultural Productions System Simulator (APSIM) (Keating et al., 1999) can struggle to simulate observed differences in biomass yields between varieties(Sexton et al., 2014).
Global sensitivity analysis considers substantial changes in input parameters. The variance induced in the output by changes in an input is averaged over the variance induced by all input parameters (Saltelli et al. 1999). Comparatively, local sensitivity analysis is based on partial derivatives at a central point, holding all other parameters constant. This represents slight changes to the input parameter values and may not reflect the true uncertainty in model parameters (Oakley and O’Hagan, 2004).
A range of methods exists for analysing crop model output sensitivity to model input parameters. These methods generally use a Monte Carlo approach, selecting a large number of random samples drawn from a prior distribution. The Sobol scheme (Sobol, 1993) is an example of a Monte Carlo approach to global sensitivity analysis. The computational efficiency of such methods has been improved in such schemes as the extended-FAST method (Saltelli et al., 1999) but can still require thousands of simulations. This is generally impractical for computationally expensive models such as process–based crop models. A Bayesian approach to global sensitivity analysis using a Gaussian Process based emulator can be an efficient alternative (Oakley and O'Hagan, 2004; O’Hagan, 2006). Zhao et al. (2014) performed global sensitivity analysis on 10 parameters in the APSIM Wheat model for several study sites. Using the extended-FAST methodology this analysis required 10000 simulations per study site/treatment combination. Parry et al. (2013) performed a global sensitivity analysis on 11 parameters in an agent-based model for skylark populations. Using the Gaussian Process approach of Oakley and O’Hagan (2004) the analysis was conducted using only 200 simulation runs.
This paper uses the Bayesian approach to sensitivity analysis described by Oakley and O’Hagan (2004) as implement in the freely available software GEM-SA (Kennedy, 2005). Biomass and sugar yields at harvest are assessed for sensitivity to 14 parameters in the APSIM-Sugar model. Knowledge of influential parameters will lead to a better understanding of the model and may lead to improved simulation of sugarcane under a range of environments.
2. THE GAUSSIAN PROCESS EMULATOR
The Bayesian approach to global sensitivity analysis described by Oakley and O’Hagan (2004) is part of a range of Bayesian tools for model analysis referred to as Bayesian Analysis of Computer Code Output (O’Hagan, 2006). Here we outline the general approach to developing the emulator and performing sensitivity analysis as implemented in the GEM-SA software package. Further details of the underlying mathematics can be found in Kennedy and O’Hagan (2001) and documentation in the GEM-SA software package (Kennedy, 2005). Crop model outputs can be considered a function of model inputs (1). In the Bayesian sense the crop model f(x) is assumed unknown and is thus considered a random function. A Gaussian distribution of functions is then used to represent our prior beliefs of f(x) (2).
) (x
y= f (1)
Where:
x=(x1,x2,...,xp) and x1 is the first parameter of interest
))} ' ( ), ( cov( ), ( { ~ ] , , | ) (
[f x β
σ
2 r N m x f x f x(2)
Where:
p
x x
x p
m( )=
β
0 +β
1 1++β
(3)
)} ' ( exp{ ) ' , ( )) ' ( ), ( cov( 1 2 2 i i p i i r c f
f x x = x x = −
∏
x −x=
σ
σ
(4)
value σ2 represents the overall variance about the mean function while ri are unknown roughness
parameters. Within the GEM-SA software package the unknown hyper-parameters β and σ2 are
given a constant joint prior probability p(β,
σ
2)∝σ
−2 and the prior values for r are set toexp(0.01).
Using a smooth correlation in the covariance is an advantage of this methodology. This implies that if )
(x
f is known and f(x) is close to f x( ') we have some information about f x( '). This provides extra information compared to Monte Carlo methods and can significantly reduce the number of simulations required. In comparison to the random draw from the prior parameter sample space used in Monte Carlo methods, model outputs (y
)
are observed at design points selected to cover the parameter sample space. Design points are selected by maximizing the minimum distance between points and/or minimizing the correlation between points. The GEM-SA software package can build a Maximin Latin Hypercube or LP-TAU design (Kennedy, 2005). It can then be shown that the emulator, conditional on r andy, has a posterior students t distribution (5) with given posterior mean function) (x
∗
m and posterior covariance
σ
ˆ2c∗(x,x).
)) , ( ˆ ), ( ( ~
] , | ) (
[f x r y tn−(p+1) m∗ x
σ
2c∗ x x (5)From the posterior distribution variance based sensitivity indices can be calculated. Of particular interest are the first order sensitivity index (%Var) and the total sensitivity index (Total Effect) (Oakley and O’Hagan, 2004; Kennedy, 2005). The first order sensitivity index for xi represents the expected reduction in output variance if xi were known, i.e. the main effect index ofxi. The total sensitivity index represents the unexplained variance that would remain if all x−i were known and is a way of assessing the main effect ofxi and all higher order interactions to which xi may contribute. Uncertainty in the emulator main effects can also be calculated from the posterior distribution either analytically or through random draws from the posterior distribution.
3. The APSIM sugarcane growth model and key parameters
APSIM–Sugar simulates important agronomic measures of crop productivity such as Tonnes of Sugar per Hectare, Tonnes of Cane per hectare and Commercial Cane Sugar on a daily time step. These measures are derived from simulated crop biomass which is divided into leaf, cabbage, structural stem, roots and sucrose (Keating et al., 1999). The accumulation of biomass is driven largely by radiation use efficiency (RUE); a measure of photosynthetic ability. RUE in turn can be limited by various environmental stresses such as temperature, water deficit or excess and nitrogen deficit.
There are five main categories of parameters in the APSIM-Sugar model that control how the crop grows given environmental and management conditions. These include constants, plant crop, ratoon
crop, and variety parameters for plant and ratoon crops
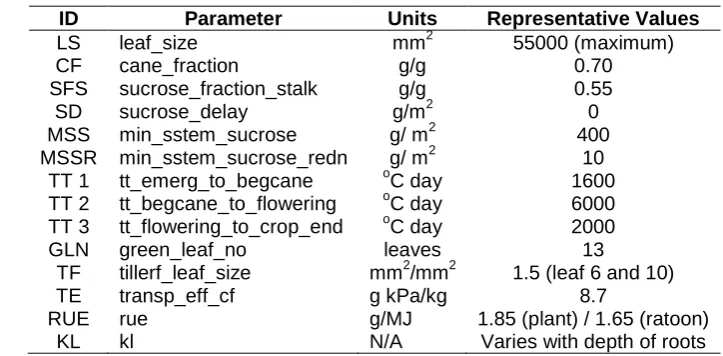
(http://www.apsim.info/Documentation/Model,CropandSoil/CropModuleDocumentation/Sugar.aspx). Constants largely describe the growing environment including climate and soil parameters. Plant and ratoon parameters control growth and partitioning, water use and temperature and water stress factors. Eleven parameters are used to directly define a variety (Table 1). These parameters control leaf development (leaf_size, leaf_size_no, tillerf_leaf_size, tillerf_leaf_size_no, green_leaf_no), partioning of assimilates (cane_fraction, sucrose_fraction_stalk, sucrose_delay, min_sstem_sucrose,
min_sstem_sucrose_redn) and phenological development based on thermal time
(tt_emerg_to_begcane, tt_begcane_to_flowering, tt_flowering_to_crop_end).
Table 1. Key APSIM parameters for use in sensitivity analysis
ID Parameter Units Representative Values
LS leaf_size mm2 55000 (maximum)
CF cane_fraction g/g 0.70
SFS sucrose_fraction_stalk g/g 0.55
SD sucrose_delay g/m2 0
MSS min_sstem_sucrose g/ m2 400
MSSR min_sstem_sucrose_redn g/ m2 10
TT 1 tt_emerg_to_begcane oC day 1600
TT 2 tt_begcane_to_flowering oC day 6000
TT 3 tt_flowering_to_crop_end oC day 2000
GLN green_leaf_no leaves 13
TF tillerf_leaf_size mm2/mm2 1.5 (leaf 6 and 10)
TE transp_eff_cf g kPa/kg 8.7
RUE rue g/MJ 1.85 (plant) / 1.65 (ratoon)
KL kl N/A Varies with depth of roots
4. METHODOLOGY
4.1 Model initialization and parameter prior distributions
APSIM environment and management settings were calibrated to simulate a breeding program at Home Hill in Queensland, Australia (Basnayake et al. 2012; Sexton et al., 2014). Uniform prior distributions for 14 parameters were generated for the sensitivity analysis (Table 2). Maximum and minimum values for LS were selected to represent maximum leaf area values for a range of commercial varieties (Inman-Bamber, 2013). For simplicity LS was modified relative to LS for variety Q117 based on maximum leaf area. The range for parameter GLN was adapted from GLN recorded as part of the breeding field trial conducted at Home Hill and Dalbeg, Queensland, Australia (Basnayake et al., 2012). Ranges for the remaining variety parameters (CF, SFS, SD, MSS, MSSR, TT 1, TT 2, TT 3, TF) represent the range of parameter values reported for sugarcane varieties in APSIM. The range for TE was selected to match that used in Sexton et al. (2014). Parameters KL and RUE were modified as a percentage of default values (pers. com. Geoff Inman-Bamber).
4.2 Sensitivity analysis
The GEM-SA software package (Kennedy, 2005) was used to perform global sensitivity analysis on simulated biomass (kg/Ha) and sucrose (kg/Ha) at harvest for a first ratoon crop under irrigated and water stress conditions (a total of 4 simulation outputs assessed). The Maximin Latin Hypercube approach was used to create a design of 400 points that efficiently covered the 14 dimensional parameter space. The maximum value of 400 points was used to provide the most rigorous analysis possible. A Gaussian Process emulator was developed for each of the 4 simulation outputs separately.
Twenty percent of the design was left out for validation to assess uncertainty in the emulator results. To further quantify uncertainty a 95% confidence interval on all main effects was produced from 1000 random draws from the emulator posterior distribution. Plots of the emulator mean of the main effects from 1000 random draws were used to visualise the response of outputs to each of the 14 variables. Finally first order sensitivity indices and total
sensitivity indices were recorded for each variable for all simulation outputs. A high %Var indicated an influential parameter.
Table 2. Uniform distribution used in sensitivity analysis
ID Minimum Maximum
LS 20000 70000
CF 0.65 0.80
SFS 0.4 0.7
SD 0 600
MSS 400 1500
MSSR 9 11
TT 1 1200 1900
TT 2 5400 6600
TT 3 1800 2200
GLN 9 15
TF 1 6
TE 6.0 14.0
RUE 74(%) 108(%)
[image:4.595.357.512.525.705.2]5. RESULTS
5.1 Sensitivity analysis
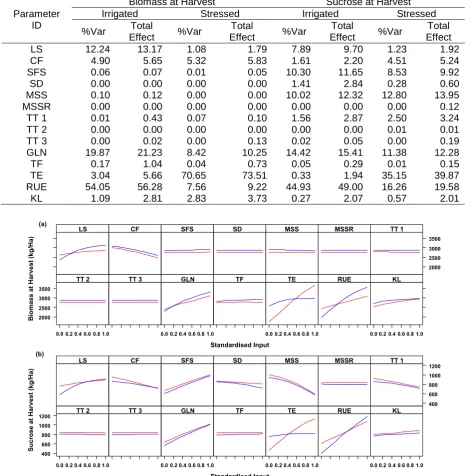
[image:5.595.64.531.248.725.2]The mean main effects of 1000 draws from the posterior emulator are plotted in Figure 1. Percent variance and Total effect indices are recorded in Table 3. Most notably TT 2 and TT 3, MSSR and TF had %Var indices less than 1 for all outputs. Similarly Biomass yields were insensitive to parameters related to sucrose (SFS, SD, MSS). Green Leaf Number was the most influential of the standard APSIM variety parameters. Simulated biomass and sucrose yields were most sensitive to changes in RUE under irrigated conditions and TE under stressed conditions. Plots of main effects suggested model output sensitivity can be non-linear and change dramatically under irrigated or water stressed conditions.
Table 3. Variance based sensitivity measures
Parameter ID
Biomass at Harvest Sucrose at Harvest
Irrigated Stressed Irrigated Stressed
%Var Total
Effect %Var
Total
Effect %Var
Total
Effect %Var
Total Effect
LS 12.24 13.17 1.08 1.79 7.89 9.70 1.23 1.92
CF 4.90 5.65 5.32 5.83 1.61 2.20 4.51 5.24
SFS 0.06 0.07 0.01 0.05 10.30 11.65 8.53 9.92
SD 0.00 0.00 0.00 0.00 1.41 2.84 0.28 0.60
MSS 0.10 0.12 0.00 0.00 10.02 12.32 12.80 13.95
MSSR 0.00 0.00 0.00 0.00 0.00 0.00 0.00 0.12
TT 1 0.01 0.43 0.07 0.10 1.56 2.87 2.50 3.24
TT 2 0.00 0.00 0.00 0.00 0.00 0.00 0.01 0.01
TT 3 0.00 0.02 0.00 0.13 0.02 0.05 0.00 0.19
GLN 19.87 21.23 8.42 10.25 14.42 15.41 11.38 12.28
TF 0.17 1.04 0.04 0.73 0.05 0.29 0.01 0.15
TE 3.04 5.66 70.65 73.51 0.33 1.94 35.15 39.87
RUE 54.05 56.28 7.56 9.22 44.93 49.00 16.26 19.58
KL 1.09 2.81 2.83 3.73 0.27 2.07 0.57 2.01
5.2 Emulator Accuracy
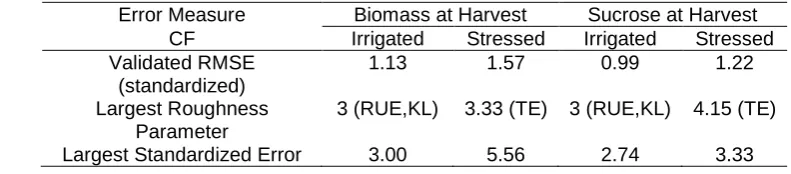
[image:6.595.90.486.277.364.2]Standardized Validation root mean square errors (RMSE), largest roughness parameters and largest standardized errors were recorded (Table 4). Standardized RMSE should be close to 1 with larger values indicating overestimation while lower values represent underestimation. A rough function requires a more data points to emulate accurately reducing efficiency (O’Hagan, 2006). Standardized errors should be close to zero, values larger than 2 indicated poor emulation. Validation root mean squared standardized errors were all close to 1 with the greatest deviation occurring for simulated biomass under water stressed conditions. Roughness parameters were also relatively low. The largest roughness parameters were related to KL and RUE under irrigated conditions and TE under stressed conditions. The largest standardized errors were greater than 2 for all treatment/output combinations. Confidence intervals (95%) based on 1000 random draws from the posterior distribution, suggested that uncertainty within the emulator was relatively small for all parameters and all simulated outputs (data not shown).
Table 4. Emulator performance statistics
Error Measure Biomass at Harvest Sucrose at Harvest
CF Irrigated Stressed Irrigated Stressed
Validated RMSE (standardized)
1.13 1.57 0.99 1.22
Largest Roughness Parameter
3 (RUE,KL) 3.33 (TE) 3 (RUE,KL) 4.15 (TE)
Largest Standardized Error 3.00 5.56 2.74 3.33
6. DISCUSSION
Emulator uncertainties were relatively low however the higher roughness parameters suggest close attention should be paid to TE, RUE and KL parameters. Emulator results for TE replicated the results of Sexton et al. (2014) supporting the emulators ability to accurately represent the model. Emulator accuracy would no doubt be further improved if non-influential parameters were removed from the analysis. This would allow the 400 design points to better cover the reduced parameter space.
The insensitivity of model outputs to TT 2 and TT 3 is not surprising as these parameters are not currently implemented by APSIM (Keating et al. 1999). These parameters were only included in this analysis as they are still listed as cultivar parameters in the APSIM model yet no published work has looked at their role in simulations since Keating et al, (1999). It is an important result then that these parameters are in fact not influencing simulation output. The insensitivity of simulated biomass to sucrose parameters is also to be expected. The lack of influence of TF and MSSR are of greater import. Tillering is considered a desirable trait which can improve biomass yields and the low sensitivity of simulated biomass to TF is counterintuitive. It is important that future research investigates how TF is used by sugarcane modellers. For purposes of model calibration TF and MSSR may be ignored, reducing the risk of over parameterisation when availability of observed data is low.
The influence of LS on model outputs was distinctly non-linear under irrigated conditions (Figure 1). The plateau at higher values suggests that beyond a certain point increase in LS will not increase yields. This is an important result in understanding how the model can be used for different sugarcane industries. For example, modelling differences in leaf area will have a greater impact for industries such as Australia that use varieties with smaller leaf areas, compared to industries such as Brazil where sugarcane varieties generally have larger leaf areas. For simulated biomass there was a marked difference in the influence of RUE between irrigated and stressed conditions. This may mean that use of RUE in variety parameterisations could affect simulations of variety by environment interaction. While RUE was more influential under irrigated conditions, KL was slightly more influential under stressed conditions. Although these two parameters do not vary in APSIM by default, calibration of each may lead to a better simulation of environmental response.
current varieties and physiological knowledge. Unfortunately collecting the data on variety traits can be expensive and time consuming. Knowledge of influential model parameters can be used to evaluate the trade-off between the expense of measuring a particular trait to inform a crop model and the potential contribution the knowledge will make towards improving the simulation. The results from this study should be considered along with the expense of measuring relevant traits and the genetic heritability of traits when data is collected to inform crop models.
The use of a Gaussian Process to emulate the APSIM–Sugar model was an efficient and effective alternative for global sensitivity analysis. For this analysis 800 simulations in APSIM were required (400 parameter sets * 2 treatments). By comparison the extended-FAST method as implemented by Zhou et al. (2014), would have required as many as 28000 simulations in APSIM (1000 parameter sets * 14 parameters * 2 treatments). In future emulator accuracy could be improved by removing parameters found to have negligible influence on key agronomic parameters. Improvements could also be made if more realistic information of the prior parameter distributions were identified and incorporated into the analysis. Currently the GEM-SA software allows for only uniform or normal prior distributions. Incorporating different prior distributions when know may affect the results. Furthermore when uniform distributions are used, the range used will affect the results. For example, a change in LS was more influential at lower values (Figure 1). Reducing the prior distribution of LS to lower values could potentially increase the relative influence of LS. This methodology could be extended to include other likely influential parameters at a wider range of environments and crop classes to assess potential interactions. Future research should also consider the first order interactions between influential parameters.
7. CONCLUSION
The use of a Gaussian Process to emulate the APSIM–Sugar model was an efficient and effective alternative for global sensitivity analysis. While there was room for improvement in the choice of parameters and possibly the parameter prior distributions, the emulator was able to reproduce sensitivity results for TE previously produced using only the APSIM simulator and was able to give some insight into likely influential and negligible variety parameters. Identifying influential parameter values is the first step to improving variety specific simulations. The results of this analysis could be used to guide the calibration of the APSIM model so that new varieties are properly represented in model simulations. Such variety calibration could greatly impact APSIMs ability as a decision support tool in the future.
8. ACKNOWLEDGMENTS
The Authors would like to acknowledge the More Crop Per Drop project team for supplying the breeding field trial data. Specifically, Prakash Lakshmanan, Jaya Basnayake, Philip Jackson and Geoff Inman-Bamber. This project was funded by Sugar Research Australia (SRA).
9. REFERENCES
Basnayake, J., Jackson P.A., Inman-Bamber, NG, Lakshmanan P., 2012. Sugarcane for water-limited environments: Genetic variation in cane yield and sugar content in response to water stress.J.Exp. Bot. 63, 6023-6033.
Biggs, J.S., Thorburn, P.J., Crimp, S., Masters, B., Attard, S.J., 2013. Interactions between climate change and sugarcane management systems for improving water quality leaving farms in the Mackay Whitsunday region, Australia.Agric. Ecosyst. Environ. 180, 79-89.
Everingham, Y., Inman-Bamber, N.G., Sexton, J., Stokes, C., 2014. A dual ensemble agroclimate modelling procedure to assess climate change impacts on sugarcane production in Australia. Agric. For. Meteorol. under review.
Inman-Bamber, G., 2013. Sugarcane yields and yield-limiting processes. In: Moore, P.H., Botha, F.C. (Eds.), Sugarcane Physiology Biochemistry and Functional Biology pp. 579-600.
Inman-Bamber, N.G., Lakshmanan, P., Park, S., 2012. Sugarcane for water-limited environments: Theoretical assessment of suitable traits.Field Crop. Res. 134, 95-104.
Keating, B.A., Robertson, M.J., Muchow, R.C., Huth, N.I., 1999. Modelling sugarcane production systems I. Development and performance of the sugarcane module.Field Crop. Res. 61, 253-271.
Kennedy, M.C., 2005 GEM-SA Version 1.1. Computer Software. available at:
http://www.tonyohagan.co.uk/academic/GEM/index.html, accessed (11.12.2013).
Kennedy, M.C., Anderson, C.W., Conti, S., O’Hagan, A., 2006. Case studies in gaussian process modelling of computer codes. Reliab. Eng. Syst. Safe. 91, 1301-1309.
Kennedy, M.C., O'Hagan, A., 2001. Bayesian calibration of computer models. J. R.l Stat. Soc. Series B Stat Methodol. 63, 425-464.
Lisson, S.N., Inman-Bamber, N.G., Robertson, M.J., Keating, B.A., 2005. The historical and future contribution of crop physiology and modelling research to sugarcane production systems. Field Crop. Res. 92, 321-335.
O’Hagan, A., 2006. Bayesian analysis of computer code outputs: A tutorial. Reliab. Eng. Syst. Safe. 91, 1290-1300.
Oakley, J.E., O'Hagan, A., 2004. Probabilistic sensitivity analysis of complex models: a Bayesian approach. J. R. Stat. Soc. Series B Stat. Methodol. 66, 751-769.
Parry, H.R., Topping, C.J., Kennedy, M.C., Boatman, N.D., Murray, A.W.A., 2013. A Bayesian sensitivity analysis applied to an agent-based model of bird population response to landscape change. Environ. Modell. Softw. 45, 104-115.
Rosenzweig, C., Jones, J.W., Hatfield, J.L., Ruane, A.C., Boote, K.J., Thorburn, P., Antle, J.M., Nelson, G.C., Porter, C., Janssen, S., Asseng, S., Basso, B., Ewert, F., Wallach, D., Baigorria, G., Winter, J.M., 2013. The Agricultural Model Intercomparison and Improvement Project (AgMIP): Protocols and pilot studies.Agric. For. Meteorol. 170, 166-182.
Saltelli, A., Tarantola, S., Chan, K.P.S., 1999. A quantitative model-independent method for global sensitivity analysis of model output.Technometrics 41, 39-56.
Sexton, J., Inman-Bamber, G., Everingham, Y., Basnayake, J., Lakshmanan, P., Jackson, P.A., 2014. Detailed trait charaterisation is needed for simulation of cultivar response to water stress.
Proceedings of the Australian Society of Sugar Cane Technologists 36, (USB).
Sobol, I.M., 1993. Sensitivity analysis for non-linear mathematical model. Mathem. Modelling Comput. Exp. 1, 407-414.