R E S E A R C H
Open Access
Effect of concentrate supplementation on
nutrient digestibility and growth of
Brahman crossbred cattle fed a basal diet
of grass and rice straw
Do Van Quang
1, Nguyen Xuan Ba
2, Peter T. Doyle
3, Dau Van Hai
1, Peter A. Lane
4, Aduli EO Malau-Aduli
4,
Nguyen Huu Van
2and David Parsons
4*Abstract
Background:An experiment was conducted in Vietnam to test the hypothesis that total dry matter (DM) intake and liveweight (LW) gain would increase in a curvilinear manner with increasing amounts of concentrate offered.
Method:There were five treatments: a basal diet of Guinea grass fed at 1 % of LW and rice straw fedad libitum (T0), or this diet supplemented with concentrate at 0.6 (T1), 1.2 (T2), 1.8 (T3), or 2.4 % of LW (T4). The concentrate comprised locally available ingredients, namely cassava chips, rice bran, crushed rice grain, fishmeal, salt, and urea, mixed manually.
Results:Concentrate intake increased from T0 to T3, but there was no difference in concentrate intake between T3 and T4. Total feed intake increased in a curvilinear manner from 4.0 to 6.4 kg DM/d as the quantity of concentrate consumed increased. The substitution of concentrate for grass and rice straw increased with increasing consumption of concentrate and was as high as 0.49 kg DM reduction per kg of concentrate consumed. LW gain increased curvilinearly, with significant differences between T0 (0.092 kg/d), T1 (0.58 kg/d) and T2 (0.79 kg/d); but there were no significant differences in LW gain between T2, T3 (0.83 kg/d) and T4 (0.94 kg/d).With increasing amount of concentrate in the diet, the digestibilities of dry matter, organic matter, crude protein, and crude fat increased, but NDF digestibility decreased.
Conclusion:Based on these results, young Vietnamese Brahman-cross growing cattle will respond to a locally-sourced concentrate mix offered at a level of up to 1.2 % of LW.
Keywords:Bos indicus, Concentrate, Crossbred, Digestibility, Rice Straw, Vietnam, Yellow cattle
Background
Beef cattle production in Central Vietnam is concen-trated in low-input and small-scale enterprises. Farmers generally have limited knowledge in terms of breed im-provement, and feed and feeding management; hence, livestock production and enterprise productivity remain low. Little published information is available for the re-gion; however there are some indicators of low per-formance. For example, a survey of cattle performance
in Binh Dinh and Phu Yen provinces found that the average calving interval is longer than one year (476 days for Binh Dinh and 397 days for Phu Yen) [1]. For growing animals, basal diets of grass and straw can result in liveweight gains of 0.1 to 0.2 kg/day [2, 3]. Opportunities exist to improve feed efficiency and growth rate in cattle in Central Vietnam through effect-ive supplement utilisation to enhance the intake of di-gestible energy and protein.
Many cattle in the region graze native grasses during the day and are often provided with crop products and by-products at night [4]. In general, native grass and rice straw can only meet the maintenance requirements of * Correspondence:dparsons@utas.edu.au
4
Tasmanian Institute of Agriculture and School of Land and Food, University of Tasmania, Sandy Bay 7001, Australia
Full list of author information is available at the end of the article
cattle, as they are low in metabolisable energy and pro-tein [5, 6]. Ba et al. [7] showed that a range of intro-duced grasses can be productive in this environment, and a small but growing proportion of farmers confine cattle and feed basal diets of cut-and-carry native or sown grasses with by-products, such as rice straw, sugar cane tops, groundnut tops, and sweet potato leaves. While these crop by-products are useful sources of di-gestible and metabolisable energy for maintenance of cattle, they are often deficient in meeting the energy and protein requirements for growth in young beef cattle. Thus, some farmers provide locally available products (such as rice grain, rice bran, cassava leaves, and maize) that are not only highly digestible, but may also contain reasonable protein concentrations.
Supplementing Vietnamese cattle with energy-rich feeds and a source of protein can increase growth rates and reduce the time taken to attain market weight in finishing [2, 3]. However, the responses in liveweight (LW) gain to increasing amounts of supplementation vary depending on the composition of the concentrate and the interactions between the basal diet and supple-ment [8]. There are numerous reports in the published literature of substantial increases in liveweight gain (LWG) in cattle consuming low quality forages supple-mented with energy and protein-rich feeds [9].
Diets and supplementary feed mixes for cattle in smallholder systems should be based on locally available forages, crop residues, and feed ingredients from agricul-tural by-products, because commercial complete mixed rations and feed supplements are in limited supply and are usually costly. A key challenge in Central Vietnam is to design diets and supplements that provide adequate metabolisable energy and protein for acceptable growth rates of young cattle. The objective of this research was to determine the effect of the amount of supplement (formulated from locally-available ingredients) on intake, nutrient digestibility, and growth of young cattle. We hypothesised that total DM intake and LWG would in-crease in a curvilinear manner with increasing amounts of concentrate offered.
Methods
Animals and experimental design
Twenty male cross-bred Brahman bulls of 11–12 months of age and weighing between 190–200 kg were fed at the Institute of Animal Sciences research station (Ben Cat District, Binh Duong Province) in Southern Vietnam. All experimental procedures were in accordance with the University of Tasmania Animal Ethics Committee guide-lines, the 1993 Tasmania Animal Welfare Act and the 2004 Australian Code of Practice for the Care and Use of Animals for Scientific Purposes. Cattle were blocked on the basis of LW and allocated into 4 treatment groups of
5 animals per treatment. All animals were treated for in-ternal and exin-ternal parasites and vaccinated against foot and mouth disease, pasteurellosis, and rinderpest prior to the experiment. Cattle were kept in individual feeding stalls throughout adaptation and feeding periods. They were observed daily for any signs of discomfort caused by the housing, and daily feed intake was monitored and recorded.
The experimental design was a randomized complete block design with a control and four amounts of sup-plement: Control (T0) - basal diet of Guinea grass (fed at 1.0 % LW) and rice straw fed ad libitum; T1- the basal diet + concentrate fed at 0.6 % LW; T2: the basal diet + concentrate fed at 1.2 % LW; T3 - the basal diet + concentrate fed at 1.8 % LW; T4 - the basal diet + concentrate fed at 2.4 % LW.
The experiment had a duration of 98 days, comprising: an adaptation period of 14 days (26 Sep 2010 to 10 Oct 2010), a treatment period of 84 days (11 Oct 2010 to 11 Jan 2011), and a digestibility period of 7 days (the final 7 days of the treatment period).
Feeds and their nutritive characteristics
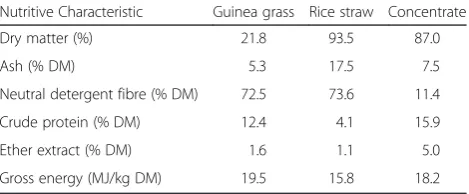
Rice straw was purchased in one lot to minimise vari-ation in characteristics throughout. It was dried, prop-erly stored in a dry and well ventilated barn, chopped into 5-10-cm lengths and mixed well before feeding. Guinea grass was harvested at 30–40 days of re-growth, chopped into 5-10-cm lengths, and mixed well before feeding. Concentrate ingredients included cassava chips (34 % DM basis), rice bran (30 %), crushed rice grain (30 %), fishmeal (3 %), salt (1 %), and urea (2 %), which were manually mixed. The nutritive characteristics of the ration ingredients are shown in Table 1.
Feeding regime
[image:2.595.305.540.636.733.2]The basal diet of Guinea grass was fed at 1.0 % LW in roughly two equal portions at 0800 and 1300 hours, with any residuals collected and weighed at 1800 hours. Rice straw was fed ad libitum once daily at 1830 hours, at 20 % above the previous day’s intake. The amount of-fered to each animal was adjusted once a week based on
Table 1Nutritive characteristics of the Guinea grass, rice, straw, and concentrate used in the experiment
Nutritive Characteristic Guinea grass Rice straw Concentrate
Dry matter (%) 21.8 93.5 87.0
Ash (% DM) 5.3 17.5 7.5
Neutral detergent fibre (% DM) 72.5 73.6 11.4
Crude protein (% DM) 12.4 4.1 15.9
Ether extract (% DM) 1.6 1.1 5.0
LW. Straw residues were collected at 0700 hrs prior to feeding grass each morning.
Mixed concentrate was offered to cattle twice daily in separate feeding troughs from the Guinea grass and rice straw. Concentrate was fed prior to offering the grass just before 0800 and at 1300 hours. Where the animals did not consume all of the concentrate within a short period after it was offered, they were allowed free access throughout the day. Residues were collected daily at 0700 hrs and weighed.
At the beginning of the adaptation period, all supple-mented animals were fed a maximum of 0.5 kg of the mixed concentrate per day. The amount of concentrate was gradually increased by approximately 0.5 kg every second day up to the amount for the treatment. Each animal had free access to a 5-kg mineral block and water.
Measurements
Cattle were weighed at 0630 hrs on two consecutive days at the start and end of the adaptation phase and weekly throughout the experimental period, to calculate daily LW change. The amounts of each feed offered and re-fused were weighed and sub-samples collected for dry matter determination daily. Additional sub-samples of each feed offered were collected daily, bulked within each 7 day period, and stored for analysis.
Digestibility trial
During the last consecutive 7 days of the experimental period, total faecal output was manually collected for each animal. The output was thoroughly mixed each day and subsamples taken for DM determination (dried to a constant weight at 105 °C) and for laboratory analyses (about 5 % of the total). The subsamples for analyses were stored at −20 °C and bulked over the 7 days, after which they were defrosted, mixed, and further samples taken for nutrient composition analyses.
Laboratory analysis
Dry matter of feeds, residues from individual animals, and faecal samples were determined by drying at 105 °C to a constant weight. Samples for chemical analysis were dried at 60 °C. Ash content was determined by heating samples in a furnace at 550 °C for 4 hours and organic matter (OM) content calculated as DM minus ash [10]. Neutral detergent fibre (NDF) was determined as de-scribed by Van Soest et al. [11]. Ether extract (EE) was determined using the standard Soxhlet fat extraction method [10]. Total nitrogen (N) was measured by the Kjeldahl procedure and crude protein (CP) calculated as N x 6.25. Gross energy (GE) of feed, residues and faeces was determined by bomb calorimetry (Bomb Calorimeter 6300, Parr Instrument Company).
Calculations and statistical analyses
Liveweight gain was calculated from the difference be-tween final and initial weights. Apparent digestibility of DM and OM, and digestibility of NDF were calculated as intake (kg DM/day) minus faecal output (kg DM/day) divided by intake (kg DM/day) expressed as a percent-age. Substitution rate was calculated as the difference between control roughage (grass and rice strass) intake and treatment roughage intake, divided by concentrate intake.
Intake, LWG, and digestibility response variables were analysed in SAS (SAS Institute: The SAS system for Windows. v. 9.1. Cary, NC; 2003) [12] using PROC GLM with concentrate as a fixed effect, and a random block. Fisher’s protected LSD was used to test differ-ences (P< 0.05) among means where the overall F test was significant. Regression equations were developed using the PROC GLM procedure, based on initial body weight and amount of concentrate offered and their quadratic terms as explanatory variables. Variables were dropped from the regression model if non-significant (P< 0.05) in the presence of other explanatory variables, and the regression re-calculated until only significant variables remained. The coefficient of determination (r2) and the overall F-test significance of the regression were determined. The regression equation is not pre-sented where the overall F-test was not significant.
Results
Summary statistics (mean, standard deviation, and range) for the key outputs are shown in Table 2. Table 3 contains regression results and Table 4 contains analysis of variance results.
The effect of concentrate on intake
There was a significant (p< 0.0001) non-linear effect of treatments on concentrate intake (Table 3), with intake increasing from T0 to T3, but no difference in concen-trate intake between T3 and T4 (Table 4). Guinea grass intake declined linearly with increasing concentrate of-fered (Table 3) and concentrate consumed (Fig. 1). Rice straw intake declined curvilinearly with increasing con-centrate offered (Table 3) and concon-centrate consumed (Fig. 1).
Total dry matter intake increased curvilinearly from 4.0 to 6.4 kg/d as the amount of concentrate consumed increased (Fig. 1). The substitution rate of concentrate for Guinea grass and rice straw increased linearly with amount of supplement consumed (Table 3), and was as high as 0.49 kg DM/kg DM (Table 4).
Table 2Summary statistics of feed intake, liveweight, average daily gain and organic matter digestibility by treatment group
Treatment
0 0.6 1.2 1.8 2.4
Mean ± SD Range Mean ± SD Range Mean ± SD Range Mean ± SD Range Mean ± SD Range
Feed Intake (kg DM/d)
4.06 ± 0.70 3.23 - 4.92 5.36 ± 0.71 4.74 - 6.38 6.24 ± 1.3 4.87 - 7.45 6.49 ± 0.89 5.24 - 7.32 6.54 ± 1.8 4.42 - 8.14
Initial liveweight (kg)
179 ± 38 133 - 225 181 ± 42 130 - 233 184 ± 35 149 - 221 179 ± 35 135 - 221 183 ± 54 117 - 235
Final liveweight (kg)
207 ± 34 167 - 249 255 ± 36 228 - 307 267 ± 50 222 - 327 265 ± 43 219 - 323 279 ± 76 191 - 347
Liveweight gain (kg/d)
0.091 ± 0.081
0.018 -0.202
0.585 ± 0.095
0.470 -0.702
0.792 ± 0.125
0.679 -0.917
0.836 ± 0.095
0.714– 0.940
0.943 ± 0.169
0.750 -1.107
OM Digestibility (%) 54.3 ± 4.1 51.0 - 60.0 60.6 ± 2.1 57.7 - 62.7 62.8 ± 3.8 57.6 - 66.1 66.9 ± 2.3 64.5 - 70.0 75.1 ± 2.4 72.8 - 78.3
Table 3Regression equations to estimate intake, digestibility, faecal N, and liveweight
Regression equation1,2 r2 Sig. of regression
Intake
Concentrate intake (kg DM/d) Y =−2.39 + 0.0117(I) + 2.68(C) - 0.348(C2) 0.97 <0.0001
Guinea grass intake (kg DM/d) Y = 0.701 + 0.00782(I) - 0.321(C) 0.69 0.0002
Rice straw intake (kg DM/d) Y = 0.747 + 0.00539(I) - 0.00808(C) - 0.209(C2) 0.93 <0.0001
Substitution rate (kg DM/kg DM) Y = 1.16 - 0.00589(I) + 0.215(C) 0.85 <0.0001
3OM intake (kg/day) Y =−0.996 + 0.0227(I) + 2.30(C) - 0.535(C2) 0.95 <0.0001 4GE intake (MJ/d) Y =−18.9 + 0.438(I) + 43.8(C) - 10.1(C2) 0.94 <0.0001 5CP intake (kg/d) Y =−0.278 + 0.00307(I) + 0.407(C) - 0.0693(C2) 0.97 <0.0001 6EE intake (kg/d) Y =−0.114 + 0.000818(I) + 0.144(C) - 0.0221(C2) 0.97 <0.0001
7NDF intake (kg/d) Y = 1.27 + 0.00886(I) - 0.240(C) 0.48 0.0036
Digestibility period
OM digestibility (%) Y = 54.4 + 8.00(C) 0.84 <0.0001
Digestible OM intake (kg/d) Y =−0.149 + 0.0106(I) 0.971(C) 0.88 <0.0001 Gross energy digestibility (%) Y = 75.0 + 13.6(C) - 4.36(C2) 0.43 0.0086
Digestible energy intake (MJ/d) Y =−7.39 + 0.311(I) + 38.5(C) - 8.75(C2) 0.89 <0.0001
CP digestibility (%) Y = 56.9 + 6.09(C) 0.63 <0.0001
EE digestibility (%) Y = 9.28 + 0.0884(I) + 38.8(C) - 7.62(C2) 0.93 <0.0001
NDF digestibility (%) Y = 59.8 - 8.06(C) 0.63 <0.0001
Faecal N (kg/d) Y =−0.00168 + 0.000129(I) + 0.0203(C) - 0.00589(C2) 0.89 <0.0001
Liveweight
Initial liveweight (kg) n.a. n.a. 0.9905
Final liveweight (kg) Y =−13.7 + 1.12(I) + 64.9(C) - 15.6(C2) 0.97 <0.0001
Liveweight gain (kg/d) Y =−163 + 1.43(I) + 773(C) - 185(C2) 0.90 <0.0001
1
I: Initial body weight (kg)
2
C: Amount of concentrate offered (% of liveweight)
3
OM: Organic matter
4
GE: Gross energy
5
CP: Crude protein
6
EE: Ether extract
7
[image:4.595.61.541.338.675.2]analysis indicates no significant effect of treatments on NDF intake (Table 4); however the regression analysis indicates a linear decline in NDF intake as the amount of concentrate consumed increased (Table 3). These re-sults are reflected in Fig. 2 which shows concentrate consumed plotted against NDF, CP, and OM intake. Over the experimental range, as the level of concentrate intake increased, the OM, and CP intakes increased, however the NDF intake decreased.
[image:5.595.58.540.110.460.2]The effect of concentrate intake on liveweight gain The mean weight gain of bulls ranged from 0.09 kg/d (T0) to 0.94 kg/d (T4) (Table 4). The concentrate treat-ments had a significant (p< 0.0001) effect on LWG (Table 3). There were significant differences in LWG tween T0 to T1 to T2, but no difference in LWG be-tween T2, T3 and T4 (Table 4). These results are Table 4Least squares means, for the effect of different amounts of a concentrate mix on intake, digestibility, faecal N, and
liveweight
Concentrate Treatment (% of liveweight)
0 0.6 1.2 1.8 2.4 SE Pr > F
Intake
Concentrate intake (kg DM/d) 0.00 a 1.27 b 2.66 c 3.78 d 4.29 d 0.22 <0.0001
Guinea grass intake (kg DM/d) 2.19 a 2.17 a 1.94 ab 1.56 b 1.53 b 0.22 0.0198
Rice straw intake (kg DM/d) 1.83 a 1.72 a 1.56 a 1.11 b 0.61 c 0.11 <0.0001
Substitution rate (kg DM/kg DM) n.a. 0.10 a 0.25 ab 0.37 bc 0.49 c 0.10 0.0143
1
OM intake (kg/day) 3.57 a 4.63 b 5.59 c 5.93 c 5.96 c 0.25 <0.0001
2
GE intake (MJ/d) 69.3 a 89.7 b 108.0 c 114.5 c 115.3 c 4.9 <0.0001
3
CP intake (kg/d) 0.343 a 0.540 b 0.732 c 0.850 d 0.910 d 0.037 <0.0001
4
EE intake (kg/d) 0.053 a 0.121 b 0.192 c 0.244 d 0.266 d 0.011 <0.0001
5
NDF intake (kg/d) 2.97 a 3.01 a 2.86 a 2.38 a 2.56 a 0.33 0.2994
Digestibility period
OM digestibility (%) 54.3 a 60.7 b 62.8 bc 66.9 c 75.1 d 2.2 <0.0001
Digestible OM intake (kg/d) 1.89 a 2.58 b 3.27 c 3.69 cd 4.25 d 0.27 <0.0001
Gross energy digestibility (%) 75.3 c 80.0 bc 87.8 a 83.3 ab 83.2 ab 3.1 0.0171
Digestible energy intake (MJ/d) 55.7 a 71.2 b 92.7 c 93.3 c 97.2 c 5.3 <0.0001
CP digestibility (%) 57.04 ab 62.1 ab 62.36 ab 66.6 bc 73.03 c 3.1 0.0019
EE digestibility (%) 25.5 d 51.4 c 59.7 b 71.8 a 76.7 a 3.9 <0.0001
NDF digestibility (%) 59.7 a 57.4 a 48.6 b 41.9 b 43.1 b 4.0 0.0012
Faecal N (kg/d) 0.025 a 0.0321 b 0.0413 c 0.0422 c 0.0386 c 0.0022 <0.0001
Liveweight
Initial liveweight (kg) 199 a 206 a 200 a 195 a 200 a 31.4 0.9983
Final liveweight (kg) 208 a 248 b 266 bc 271 c 279 c 6.2 <0.0001
Liveweight gain (kg/d) 0.092 a 0.577 b 0.792 c 0.843 c 0.943 c 0.074 <0.0001 a-d
In each row, least squares means followed without a common superscript are significantly different (P< 0.05) according to Fisher’s LSD
1
OM: Organic matter
2
GE: Gross energy
3
CP: Crude protein
4
EE: Ether extract
5
NDF: Neutral detergent fibre
[image:5.595.57.292.549.684.2]reflected in Fig. 3, which shows a curvilinear relationship with LWG increasing as concentrate intake increases, but at a declining rate of increase.
The effect of concentrate intake on digestibility
The digestibilities of dry matter, organic matter, crude pro-tein, and crude fat increased with increasing concentrate level offered; however NDF digestibility decreased (Table 3). The faecal nitrogen content significantly (P< 0.0001) increased up until 1.2 % of LW, after which there was no increase with increasing amount of concentrate offered (Table 4).
Discussion
The results support the hypothesis that total dry matter and organic matter intakes would increase in a curvi-linear response as the amount of the formulated con-centrate offered increased up to 2.4 % LW. There was no significant difference in concentrate intake between treatments containing concentrate levels of 1.8 and 2.4 % LW. Roughage intake declined with increasing intake of concentrate. This result is consistent with previously published reports where supplements have been fed to provide energy and/or protein to cattle consuming low quality forages [9, 13, 14]. Intake of rice straw or basal forage diets declines as the amount of concentrate containing cassava powder consumed in-creases [2, 15, 16]. If the amount of fermentable carbo-hydrate in cattle diet is higher than 15 % of total dry matter intake, roughage intake decreases [17].
There are many factors that affect the total dry mat-ter and roughage intakes in ruminants, including diet quality and feeding management. In our study, there was no increase in Guinea grass intake at the lowest level of concentrate supplementation, because all of the offered grass was consumed. The positive effects of small amounts of supplement on intake of low and medium quality forages have been reported elsewhere [14, 18, 19].
However, with increasing concentrate, substitution invari-ably occurs [20] and increases as the amount of concen-trate consumed increases [2].
The decline in NDF digestibility with increasing con-centrate consumption is consistent with reports by Ba et al. [2, 3] and Dung et al. [21]. There is evidence to sug-gest that the disug-gestibility of NDF in mature forages may be depressed more than that of fresh herbages when the rumen environment is altered by feeding concentrates [22, 23]. Dixon and Stockdale [24] suggest that reduced NDF digestion is a primary cause of substitution. Many studies have concluded that increased concentrate intake contributes to a reduction of rumen pH and cellulolytic bacterial activity, which decreases the digestion of fibre [25–27]. It was not feasible to estimate the digestibility of different dietary ingredients in this experiment. How-ever, if the digestibility of concentrate NDF remained constant across T1 to T4, then the digestibility of Guinea grass and/or rice straw NDF must have declined markedly as the amount of concentrate consumed in-creased. This indicates that the amount of metabolisable energy derived from Guinea grass and rice straw de-clined due to substitution and negative associative ef-fects on their NDF digestibility as the amount of concentrate consumed increased.
The present results support the hypothesis that LWG increases curvilinearly with increasing amounts of con-centrate, and that a maximum level of LWG is reached. This relationship is described by the following equation:
LW gain kgð =dayÞ ¼ 163 þ1:43 Ið Þ þ773 Cð Þ−185 C2
R2¼ 0:90;p<0:0001
where I indicates the initial body weight (kg) and C indi-cates the level of concentrate treatment (% of LW). The equation does not indicate the optimum economic level
Fig. 3Effects of amount of concentrate consumed on liveweight gain of cattle fed a basal diet of Guinea grass and rice straw, measured across the whole experimental period. Values are for individual bulls Fig. 2Effects of amount of concentrate consumed on organic
[image:6.595.56.291.89.223.2] [image:6.595.306.539.562.694.2]of supplementation, which needs to also take into ac-count purchased input prices and selling price.
The improved LWG for these experiments is likely due to the increased DM intake, OM intake and OM digest-ibility resulting from increased intake of concentrate. The results are similar to those of previous experiments. A number of studies reported that LWG increased linearly as the concentrate intake increased [2, 21, 28, 29]. We purposefully included high amounts of concentrate sup-plementation to show that the linear relationship would not hold across a wide range in amounts of supplement offered or consumed and that there are diminishing re-sponses at high amounts of supplementation. This has im-portant consequences in terms of the profit derived from supplementary feeding.
Conclusions
This experiment examined the effects of supplementing young Vietnamese Brahman-cross growing cattle with a concentrate mix based on ingredients locally available in Central Vietnam. Liveweight gain increased with increas-ing the level of supplementation up to 1.2 % of LW; how-ever there was minimal change in LW with increasing amounts of supplementation beyond 1.2 %. An equation for estimating LWG based on the amount of supplemen-tation was developed, and could be used for determining the optimal supplementation strategy if combined with information on input costs and cattle sale prices.
Abbreviations
CP:Crude protein; DM: Dry matter; EE: Ether extract; GE: Gross energy; LW: Liveweight; LWG: Liveweight gain; NDF: Neutral detergent fibre; N: Nitrogen; OM: Organic matter.
Competing interests
The authors declare that they have no financial or non-financial competing interests.
Authors’contributions
DVQ, NXB, PD, AM, NHV and DP participated in the design of the study. DVH and DVQ were responsible for the daily running of the experiment. DP performed the statistical analysis and prepared the manuscript. DVQ, NXB, PD, AM and DP helped to draft the manuscript. All authors read and approved the final manuscript.
Acknowledgments
We would like to thank the staff and students who were involved in this study, including Phí NhưLiễu, Nguyên Van Tiến, Do Thi Lan Anh, and Nguyen Thanh Thuy. The study was funded by the Australian Centre for International Agricultural Research (ACIAR).
Author details 1
Institute of Animal Science Southern Vietnam, Ho Chi Minh, Vietnam.
2Faculty of Animal Sciences, Hue University of Agriculture and Forestry, Hue
City, Vietnam.3Peter Doyle Consulting, 4 Red Bean Close, Byron Bay, NSW 2481, Australia.4Tasmanian Institute of Agriculture and School of Land and
Food, University of Tasmania, Sandy Bay 7001, Australia.
Received: 26 November 2014 Accepted: 18 September 2015
References
1. Dung DV, Mui NT, Ba NX, Van NH, Smith RDP, Corfield JP. Reproductive constraints to improved productivity of smallholder cow-calf systems in South Central Coast Vietnam–insights from recent surveys. In: Yuangklang C, editor. The 5th International Conference on Sustainable Animal Agricultural for Developing Countries 26–30 October 2015. Pattaya, Thailand: SAADC Conference; 2015.
2. Ba NX, Van NH, Ngoan LD, Leddin CM, Doyle PT. Effects of Amount of Concentrate Supplement on Forage Intake, Diet Digestibility and Live Weight Gain in Yellow Cattle in Vietnam. Asian Australas J Anim Sci. 2008;21:1736–44.
3. Ba NX, Van NH, Ngoan LD, Leddin CM, Doyle PT. Amount of cassava powder fed as a supplement affects feed intake and live weight gain in laisind cattle in Vietnam. Asian Australas J Anim Sci. 2008;21:1143–50. 4. Parsons D, Lane PA, Ngoan LD, Ba NX, Tuan DT, Van NH, Dung DV, Phung LD:
Systems of cattle production in South Central Coastal Vietnam. Livestock Res Rural Dev 2013, 25. http://www.lrrd.org/lrrd25/2/pars25025.htm
5. Doyle PT, Devendra C, Pearce GR. Rice Straw as a Feed for Ruminants. Canberra: International Development Programme of Australian Universities and Colleges; 1986.
6. Wilson JR, Minson DJ. Prospects for improving the digestibility and intake of tropical grasses. Trop Grassl. 1980;14:253–9.
7. Ba NX, Van NH, Scandrett S, Vy LV, Tung HV, Nghi NT, Tuan DT, Lane PA, Parsons D: Improved forage varieties for smallholder cattle farmers in South Central Coastal Vietnam. Livestock Research for Rural Development 2014, 26. ISSN 0121-3784 (2014)
8. Doyle PT, Stockdale CR, Ba NX, Van NH, Ngoan LD. Understanding interactions between forages and concentrates is important for formulating feeding strategies for growing cattle in central Vietnam. Aust J Exp Agric. 2008;48:821–4. 9. Hennessy DW, Murison RD. Cottonseed meal and molasses as sources of
protein and energy for cattle offered low quality hay from pastures of the north coast of New South Wales. Aust J Exp Agric. 1982;22:140–6.
10. AOAC International. Official Methods of Analysis of AOAC International. 19th ed. Gaithersburg, MD, USA: AOAC International; 2012.
11. Van Soest PJ, Robertson JB, Lewis BA. Methods for dietary fiber, neutral detergent fiber, and nonstarch polysaccharides in relation to animal nutrition. J Dairy Sci. 1991;74:3583–97.
12. SAS Institute. The SAS System for Windows v.9.1. Cary NC: SAS Institute; 2003. 13. Hennessy DW, Kohun PJ, Williamson PJ, Brown DA, Nolan JV. The effect of
nitrogen and protein supplementation on feed-intake, growth and digestive function of steers with different bos-indicus, bos-taurus genotypes when fed a low-quality grass hay. Aust J Agric Res. 1995;46:1121–36.
14. Lee GJ, Hennessy DW, Nolan JV, Leng RA. Responses to nitrogen and maize supplements by young cattle offered a low-quality pasture hay. Aust J Agric Res. 1987;38:195–207.
15. Van NH, Ba NX, Dung DV, Phung LD, Ngoan LD, Cuong VC. Effects of concentrate levels on feed intake, nutrient digestibility, nitrogen balance and rumen characteristics Vietnamese yellow cattle. J Agric Rural Dev Viet Nam. 2012;3:46–53.
16. Wanapat M, Khampa S. Effect of levels of supplementation of concentrate containing high levels of cassava chip on rumen ecology, microbial N supply and digestibility of nutrients in beef cattle. Asian Australas J Anim Sci. 2007;20:75–81.
17. Trach NX. Utilisation of Crop Residue for Ruminants. Hanoi: Agricultural Publishing House; 2004.
18. Cohen RDH. Effect of molasses–urea supplements on digestibility of mature carpet grass (Axonopusaffinis) and liveweight change of beef steers. Aust J Expt Agric Anim Husb. 1974;14:589–92.
19. Ernst AJ, Limpus JF, O’Rourke PK. Effect of supplements of molasses and urea on intake and digestibility of native pasture hay be steers. Aust J Expt Agric Anim Husb. 1975;15:451–5.
20. Doyle PT. Supplements other than forages. In: Hacker JB, Ternouth JH, editors. The Nutrition of Herbivores. Sydney: Academic Press; 1987. p. 429–64. 21. Dung DV, Ba NX, Van NH, Phung LD, Ngoan LD, Cuong VC, et al. Practice on
improving fattening local cattle production in Vietnam by increasing crude protein level in concentrate and concentrate level. Trop Anim Health Prod. 2013;45:1619–26.
22. Huhtanen P. Associative effects of feeds in ruminants. Nor J Agric Sci. 1991;5:37–57.
cellulolysis invivo and dry-matter digestion of various roughages. Anim Feed Sci Technol. 1983;10:15–30.
24. Dixon RM, Stockdale CR. Associative effects between forages and grains: consequences for feed utilisation. Aust J Agric Res. 1999;50:757–73. 25. Agle M, Hristov AN, Zaman S, Schneider C, Ndegwa PM, Vaddella VK. Effect
of dietary concentrate on rumen fermentation, digestibility, and nitrogen losses in dairy cows. J Dairy Sci. 2010;93:4211–22.
26. Moorby JM, Dewhurst RJ, Evans RT, Danelon JL. Effects of dairy cow diet forage proportion on duodenal nutrient supply and urinary purine derivative excretion. J Dairy Sci. 2006;89:3552–62.
27. Plaizier JC, Krause DO, Gozho GN, McBride BW. Subacuteruminal acidosis in dairy cows, the physiological causes, incidence and consequences. Vet J. 2009;176:21–31.
28. Manni K, Rinne M, Huhtanen P. Comparison of concentrate feeding strategies for growing dairy bulls. Livest Sci. 2013;152:21–30.
29. Paeng-Koum P, Tatsapong P. Effect of different levels of protein on feed intake, digestibility and growth rate of Thai native beef fed pangola grass as roughages. In: Oshio S, Otsuka M, Sommart K, editors. Establishment of a Feeding Standard of Beef Cattle and a Feed Database for the Indochinese Peninsula. Tsukuba, Ibaraki, Japan: JIRCAS; 2009. p. 76–8.
Submit your next manuscript to BioMed Central and take full advantage of:
• Convenient online submission
• Thorough peer review
• No space constraints or color figure charges
• Immediate publication on acceptance
• Inclusion in PubMed, CAS, Scopus and Google Scholar
• Research which is freely available for redistribution