Dep
a
rtme
nt of
Agriculture
, Fisheries a
nd Fores
try
Long-term seagrass
monitoring in the Port of Thursday Island
February 2012
Long-term seagrass monitoring in the Port of Thursday Island February 2012 2
The correct citation of this document is:
Davies, JN, McKenna, SA, Rasheed, MA & Taylor HA 2012, ‘Long-term seagrass monitoring in the Port of Thursday Island February 2012’. DAFF Publication (Fisheries Queensland, Northern
Fisheries Centre, Cairns), 37 pp.
© State of Queensland, Department of Agriculture, Fisheries and Forestry, 2012.
The Queensland Government supports and encourages the dissemination and exchange of its information. The copyright in this publication is licensed under a Creative Commons Attribution 3.0 Australia (CC BY) licence.
Under this licence you are free, without having to seek permission from DEWS, to use this publication in accordance with the licence terms.
You must keep intact the copyright notice and attribute the State of Queensland, Department of Agriculture, Fisheries and Forestry as the source of the publication.
For more information on this licence visit http://creativecommons.org/licenses/by/3.0/au/deed.en
Acknowledgements
Long-term seagrass monitoring in the Port of Thursday Island February 2012 3
Contents
Contents 3
Executive Summary 4
Introduction 5
Methods 6
Results 10
Seagrass species, distribution and abundance for monitoring meadows in 2012 10
Comparison with previous monitoring surveys 17
Port of Thursday Island climate data 26
DISCUSSION 29
Seagrass Distribution and Abundance 29
Seagrass resilience and ecosystem consequences of change 30
Implications for management and future monitoring 30
REFERENCES 32
Long-term seagrass monitoring in the Port of Thursday Island February 2012 4
Executive Summary
Seagrass habitats are valuable fisheries resources that show measurable responses to changes in water quality. These attributes make seagrasses an ideal metric to determine the health of estuarine and coastal environments. A network of long-term seagrass monitoring sites has been established at various port locations throughout Queensland by Fisheries Queensland to assess the condition of marine habitats. Outcomes of these programs assist in the planning and development of port operations, helping to achieve minimal environmental impact. Furthermore, these programs assist fisheries management to achieve protection of key fish habitats. This report details the findings from the fifth biennial Port of Thursday Island long-term seagrass monitoring program conducted in February 2012.
The 2002 baseline survey identified some of the best examples of intertidal and subtidal seagrasses in Queensland and provided a good foundation from which the biennial monitoring surveys in the Port of Thursday Island could be based. Nine seagrass meadows representative of the range of seagrass communities present and located in areas potentially influenced by port operations and developments were selected for long-term monitoring from the baseline survey.
The results of the February 2012 monitoring survey found that seagrasses were in a relatively healthy and productive condition. Seagrass above-ground biomass for the majority of monitoring meadows was the highest recorded since peak levels seen in 2004. Increases in meadow biomass from 2010 to 2012 ranged from 15% to 199%, with two thirds of the meadows increasing in biomass by over 100%. The area of the monitoring meadows has generally remained stable throughout the course of the monitoring program with modest increases or decreases in meadow distribution.
Seagrasses in the Port of Thursday Island are influenced by a complex interaction of a number of different climatic factors including rainfall, wind, solar irradiance, temperature, daytime tidal exposure and photosynthetically active radiation (PAR), which are known to affect seagrass growth, recruitment and mortality. It is likely that a combination of these factors has led to the observed changes to seagrass meadows in the Port of Thursday Island rather than any changes in port or anthropogenic activities.
Long-term seagrass monitoring in the Port of Thursday Island February 2012 5
Introduction
Seagrass habitats are important fisheries resources providing both structural and feeding habitat for a number of juvenile commercial and recreational fisheries species. Furthermore, seagrass habitats provide food for endangered and threatened species such as the dugong (Dugong dugon) and the green sea turtle (Chelonia mydas). The wide distribution of seagrass in Queensland and their capacity to show measurable responses to changes in water quality make them ideal candidates for monitoring the health of marine and coastal environments (Orth et al. 2006). In the Torres Strait seagrass habitats are of particular importance. Seagrass associated resources such as dugong, turtle and fisheries species form an important part of their cultural identity as well as supporting subsistence and commercial fisheries.
Some of the best examples of seagrass meadows in Queensland occur in the sheltered waters associated with commercial ports and harbours where seagrasses are at a heightened risk due to activities associated with port operations and development (Lee Long et al. 1996; Rasheed et al. 2007). Results from long-term monitoring programs have provided valuable information on the relationships between climatic shifts, anthropogenic disturbance and seagrass abundance. They have also indicated that healthy and productive seagrass habitats can co-exist with appropriately managed port facilities. Long-term seagrass monitoring programs have enabled port managers to make informed decisions regarding planning and development of port infrastructure, minimising disturbance to the marine environment. These interactive programs between environmental scientists and port managers are examples of international best practice in the environmental management of ports and facilitate the protection of key fisheries habitats facing high levels of anthropogenic threats.
Due to the high reliance on fishing in the Thursday Island area, habitats that support commercial and traditional fisheries, such as seagrasses, are of critical importance to the region. A fine-scale baseline survey of seagrass habitat conducted at the port in March 2002 identified seagrass as the dominant benthic habitat with over 1500ha of seagrass habitat mapped in the survey area (Rasheed et al. 2003). This has important implications for future port and coastal developments that may impact upon these extensive meadows.
Ports North is the authority responsible for the management of the Port of Thursday Island and they have recognised the importance of maintaining the health of seagrasses located within the port environment. Based on results of the 2002 baseline survey, Fisheries Queensland in conjunction with Ports Corporation Queensland, who managed the port at that time, implemented a biennial long-term seagrass monitoring program to ensure that the ongoing health of the port’s marine environment could be monitored and maintained.
This was the fifth biennial survey since the 2002 baseline survey. The objectives of the survey were to:
1. Monitor the seagrass species composition, area and abundance of the nine seagrass meadows identified for monitoring within the port limits;
2. Assess changes in these seagrass meadows that have occurred since the baseline survey;
3. Incorporate the results into the Ports North/Fisheries Queensland Geographic Information System (GIS) developed for the Port of Thursday Island.
Long-term seagrass monitoring in the Port of Thursday Island February 2012 6
Methods
Seagrass surveys of the Port of Thursday Island were conducted on the 17th and 18th of February 2012. Nine seagrass meadows were selected from the baseline survey (Rasheed et al. 2003) for long-term monitoring. These meadows were representative of the range of seagrass meadows and communities identified in the baseline survey, and were also located in areas potentially influenced by port operations and developments.
Seagrass habitat observations included species composition, above-ground biomass, percent algal cover, sediment type, time and position (Global Positioning System (GPS)). Monitoring meadows were surveyed using a combination of helicopter aerial surveillance and boat based camera surveillance. A detailed description of the methods used to characterise the monitoring meadows is provided in Rasheed et al. (2003).
Seagrass monitoring methodology utilising (A) helicopter aerial surveillance and (B) boat
based remote camera surveillance
Seagrass above-ground biomass was determined using a “visual estimates of biomass” technique (Mellors 1991; Rasheed & Unsworth 2011). This technique involves an observer ranking seagrass biomass in the field in three random placements of a 0.25m2 quadrat at each site. Ranks were made in reference to a series of quadrat photographs of similar seagrass habitat for which the above-ground biomass has previously been measured. Three separate biomass ranges were used: low biomass; high biomass; and an Enhalus range. The relative proportion of the above-ground biomass (percentage) of each seagrass species within each survey quadrat was also recorded. Field biomass ranks were then converted into above-ground biomass estimates in grams dry weight per square metre (g DW m2). At the completion of sampling each observer ranked a series of calibration quadrats that represented the range of seagrass biomass in the survey. After ranking, seagrass in these quadrats was harvested and the actual biomass determined in the laboratory. A separate regression of ranks and biomass from these calibration quadrats was generated for each observer and applied to the field survey data to determine above ground biomass estimates.
Long-term seagrass monitoring in the Port of Thursday Island February 2012 7 The results of the baseline surveys (Rasheed et al. 2003) suggest that meadows where Enhalus acoroides was present but not dominant, require a different approach to the analysis of biomass for meadows where Enhalus acoroides was dominant. The dry weight biomass for Enhalus is many orders of magnitude higher than other tropical seagrass species and dominates the average biomass of a meadow where it is present. Therefore, isolated Enhalus plants occurring within the Halodule/Halophila dominated meadows (Meadows 1, 5 and 8) were excluded from all biomass and species analyses in order to track the dynamics of these morphologically distinct species.
Habitat Mapping and Geographic Information System
Spatial data from the field surveys were incorporated into the Ports North/DAFF Thursday Island Geographic Information System (GIS). Three seagrass GIS layers were created in ArcMap:
• Habitat characterisation sites – point data containing above-ground biomass (for each species), dbMSL, sediment type, time, latitude and longitude from GPS fixes, sampling method and any comments.
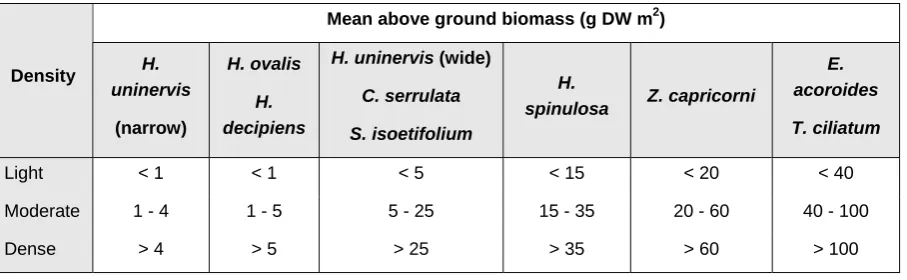
• Seagrass meadow biomass and community types – area data for seagrass meadows with summary information on meadow characteristics. Seagrass community types were determined according to species composition from nomenclature developed for seagrass meadows of Queensland (Table 1). Density categories (light, moderate, dense) were assigned to community types according to above-ground biomass of the dominant species (Table 2).
• Seagrass landscape category – area data showing the seagrass landscape category determined for each meadow :
Isolated seagrass patches
The majority of area within the meadows consisted of un-vegetated sediment interspersed with isolated patches of seagrass
Aggregated seagrass patches
Meadows are comprised of numerous seagrass patches but still feature substantial gaps of un-vegetated sediment within the meadow boundaries
Continuous seagrass cover
Long-term seagrass monitoring in the Port of Thursday Island February 2012 8
Table 1: Nomenclature for community types in the Port of Thursday Island 2012
Community type Species composition
Species A Species A is 90-100% of composition
Species A with Species B Species A is 60-90% of composition
Species A with Species B/Species C Species A is 50% of composition
Species A/Species B Species A is 40-60% of composition
Table 2: Density categories and mean above-ground biomass ranges for each species used in determining seagrass community density in the Port of Thursday Island 2012
Mean above ground biomass (g DW m2)
Density H. uninervis
(narrow)
H. ovalis
H. decipiens
H. uninervis (wide)
C. serrulata
S. isoetifolium
H.
spinulosa Z. capricorni
E. acoroides
T. ciliatum
Light < 1 < 1 < 5 < 15 < 20 < 40
Moderate 1 - 4 1 - 5 5 - 25 15 - 35 20 - 60 40 - 100
Dense > 4 > 5 > 25 > 35 > 60 > 100
Long-term seagrass monitoring in the Port of Thursday Island February 2012 9
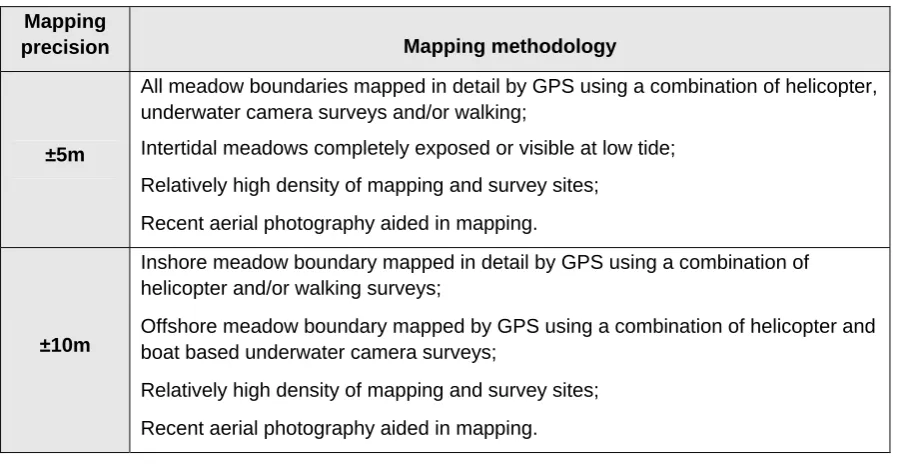
Table 3: Mapping precision and methodology for seagrass meadows in the Port of Thursday Island 2012
Mapping
precision Mapping methodology
±5m
All meadow boundaries mapped in detail by GPS using a combination of helicopter, underwater camera surveys and/or walking;
Intertidal meadows completely exposed or visible at low tide;
Relatively high density of mapping and survey sites;
Recent aerial photography aided in mapping.
±10m
Inshore meadow boundary mapped in detail by GPS using a combination of helicopter and/or walking surveys;
Offshore meadow boundary mapped by GPS using a combination of helicopter and boat based underwater camera surveys;
Relatively high density of mapping and survey sites;
Recent aerial photography aided in mapping.
Statistical Analysis
To determine differences in seagrass biomass of individual meadows, normality was assumed for all meadows and one-way Analysis of Variance (ANOVA) was conducted. Where data passed the equal variance test for pairwise comparisons, a LSD test was used. Where data failed the equal variance test, a Behrens-Fisher test was used (Zar 1999). The Behrens-Fisher is a two-tailed t test that uses a weighted degrees of freedom due to the unequal variances among the groups being tested.
The test statistic is:
And the degrees of freedom is calculated as:
Long-term seagrass monitoring in the Port of Thursday Island February 2012 10
Results
Seagrass species, distribution and abundance for monitoring meadows
in 2012
Ten seagrass species (from three families) were identified in the February 2012 seagrass monitoring survey. For a complete list of seagrass species found within the port limits see Rasheed et al. (2003).
Family Species
Cymodocea serrulata (R.Br.) Aschers
and Magnus
Halodule uninervis (wide and narrow leaf
morphology) (Forsk.) Aschers. in Boissier
CYMODOCEACEAE Taylor
Cymodocea rotundata
Ehrenb. et Hempr. ex Aschers
Syringodium isoetifolium (Ashcers.) Dandy
ZOSTERACEAE
Drummortier
Zostera capricorni
Aschers.
Thalassodendron ciliatum (Forsk.) den Hartog
Enhalus acoroides (L.F.) Royle
Halophila ovalis (R. Br.) Hook. F.
HYDROCHA
RITACEAE Jussieu
Thalassia hemprichii
(Ehrenb.) Aschers. in Petermann
Halophila decipiens Ostenfield
(narrow)
Long-term seagrass monitoring in the Port of Thursday Island February 2012 11 A total of 137 ± 13 ha of seagrass habitat was mapped in the nine seagrass monitoring meadows in 2012 (Table 6; Map 1). Meadow area ranged from 0.4 ha to 86.3 ha, with the smallest meadow located between the Engineers and Main Wharves on Thursday Island (meadow 3) and the largest located on Madge Reef (meadow 26) (Table 6; Maps 2 & 4). A total of 246 monitoring sites (excluding meadow boundary mapping sites) were surveyed, 85% of which had seagrass present (Map 1).
Mean above-ground biomass for the monitoring meadows in February 2012 ranged from 3.6 ± 0.9 g DW m2 for the smallest Halodule ovalis dominated meadow on the southern foreshore of Thursday Island (meadow 3), to 78.5 ± 8.1 g DW m2 for the larger Enhalus acoroides dominated meadow at Madge Reefs (meadow 26) (Table 5; Figure 1).
The nine monitoring meadows that were surveyed included eight different seagrass community types (Table 4; Maps 2-4). Enhalus acoroides dominated communities were the most common, followed by those dominated by Halodule uninervis (thin) and one Halophila ovalis dominated meadow. The Enhalus acoroides meadows were found in the lower intertidal region around Engineer’s Wharf (meadows 4 and 6), and on Madge Reefs. The Halodule uninervis dominated meadows were all located high up on the intertidal banks on the southern and northern foreshores of Thursday Island. The Halophila ovalis dominated meadow was found high up on the intertidal bank between the Engineer’s Wharf and the Main Wharf (Maps 2-4).
Long-term seagrass monitoring in the Port of Thursday Island February 2012 12
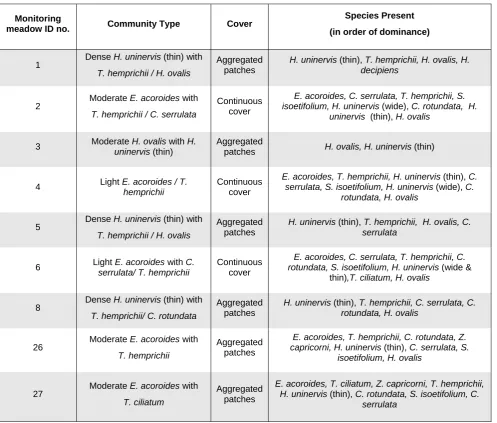
Table 4: Community type, seagrass cover and species present in the nine Thursday Island monitoring meadows, February 2012.
Monitoring
meadow ID no. Community Type Cover
Species Present
(in order of dominance)
1 Dense H. uninervis (thin)with T. hemprichii / H. ovalis
Aggregated patches
H. uninervis (thin), T. hemprichii, H. ovalis, H. decipiens
2 Moderate E. acoroides with T. hemprichii / C. serrulata
Continuous cover
E. acoroides, C. serrulata, T. hemprichii, S. isoetifolium, H. uninervis (wide), C. rotundata, H.
uninervis (thin), H. ovalis
3 Moderate H. ovalis with H. uninervis (thin)
Aggregated
patches H. ovalis, H. uninervis (thin)
4 Light E. acoroides / T. hemprichii
Continuous cover
E. acoroides, T. hemprichii, H. uninervis (thin), C. serrulata, S. isoetifolium, H. uninervis (wide), C.
rotundata, H. ovalis
5 Dense H. uninervis (thin)with T. hemprichii / H. ovalis
Aggregated patches
H. uninervis (thin), T. hemprichii, H. ovalis, C. serrulata
6 Light E. acoroides with C. serrulata/ T. hemprichii
Continuous cover
E. acoroides, C. serrulata, T. hemprichii, C. rotundata, S. isoetifolium, H. uninervis (wide &
thin),T. ciliatum, H. ovalis
8 Dense H. uninervis (thin)with T. hemprichii/ C. rotundata
Aggregated patches
H. uninervis (thin), T. hemprichii, C. serrulata, C. rotundata, H. ovalis
26 Moderate E. acoroides with T. hemprichii
Aggregated patches
E. acoroides, T. hemprichii, C. rotundata, Z. capricorni, H. uninervis (thin), C. serrulata, S.
isoetifolium, H. ovalis
27 Moderate E. acoroides with T. ciliatum
Aggregated patches
E. acoroides, T. ciliatum, Z. capricorni, T. hemprichii, H. uninervis (thin), C. rotundata, S. isoetifolium, C.
13
Map 1. Port of Thursday Island seagrass monitoring meadows and survey sites, 2012
! ( !( ! ( ! ( ! ( ! ( !( ! ( ! ( !( ! ( ! ( !( ! ( !( ! ( ! ( ! ( !( ! ( ! ( ! ( ! ( ! ( ! ( !( ! (!( ! (!(!(!( ! (!(!(!(!(!(!(!( ! (!(!(!(!(!( ! ( ! (!( ! (!(!( !(!( ! ( ! ( ! ( ! ( ! (!( ! ( !( ! (!(!( ! (!( ! ( ! ( ! ( ! (!( ! ( ! (!(!(!(!(!(!( ! ( ! ( ! ( ! ( ! ( ! ( !(!( ! ( ! ( ! ( ! ( ! ( ! ( ! ( ! ( ! ( ! ( ! ( ! ( ! ( ! ( ! ( !( ! ( ! ( ! ( ! ( ! ( ! ( ! ( ! ( ! ( ! ( ! ( ! (!( ! ( ! ( ! ( ! ( ! ( ! ( ! ( ! ( ! ( ! ( ! ( ! ( ! ( ! ( ! ( ! ( ! (!( ! ( ! ( ! ( ! ( ! ( ! (!( ! (!(!(!( !(!( !( ! (!(!( ! (!(!(!(!(!( ! (!(!( ! (!(!(!(!(!(!(!( ! (!(!( ! (!(!(!(!( ! ( ! ( ! (!(!(!( ! (!(!( ! ( ! ( ! (!(!( ! ((!!( !(!(!(!(!((!!((!(!(!!(!(!(!( ! (!(!(!(!(!( ! ( ! ( ! ( ! ( ! (!( ! (!( ! ( ! (!(!(!(!( ! (!(!( ! ( ! (!(!(!(!(!( ! ( ! (!( !(!(!(!(!( 142°16'0"E 142°13'20"E 10°34'40"S 10°36'0"S Legend !
( Seagrass absent !
( Seagrass present
Seagrass monitoring meadows 2012
Complete seagrass distribution 2002 & 2004 Port Limit
±
Thursday Island Horn Island Hammond Island Prince of Wales Island Ellis Cha nnel Aplin Pas sBackground: Beach Protection Authority, 1:50,000, 19/6/92
0 0.5 1 1.5
Kilometres
Source: Davies, JN, McKenna, SA, Rasheed, MA & Taylor HA 2012, ‘Long-term seagrass monitoring in the Port of
Thursday Island February 2012’.DAFF
Publication (Fisheries Queensland, Northern Fisheries Centre, Cairns), 37 pp.
14
5
3
6
4
1
2
142°13'30"E 142°13'0"E
10°35'0"S
10°35'30"S
±
Ellis Chan nel
Thursday Island
Map 2. Port of Thursday Island southern foreshore seagrass monitoring meadows, 2012
0 0.1 0.2 0.3 Kilometers
1
2
4 5
6
Engineer's Wharf
Main Wharf
3
Legend
Complete seagrass distribution 2002 & 2004 Cover Type
Aggregated patches Continuous cover
Community type
Dense Halodule uninervis (thin) with Thalassia hemprichii
Moderate Enhalus acoroides with Thalassia hemprichii / Cymodocea serrulata
Moderate Halophila ovalis with Halodule uninervis (thin) Light Enhalus acoroides with Thalassia hemprichii
Light Enhalus acoroides with Cymodocea serrulata / Thalassia hemprichii
Background image: Beach Protection Authority 1: 50000, 19/6/92 Source: Davies, JN, McKenna, SA,
Rasheed, MA & Taylor HA 2012, ‘Long-term seagrass monitoring in the Port of
Thursday Island February 2012’.DAFF
Publication (Fisheries Queensland, Northern Fisheries Centre, Cairns), 37 pp.
Lon
g-term se
ag
rass mo
nit
o
rin
g
in th
e Port
of
T
hursd
ay Isla
nd
Februa
ry
2012
15 142°13'0"E
10°34'0"S
Aplin P ass
Thursday Island
Map 3. Port of Thursday Island northern foreshore seagrass monitoring meadow, 2012
8
Background image: Beach Protection Authority 1: 50000, 19/6/92
0 0.1 0.2 0.3
Kilometers
±
8
Legend
Cover Type
Aggregated patches
Complete seagrass distribution 2002 & 2004
Dense Halodule uninervis (thin) with Thalassia hemprichii / Cymodocea rotundata
Source: Davies, JN, McKenna, SA, Rasheed, MA & Taylor HA 2012, ‘Long-term seagrass monitoring in the Port of
Thursday Island February 2012’.DAFF
Publication (Fisheries Queensland, Northern Fisheries Centre, Cairns), 37 pp.
Lon
g-term se
ag
rass mo
nit
o
rin
g
in th
e Port
of
T
hursd
ay Isla
nd
Februa
ry
2012
16
142°14'30"E 142°14'0"E
142°13'30"E
10°35'30"S
10°36'0"S
Madge Reefs
Horn Island
Map 4. Port of Thursday Island seagrass monitoring meadows at Madge Reefs, 2012
Background image: Beach Protection Authority 1: 50000, 19/6/92
±
0 0.1 0.2 0.3
Kilometers
Legend
Complete seagrass distribution 2002 & 2004 Cover Type
Aggregated patches
Community type
Moderate Enhalus acoroides with Thalassia hemprichii
Moderate Enhalus acoroides with Thalassodendron ciliatum
Port Limit
27
26
Mangrove boundary
Source: Davies, JN, McKenna, SA, Rasheed, MA & Taylor HA 2012, ‘Long-term seagrass monitoring in the Port of
Thursday Island February 2012’.DAFF
Publication (Fisheries Queensland, Northern Fisheries Centre, Cairns), 37 pp.
Lon
g-term se
ag
rass mo
nit
o
rin
g
in th
e Port
of
T
hursd
ay Isla
nd
Februa
ry
2012
Long-term seagrass monitoring in the Port of Thursday Island February 2012 17
Comparison with previous monitoring surveys
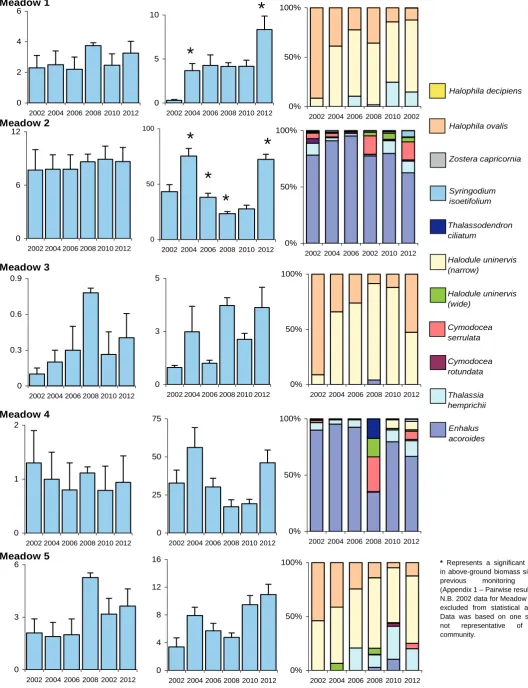
In 2012, seagrass above-ground biomass of the majority of monitoring meadows was the highest recorded since peak levels in 2004, while the area of the meadows generally remained within previously recorded ranges (Tables 5 & 6; Figure 1). Increases in meadow biomass from 2010 to 2012 ranged from 15% to 199% in meadows 5 and 27 respectively with two thirds of the meadows increasing by over 100% (Table 5; Figure 1).
While the total area of Thursday Island monitoring meadows has remained relatively stable since monitoring began, mean above-ground biomass has varied between surveys with a downward trend from 2004 through to 2010 when some recovery was observed (Figure 1; Maps 5-7; Appendix 1). By 2012 significant increases from the low values seen in 2008 had occurred in both the Enhalus and Halodule/Halophila dominated meadows.
Over the course of the monitoring program, the density of Enhalus acoroides dominated meadows was generally much lower in 2006 and 2008 compared to other sampling years. By 2010 all five of these meadows had shown signs of increasing biomass, although these changes were not statistically significant (Figure 1; Appendix 1). This upward trend continued in 2012 with three of the five Enhalus meadows showing significant increases in density compared to 2010, and all five meadows were similar to other high biomass years such as 2004 (Figure 1; Appendix 1). All Enhalus meadows within the Port increased in biomass by over 100% compared to 2010. For example, above-ground biomass increased in the Madge Reef meadows from 23.5 ± 3.5 g DW m2 to 70.2 ± 11.9 g DW m2 in meadow 27 and from 34.2 ± 4.3 g DW m2 to 78.5 ± 8.1 g DW m2 in meadow 26 (Table 5; Figure 1). The area of the Enhalus acoroides meadows remained within the reliability range of previous years monitoring (Table 6; Figure 1; Maps 5-7).
Density of the intertidal, lower biomass Halodule/Halophila dominated meadows has shown high inter-annual variability over the course of the monitoring program with declines and increases in biomass over multiple years (Table 5; Figure 1; Appendix 1). Above-ground biomass in meadow 8 on the northern foreshore of Thursday Island has ranged from 0.4 ± 0.3 g DW m2 in 2002 to 16.0 ± 1.9 g DW m2 in 2012 (Table 5; Figure 1). These changes are considered within the normal scope for low biomass, patchy and naturally dynamic species. Biomass had increased in all of these meadows since 2010 with a statistically significant increase in meadow 1 (Table 5; Appendix 1). In previous years, meadow 3 was strongly dominated by Halodule uninervis, however, in the present survey biomass between Halodule uninervis and Halophila ovalis was more balanced, with Halophila ovalis having slightly more of a presence in the meadow (Figure 1). Despite this shift in the dominant species the change in biomass between 2010 and 2012 in this meadow was not significant (Appendix 1).
Halodule dominated meadows 1, 5 and 8 were at their highest recorded levels in 2012 since monitoring began (Table 5; Figure 1). Meadow 5, located on the southern foreshore of Thursday Island, recorded this increase despite having decreased in area between 2008 and 2010 by 2.1ha and remained below the 2008 distribution in 2012. Meadow 8, located on the northern foreshore of Thursday Island continued the trend from the 2010 survey having increased substantially in area as well as biomass in 2012 (Table 6). The increase in biomass recorded in this meadow may be due in some part to the addition of Cymodocea serrulata to the meadow, a larger, heavier species, combined with the slight increase in meadow area (Table6; Figure 1; Map 6; Appendix 1). The two remaining Halodule uninervis meadows on the southern side of Thursday Island (1 and 3) had both increased slightly in area but remain within the limits of reliability in 2012, after being at their peak distribution in 2008 (Table 6; Figure 1; Map 5).
Long-term seagrass monitoring in the Port of Thursday Island February 2012 18
changes to the minor species were usually related to small increases or decreases of one or two species per meadow. A general trend of increasing seagrass diversity since 2008 continued in this latest survey. One overall pattern noted was the slight increase in presence and density of Halophila ovalis in all but one meadow in which it was a dominant species, reversing the trend of decline seen in the 2010 survey (meadows 1, 5 & 8; Figure 1). For meadow 3, this increase in Halophila ovalis shifted the dominant species in the meadow from Halodule uninervis to Halophila ovalis.
Lon g-term s e a g rass m oni tori n g in t h e Por t o f Thurs d ay Isl a nd Februa ry 2012 19
Table 5: Mean above-ground biomass (g DW m2) for Thursday Island monitoring meadows, March 2002, 2004, 2006, 2008 and
February 2010, 2012; 2005 for Meadows 26 and 27 only.
Mean Biomass (g DW m-2) (% change)
(no. sites within meadow) Meadow ID no.
2002 2004 2005 2006 2008 2010 2012
0.3 ± 0.1 3.7 ± 0.8
(n/a)** -
4.3 ± 1.2 (+16%)
4.2 ± 0.4 (-3%)
4.2 ± 0.7 (+0.3%)
8.4 ± 1.5 (+100%)
1
(10) (28) (23) (22) (27) (17)
43.3 ± 6.3 75.4 ± 6.9
(+74%) -
38.2 ± 3.7 (-49%)
23.4 ± 1.9 (-39%)
27.7 ± 3.4 (+19%)
72.4 ± 4.6 (+161%)”
2
(12) (14) (20) (19) (40^) (25)
0.8 ± 0.1 2.5 ± 1.2
(n/a)** -
1.0 ± 0.1 (-60%)
3.7 ± 0.4 (+271%)
2.1 ± 0.3 (-62%)
3.6 ± 0.9 (+70%)
3
(3) (7) (8) (8) (12) (5)
32.8 ± 8.5 56.2 ± 13.1
(+71%) -
30.2 ± 5.7 (-46%)
17.3 ± 4.6 (-43%)
19.3 ± 2.9 (+11%)
46.1 ± 8.5 (+139%)
4
(14) (6) (5) (5) (19^) (17)
3.4 ± 1.3 7.9 ± 1.2
(n/a)** -
5.7 ± 1.1 (-28%)
4.8 ± 0.7 (-16%)
9.5 ± 1.3 (+99%)
10.9 ± 1.5 (+15%)
5
(8) (26) (25) (26) (18) (21)
55.7 ± 8.9 48.2 ± 8.5
(-13%) -
25.6 ± 6.0 (-47%)
26.3 ± 3.8 (+3%)
26.9 ± 4.2 (+2%)
59.7 ± 5.7 (+122%)”
6
(6) (18) (22) (24) (52^) (27)
0.4 ± 0.3 7.4 ± 1.3
(n/a)** -
10.5 ± 1.6 (+42%)
4.6 ± 0.5 (-56%)
11.7 ± 2.3 (+154%)
16.0 ± 1.9 (+37%)”
8
(8) (31) (3) (34) (23) (31)
68.8 ± 9.8 48.8 ± 5.4 (-29%)
24.1 ± 3.0 (-51%)
41.9 ± 4.7 (+74%)
22.0 ± 2.0 (-47%)
34.2 ± 4.3 (+56%)
78.5 ± 8.1 (+129%)
26
(18) (31) (25) (32) (33) (33) (26) 175.9 ± 0* 47.8 ± 10.6
(n/a)**
24.4± 5.7 (-23%)
32.4 ± 6.2 (+32%)
16.7 ± 3.5 (-48%)
23.5 ± 3.3 (+40%)
70.2 ± 11.9 (+199%)
27
(1)* (13) (8) (10) (10) (25) (20)
*Based on one site not representative of entire community
** Too few sites surveyed in March 2002 to allow reasonable biomass comparison
^ Some sites were omitted from biomass calculations where camera visibility prevented viewing of an entire quadrat
Long-term seagrass monitoring in the Port of Thursday Island February 2012 20 Table 6: Seagrass meadow area (ha) for Thursday Island monitoring meadows, March 2002,
2004, 2006, 2008, and February 2010, 2012.
Area (ha)
(mapping precision range) Meadow
ID no.
2002 2004 2006 2008 2010 2012
2.3 2.5 2.2 3.8 2.5 3.2
1
(1.5-3.1) (1.6-3.4) (1.4-3.0) (3.0-4.6) (1.7-3.2) (2.5-4.0)
7.7 7.8 7.8 8.6 8.9 8.7
2
(5.4-10.0) (6.2-9.4) (6.2-9.4) (7-10.2) (7.4-10.4) (7.1-10.2)
0.1 0.2 0.3 0.8 0.3 0.4
3
(0.05-0.15) (0.1-0.3) (0.1-0.5) (0.6-1.0) (0.1-0.5) (0.2-0.6)
1.3 1 0.8 1.1 0.8 0.9
4
(0.7-1.9) (0.5-1.5) (0.3-1.3) (0.6-1.6) (0.3-1.3) (0.5-1.4)
2.1 1.9 2 5.3 3.2 3.6
5
(1.3-2.9) (1.1-2.7) (1.1-2.9) (4.3-6.3) (2.3-4.1) (2.7-4.6)
13.2 12.4 12.7 16.2 13.2 12.7
6
(10.6-15.8) (10.0-14.8) (10.2-15.2) (13.3-19.1) (10.7-15.7) (10.5-14.8)
12.3 10.4 12.2 8.9 13.4 14.3
8
(10.3-14.3) (8.2-12.6) (10.4-14.0) (7-10.8) (10.7-15.1) (11.5-17.0)
94.5 87.7 89 83.5 89.2 86.3
26
(93.0-96.0) (84.2-91.2) (85.9-92.1) (80.9-86.1) (87.0-92.4) (83.1-89.4)
6.1 7 5.8 5.9 8.2 7.2
27
(5.4-6.8) (6.1-7.9) (5.1-6.5) (5.2-6.6) (7.3-9.1) (6.3-8.0)
139.6 130.9 132.8 134.1 139.7 137.3 Total
Long-term seagrass monitoring in the Port of Thursday Island February 2012 21 Figure 1. Changes in biomass, area and species composition for monitoring meadows in 2002,
2004, 2006, 2008, 2010 and 2012 (Biomass error bars = SE; Area error bars = “R” reliability estimate).
*
*
*
*
*
*
0% 50% 100%2002 2004 2006 2008 2010 2002
0 3 6
2002 2004 2006 2008 2002 2012 0 5 10
2002 2004 2006 2008 2010 2012 0
2 4 6
2002 2004 2006 2008 2010 2012 Meadow 1
0% 50% 100%
2002 2004 2006 2002 2010 2012 0
50 100
2002 2004 2006 2008 2010 2012 0
6 12
2002 2004 2006 2008 2010 2012
0% 50% 100%
2002 2004 2006 2008 2010 2012 Meadow 2
0% 50% 100%
2002 2004 2006 2008 2010 2012 Meadow 3
0% 50% 100%
2002 2004 2006 2008 2010 2012 0
3 5
2002 2004 2006 2008 2010 2012
0 25 50 75
2002 2004 2006 2008 2010 2012
0 4 8 12 16
2002 2004 2006 2008 2010 2012 0
0.3 0.6 0.9
2002 2004 2006 2008 2010 2012
Meadow 4
0 1 2
2002 2004 2006 2008 2010 2012
Meadow 5 Halophila ovalis Halophila decipiens Zostera capricornia Syringodium isoetifolium Thalassodendron ciliatum Halodule uninervis (narrow) Halodule uninervis (wide) Cymodocea serrulata Cymodocea rotundata Thalassia hemprichii Enhalus acoroides
Meadow Area (ha) Biomass (g DW m-2) Species Composition
Long-term seagrass monitoring in the Port of Thursday Island February 2012 22 Figure 1. Changes in biomass, area and species composition for monitoring meadows in 2002,
2004, 2006, 2008, 2010 and 2012 (Biomass error bars = SE; Area error bars = “R” reliability estimate.
*
*
*
0 5 10 15 20
2002 2004 2006 2008 2010 2012
0 2 4 6 8 10
2002 2004 2006 2008 2010 2012 0 15 30 45 60 75
2002 2004 2006 2008 2010 2012 0
8 16 24
2002 2004 2006 2008 2010 2012 Meadow 6
Meadow 8
Meadow 26
Meadow 27
Halophila ovalis Halophila decipiens
Zostera capricornia
Syringodium isoetifolium
Thalassodendron ciliatum
Halodule uninervis (narrow)
Halodule uninervis (wide)
Cymodocea serrulata
Cymodocea rotundata
Thalassia hemprichii
Enhalus acoroides
0% 50% 100%
2002 2004 2006 2008 2010 2012 0
35 70
2002 2004 2006 2008 2010 2012
0 6 12 18
2002 2004 2006 2008 2010 2012
0% 50% 100%
2002 2004 2006 2008 2010 2012
0% 50% 100%
2002 2004 2006 2008 2010 2012
0% 50% 100%
2002 2004 2006 2008 2010 2012 0
28 56 84
2002 2004 2006 2008 2010 2012 70
80 90 100
200220042006200820102012
Meadow Area (ha) Biomass (g DW m-2) Species Composition
na na
142°13'20"E
10°35'0"S
Map 5. Comparision of the southern foreshore seagrass monitoring meadows in the Port of Thursday Island in 2002, 2004, 2006, 2008, 2010 & 2012
2008 2002
1 2
3
4 5
6
Thursday Island
Ellis Chan
nel
2004
2006
2010
±
0 0.2 0.4 0.6
Kilometres
2012
Background image: Beach Protection Authority 1:50000, 19/6/92
Halophila ovalis with Halodule uninervis (thin) dominated Legend
Community type
Enhalus acoroides dominated
Halodule uninervis (thin) dominated
Halodule uninervis (thin)/ Enhalus acoroides dominated
Halodule uninervis (thin)/ Halophila ovalis dominated
Halophila ovalis dominated Complete seagrass distribution 2002 & 2004
Source: Davies, JN, McKenna, SA, Rasheed, MA & Taylor HA 2012, ‘Long-term seagrass monitoring in the Port of
Thursday Island February 2012’.DAFF
Publication (Fisheries Queensland, Northern Fisheries Centre, Cairns), 37 pp.
Lon
g-term se
ag
rass mo
nit
o
rin
g
in th
e Port
of
T
hursd
ay Isla
nd
Februa
ry
2012
Map 6. Comparison of the northern foreshore seagrass monitoring meadows in the Port of Thursday Island in 2002, 2004, 2006, 2008, 2010 & 2012
2008
142°13'0"E
10°34'30"S
2002
8
Thursday Island
Aplin Pas
s
2004
2006
2010 2012
±
0 0.2 0.4 0.6Kilometres
Background image: Beach Protection Authority 1:50000, 19/6/92
Legend
Complete seagrass distribution 2002 & 2004 Community type
Halodule uninervis (thin) dominated
Halodule univervis (thin)/Thalassia hemprichii dominated
Halodule uninervis (thin) withThalassia hemprichii / Cymodocea rotundata dominated
Source: Davies, JN, McKenna, SA, Rasheed, MA & Taylor HA 2012, ‘Long-term seagrass monitoring in the Port of
Thursday Island February 2012’.DAFF
Publication (Fisheries Queensland, Northern Fisheries Centre, Cairns), 37 pp.
8
Lon
g-term se
ag
rass mo
nit
o
rin
g
in th
e Port
of
T
hursd
ay Isla
nd
Februa
ry
2012
Background image: Beach Protection Authority 1:50000, 19/6/92
Map 7. Comparision of the Madge Reefs seagrass monitoring meadows in the Port of Thursday Island in 2002, 2004, 2006, 2008, 2010 & 2012
2010
Legend
Complete seagrass distribution 2002 & 2004 Community type
Thalassadendron ciliatum dominated
Enhalus acoroides dominated
2012 2006
2004
Mangrove boundary
142°15'0"E 142°13'30"E
10°36'0"S
2002
27
26
Horn Island
Madg e Ree
fs
Source: Davies, JN, McKenna, SA, Rasheed, MA & Taylor HA 2012, ‘Long-term seagrass monitoring in the Port of
Thursday Island February 2012’.DAFF
Publication (Fisheries Queensland, Northern Fisheries Centre, Cairns), 37 pp.
2008
Lon
g-term se
ag
rass mo
nit
o
rin
g
in th
e Port
of
T
hursd
ay Isla
nd
Februa
ry
2012
Long term monitoring in the Port of Thursday Island February 2012 26
Port of Thursday Island climate data
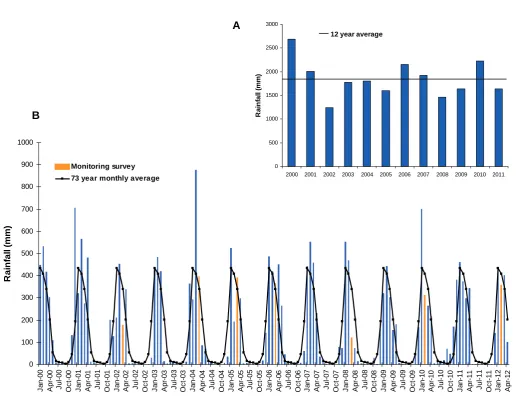
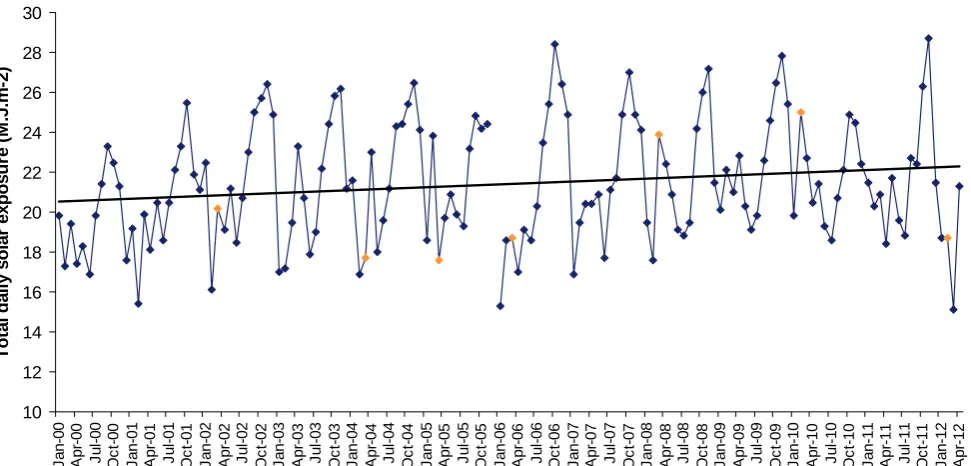
[image:26.595.54.574.319.717.2]Total annual rainfall in 2010 was above the 12 year annual average, predominantly due to rainfall records in January that were well above monthly averages from the past 73 years (Figure 2). Conversely, rainfall in 2011 fell below the 12 year annual average and was similar to total annual rainfall in 2008 and 2009. Rainfall in January of 2012 was similar to 73 year average for that month. Between 2002 and 2005, Horn Island had received below average rainfall creating an extended period of drought-like conditions (Figure 2). The dry season mean monthly maximum temperature (June-October) for 2010 and 2011 was above the 20 year average, continuing five years of above average temperatures (Figure 3). The mean annual maximum temperature for 2011 was close to the 12 year average. Solar radiation has been steadily increasing on Thursday Island since 2000 (Figure 4). Daytime tidal exposure in 2011 was average, however mean dry season exposure in 2010 and 2011 continue a decreasing trend in the number of hours exposed since 2005 (Figure 5).
Figure 2. (A) Mean annual rainfall; and (B) Mean monthly rainfall recorded at Horn Island 2000 to 2011 (Bureau of Meteorology, 2012).
0 100 200 300 400 500 600 700 800 900 1000 J an-00 A p r-00 Ju l-0 0 Oc t-0 0 J an-01 A p r-01 Ju l-0 1 Oc t-0 1 J an-02 A p r-02 Ju l-0 2 Oc t-0 2 J an-03 A p r-03 Ju l-0 3 Oc t-0 3 J an-04 A p r-04 Ju l-0 4 Oc t-0 4 J an-05 A p r-05 Ju l-0 5 Oc t-0 5 J an-06 A p r-06 Ju l-0 6 Oc t-0 6 J an-07 A p r-07 Ju l-0 7 Oc t-0 7 J an-08 A p r-08 Ju l-0 8 Oc t-0 8 J an-09 A p r-09 Ju l-0 9 Oc t-0 9 J an-10 A p r-10 Ju l-1 0 Oc t-1 0 J an-11 A p r-11 Ju l-1 1 Oc t-1 1 J an-12 A p r-12 R a in fa ll (m m ) Monitoring survey 73 year monthly average
A B 0 500 1000 1500 2000 2500 3000
2000 2001 2002 2003 2004 2005 2006 2007 2008 2009 2010 2011
R a in fa ll (m m )
Long term monitoring in the Port of Thursday Island February 2012 27
Figure 3. (A) Mean annual daily maximum air temperature; and (B) Mean monthly maximum air temperature recorded at Horn Island 2000 to 2011 (Bureau of Meteorology, 2012).
Figure 4. Total daily solar exposure recorded at Thursday Island 2000 to 2011 (Bureau of Meteorology). 27 28 29 30 31 32 33 34 35 36 Ja n -0 0 Ap r-0 0 Ju l-0 0 Oc t-00 Ja n -0 1 Ap r-0 1 Ju l-0 1 Oc t-01 Ja n -0 2 Ap r-0 2 Ju l-0 2 Oc t-02 Ja n -0 3 Ap r-0 3 Ju l-0 3 Oc t-03 Ja n -0 4 Ap r-0 4 Ju l-0 4 Oc t-04 Ja n -0 5 Ap r-0 5 Ju l-0 5 Oc t-05 Ja n -0 6 Ap r-0 6 Ju l-0 6 Oc t-06 Ja n -0 7 Ap r-0 7 Ju l-0 7 Oc t-07 Ja n -0 8 Ap r-0 8 Ju l-0 8 Oc t-08 Ja n -0 9 Ap r-0 9 Ju l-0 9 Oc t-09 Ja n -1 0 Ap r-1 0 Ju l-1 0 Oc t-10 Ja n -1 1 Ap r-1 1 Ju l-1 1 Oc t-11 Ja n -1 2 M e an m o n th ly m axi m u m ai r t em p er at u re ( °C
) Monitoring survey73 year monthly average
29.4 29.6 29.8 30.0 30.2 30.4 30.6 30.8 31.0 31.2 31.4
2000 2001 2002 2003 2004 2005 2006 2007 2008 2009 2010 2011
[image:27.595.34.520.497.730.2]Long term monitoring in the Port of Thursday Island February 2012 28
Figure 5. Total number of hours per month that seagrass meadows are exposed on low tide, recorded at Thursday Island 2000 to 2012 (Bureau of Meteorology, 2012)
Long term monitoring in the Port of Thursday Island February 2012 29
DISCUSSION
Seagrass Distribution and Abundance
The results of the 2012 monitoring survey found that seagrasses in the Port of Thursday Island were in a healthy and productive condition with evidence of recovery occurring (2010 and 2012 surveys). Seagrass above-ground biomass for the majority of monitoring meadows was at the highest recorded since peak densities seen in 2004. Seagrass meadow area was similar to 2010 and has generally remained stable throughout the course of the monitoring program with only modest increases and decreases in distribution throughout most of the monitoring meadows. Changes to seagrass meadows in the Port of Thursday Island are likely due to a combination of regional and local climatic conditions rather than any changes in port related or anthropogenic activities.
Tropical seagrass meadows can be highly dynamic (McKenzie 1994), varying in biomass and plant growth by up to a factor of four (Brouns 1985; Erftemeijer and Herman 1994; Lanyon and Marsh 1995). Seagrasses within the Port of Thursday Island and elsewhere throughout Queensland are influenced by a complex interaction of a number of climatic factors including rainfall, wind, solar irradiance, temperature, daytime tidal exposure and photosynthetically active radiation (PAR), which are all known to affect seagrass growth, recruitment and mortality (e.g. Rasheed and Taylor 2008; Rasheed et al. 2008a; 2008b; Rasheed and Unsworth 2011; Chartrand et al. 2012). For example, high amounts of tidal exposure coupled with high daytime temperatures can lead to high levels of PAR and ultra violet radiation, as well as desiccation and temperature stress leading to physiological stress to the leaf structure and photosystems (Stapel 1997; Bjork et al. 1999; Kahn and Durako 2009; Rasheed and Unsworth 2011; Chartrand et al. 2012).
Results of the monitoring at Thursday Island have shown that years in which Enhalus declines have been observed, correspond to years of above average daytime tidal exposure during the dry-season, and years where Enhalus biomass has increased or remained stable correspond to lower than average levels of daytime tidal exposure for the preceding dry season (June – October) (Figure 5). Results from monitoring Enhalus meadows in Weipa, have also demonstrated a negative correlation between biomass and tidal exposure (Unsworth et al. 2012). Trends in Enhalus meadow biomass found in both the 2010 and 2012 surveys at Thursday Island conform to this pattern; in both these years, the amount of hours that seagrasses have been exposed, particularly through the dry-season, was below average (Figure 5). Similarly, the mean annual maximum temperature for Thursday Island in 2011 was on par with the 12 year average, also providing a climate more conducive to for growth of seagrass meadows in the port (Figure 3B). Declines in seagrass biomass and area that were observed along the urbanised east coast of Queensland in 2011 such as Cairns, Mourilyan, Townsville and Abbot Point did not occur at Thursday Island and other Torres Strait monitoring sites. These declines on the east coast have been linked to high rainfall and flooding events to which these areas may be particularly susceptible (see McKenna & Rasheed 2011; McKenna & Rasheed 2012; Reason et al. 2012a; 2012b). However, meadows on Thursday Island are not heavily influenced by river flow and flooding and are therefore less susceptible to these events, allowing for continued plant growth and higher density. It is likely that a combination of environmental factors have driven changes to seagrass observed around Thursday Island.
Long term monitoring in the Port of Thursday Island February 2012 30 favourable growing conditions for this species. Alternatively, competition with other larger species
such as Enhalus acoroides, Thalassia hemprichii and Zostera capricorni may restrict distributions (Coles et al. 1987).
The increase in the presence of Zostera capricorni within the Madge Reef meadows, particularly meadow 26 over the past two surveys may be a result of topographical changes to the intertidal bank. It has been noted over the past three surveys that sediment accretion has been occurring on the southern side of the bank upon which a large mangrove forest is becoming more dominant. It has also been noted by Fisheries staff that over the eastern half of this bank, there are more “high” spots of sediment accretion upon which the dominant species is Zostera capricorni. The increased height of the bank may be favouring hardier Zostera capricorni over the more desiccation prone Enhalus acoroides, allowing displacement to occur. Leuschner et al. (1998) reported that Zostera spp. can take up to five hours to reach 50% water loss from shoots (the level at which desiccation is defined as occurring), whereas Enhalus acoroides has been reported to reach that critical level after only 34 minutes (Bjork et al. 1999).
Seagrass resilience and ecosystem consequences of change
Seagrass species and communities vary in their sensitivity and resilience to impacts, including those associated with port and shipping activity (Erftemeijer and Lewis 2006). Seagrass meadows in north Queensland are typically known to have a high resilience to stress and a good capacity for recovery as long as propagules and established seed banks from which recovery can occur are locally available (Rasheed 2004; Unsworth et al. 2010; Taylor et al. 2011; Chartrand et al. 2012). The resilience of seagrass meadows is dependent upon a complex interaction of many factors, including their carbohydrate reserves, ability of photosystems to recover, capacity for vegetative propagation, seed bank occurrence and disturbance regime (Kenworthy 2000). It is likely that many of the meadows in the Port of Thursday Island have a high degree of resilience and a good capacity to recover from impacts. Surveys by Seagrass-Watch have documented that seagrass meadows on Horn and Thursday Island have good Halodule uninervis seed reserves and a high occurrence of Enhalus acoroides flowers during their peak reproductive season. Studies conducted by the group on Mabuiag Island in the Torres Strait have also found that significant intertidal and subtidal seed banks exist for the majority of species that are found in the Port of Thursday Island monitoring meadows (Taylor et al. 2011). Many of the species present in the Port of Thursday Island have also been found to have a capacity for rapid vegetative colonisation following disturbance (Rasheed 1999; Rasheed 2004; Taylor et al. 2011). However, continual declines over multiple years, such as those that occurred between 2004 and 2008, have the potential to significantly deplete seagrass energy stores, seed banks and standing crop, thereby reducing their natural levels of resilience to future impacts. Under this scenario seagrasses could become increasingly vulnerable to impacts to which they may previously have been resilient. Results from 2010 and 2012 indicate that seagrasses were likely to have recovered to a high level of resilience. Seagrass species assemblages of the Port of Thursday Island are known to fulfil critical ecosystem functions providing important nursery grounds for a number of commercial fisheries species (Coles et al. 1993; Watson et al. 1993). Furthermore, these types of assemblages are those commonly preferred by dugong and green turtle (Bjorndal 1985; Aragones et al. 2006; Marsh and Kwan 2008).
Implications for management and future monitoring
Long term monitoring in the Port of Thursday Island February 2012 31 It is difficult to conclusively determine the exact causes of change within the monitoring meadows
in the Port of Thursday Island when sampling frequency is limited to biennial surveys and the catalyst for change could have occurred anytime within the 2 years prior to a survey event. While the exact causes of the declines between 2004 and 2008, and recovery observed in 2010 and 2012 are not clear, it is unlikely that the port operations or other anthropogenic (human) factors are responsible. It is most likely a result of a combination of favourable climatic factors which have allowed for favourable growing conditions. Seagrass meadows in other northern coastal areas such as Karumba and Weipa also showed increases in biomass and area in 2011 (Carter et al. 2012a; 2012b).
Long term monitoring in the Port of Thursday Island February 2012 32
REFERENCES
Aragones, LV, Lawler, IR, Foley, WJ & Marsh, H 2006, ‘Dugong grazing and turtle cropping: grazing optimisation in tropical seagrass systems?’, Oecologia, vol. 149, pp. 635-647.
Bjork M, Uka J, Weil A, & Beer S 1999, ‘Photosynthetic tolerances to desiccation of tropical intertidal seagrasses’, Marine Ecology Progress Series, vol. 191 pp. 121-126.
Bjorndal, KA 1985, ‘Nutritional ecology of sea turtles’, Copeia, vol. 3, pp. 736-751.
Brouns, JJWM 1985, ‘A comparison of the annual production and biomass in three monospecific stands of the eelgrass Thalassia hemprichii (Ehrenb.) Aschers’, Aquatic Botany, vol. 23, pp. 149-175.
Bulthuis, DA & Woelkerling, WJ 1983, ‘Seasonal variation in standing crop, density and leaf growth rate of seagrass, Heterozostera tasmanica in Western Port and Port Phillip Bay, Victoria, Australia’, Aquatic Botany, vol. 16, pp. 111-136.
Bureau of Meteorlogy 2012, www.bom.gov.au
Chartrand, KM, Ralph, PJ, Petrou, K & Rasheed, MA 2012, ‘Development of a Light-Based Seagrass Management Approach for the Gladstone Western Basin Dredging Program’, DEEDI Publication, Fisheries Queensland, Cairns, pp. 91.
Carter, AB, McKenna, SA & Rasheed, MA 2012a, ‘Port of Karumba Long-term Seagrass Monitoring, November 2011’, DEEDI Publication, Fisheries Queensland, Cairns, pp. 22. Carter, AB, McKenna, SA & Rasheed, MA 2012b, ‘Port of Weipa Long-term Seagrass Monitoring,
2000 - 2011’, DEEDI Publication, Fisheries North, Cairns, pp. 32.
Coles, RG, Lee Long, WG, Squire, BA, Squire, LC, & Bibby, JM 1987, ‘Distribution of seagrass beds and associated juvenile commercial penaeid prawns in north-eastern Queensland waters’, Australian Journal of Marine and Fresh water Research vol. 38, pp. 103- 19.
Coles, RG, Lee Long, WJ, Watson, RA & Derbyshire, KJ 1993, ‘Distribution of seagrasses, and their fish and penaeid prawn communities in Cairns Harbour, a tropical estuary, northern Queensland, Australia’, Australian Journal of Marine and Freshwater Research, vol. 44, pp. 193-210.
Erftemeijer, PLA & Herman, PMJ, 1994, ‘Seasonal changes in environmental variables, biomass, production and nutrient contents in two contrasting tropical intertidal seagrass beds in South Sulawesi, Indonesia’ Oecologia vol. 99, pp. 45-59.
Erftemeijer, PLA & Lewis, RRR 2006, ‘Environmental impacts of dredging on seagrasses: A review’, Marine Pollution Bulletin, vol. 52, pp. 1553-1572.
Kahn, AE & Durako, MJ 2009, ‘Photosynthetic tolerances to desiccation of the co-occurring seagrasses Halophila johnsonii and Halophila decipiens,’ Aquatic Botany, vol. 90, pp. 195-198.
Kenworthy, WJ 2000, ‘The role of sexual reproduction in maintaining populations of Halophila decipiens: implications for biodiversity and conservations of tropical seagrass ecosystems’, Pacific Conservation Biology, vol. 5, pp. 260-268
Lanyon, JM & Marsh, H 1995, ‘Temporal changes in the abundance of some tropical intertidal seagrasses in North Queensland,’ Aquatic Botany, vo. 49, pp. 217-237.
Long term monitoring in the Port of Thursday Island February 2012 33 Lee Long, WJ, McKenzie, LJ, Rasheed, MA & Coles RG 1996, ‘Monitoring seagrasses in tropical
ports and harbours’, Seagrass Biology: Proceedings of an International Workshop, Rottnest Island, Western Australia 25-29 January, 1996 345-350.
Leuschner, C, Landwehr, S & Mehlig, U 1998, ‘Limitation of carbon assimilation of intertidal Zostera noltii and Zostera marina by desiccation at low tide’, Aquatic Botany vol. 62, pp. 171-176.
Marsh, H & Kwan, D 2008, ‘Temporal variability in the life history and reproductive biology of female dugongs in Torres Strait: The likely role of sea grass dieback. Continental Shelf Research, vol. 28, pp. 2152 - 2159.
McKenna, SA & Rasheed, MA 2011, ‘Port of Abbot Point Long-Term Seagrass Monitoring: Interim Report 2008-2011’, DEEDI Publication, Fisheries Queensland, Cairns, 52 pp.
McKenna, SA & Rasheed, MA 2012, ‘Port of Townsville Long-term Seagrass Monitoring, October 2011’ DEEDI Publication, Fisheries Queensland, Cairns, 33pp.
McKenzie, LJ 1994, ‘Seasonal changes in biomass and shoot characteristics of a Zostera capricorni Aschers. dominant meadow in Cairns Harbour, Northern Queensland’, Australian Journal of Marine and Freshwater Research vol. 45, pp. 1337-1352.
Mellors, JE 1991, ‘An evaluation of a rapid visual technique for estimating seagrass biomass’, Aquatic Botany vol. 42, pp. 67-73.
Nienhuis, PH, Coosen, J & Kiswara, W 1989, ‚Community structure and biomass distribution of seagrasses and macrofauna in the Flores Sea Indonesia, Netherlands Journal of Sea Research, vol.23, pp. 197– 214.
Orth, RJ, Carruthers, TJB, Dennison, WC, Duarte, CM, Fourqurean, JW, Heck Jr, KL, Hughes, AR, Kendrick, GA, Kenworthy, WJ, Olyarnik, S, Short, FT, Waycott, M & Williams, SL 2006, ‘A global crisis for seagrass ecosystems’, Bioscience vol. 56, pp. 978-996.
Rasheed, MA 1999, ‘Recovery of experimentally created gaps within a tropical Zostera capricorni (Aschers.) seagrass meadow, Queensland Australia’, Journal of Experimental Marine Biology and Ecology, vol. 235, pp. 183-200.
Rasheed, MA 2004, ‘Recovery and succession in a multi-species tropical seagrass meadow following experimental disturbance: the role of sexual and asexual reproduction’, Journal of Experimental Marine Biology and Ecology, vol. 310, pp. 13 - 45.
Rasheed, MA, Thomas, R, Roelofs, A & Neil, K 2003, ‘Seagrass, benthic habitats and targeted introduced species survey of the Port of Thursday Island: March 2002’, DPI Information Series QI03019 (DPI, Cairns), 28 pp.
Rasheed, MA, Taylor, HA, Coles, RG & McKenzie, LJ 2007, ‘Coastal seagrass habitats at risk from human activity in the Great Barrier Reef World Heritage Area: Review of areas to be targeted for monitoring’, DPI&F Publication PR07-2971 (DPI, Cairns), 43 pp.
Rasheed, MA, McKenna, SA, Sankey, TL & Taylor, HA 2008a, ‘Long-term seagrass monitoring in Cairns Harbour and Trinity Inlet November 2007’, DPI&F Information Series PR07- 3269. 28pp.
Rasheed, MA, Taylor, HA & Sankey, TL 2008a, ‘Port of Weipa Long Term Seagrass Monitoring September 2007’, DPI&F Information Series PR07-3268 22 pp.
Rasheed, MA & Taylor, HA 2008, ‘Port of Karumba Long-Term Seagrass Monitoring, October 2007’, DPI&F Publication PR07-3267 (DPI&F, Northern Fisheries Centre, Cairns) 17 pp. Rasheed, MA & Unsworth, RKF 2011, ‘Long-term climate-associated dynamics of a tropical
Long term monitoring in the Port of Thursday Island February 2012 34 Reason, CL, Chartrand, KM & Rasheed, MA 2012a, ‘Long-term seagrass monitoring in Cairns
Harbour and Trinity Inlet – September 2011’, DEEDI Publication, Fisheries Queensland, Cairns), 37 pp.
Reason, CL, Chartrand, KM & Rasheed, MA 2012b, ‘Long-Term Seagrass Monitoring in the Port of Mourilyan – November 2011’, DEEDI Publication, Fisheries Queensland, Cairns, 29pp. Roelofs, AJ, Rasheed, MA, Thomas, R, McKenna, SA & Taylor, HA 2006, ‘Port of Weipa long term
seagrass monitoring, 2003 – 2005’, Ecoports Monograph Series No. 23 Ports Corporation of Queensland. 31pp.
Stapel, J 1997, ‘Biomass loss and nutrient redistribution in an Indonesian Thalassia hemprichii seagrass bed following seasonal low tide exposure during daylight’, Marine Ecology Progress Series, vol. 148, pp. 251-262.
Taylor, HA, Rasheed, MA, McKenna, SA & Carter, A 2011, ‘Seagrass productivity, resilience to climate change and capacity for recovery in the Torres Strait – Interim report 2011’, DEEDI Publication, Fisheries Queensland, Cairns, 24pp.
Terrados, J, Duarte, CM, Fortes, MD, Borum, J, Agawin, NSR, Bach, S, Thampanya, U, Kamp-Nielson, L, Kenworthy, WJ, Geertz-Hansen, O & Vermaat, J 1998, ‘Changes in community structure and biomass of seagrass communities along gradients of siltation in SE Asia’, Estuarine Coastal and Shelf Science, vol. 46, pp. 757-768.
Underwood, AJ 1997, Experiments in ecology: their logical design and interpretation using analysis of variance, Cambridge University Press, Cambridge, UK.
Unsworth, RKF, McKenna, SA & Rasheed, MA 2010, ‘Seasonal dynamics, productivity and resilience of seagrass at the Port of Abbot Point: 2008 – 2010’, DEEDI Publication, Fisheries Queensland, Cairns, 68 pp.
Unsworth, RKF, Rasheed, MA, Chartrand, KM & Roelofs, AJ 2012, ‘Solar radiation and tidal exposure as environmental drivers of Enhalus acoroides dominated seagrass meadows’, PLoS ONE, vol. 7, e34133.doi:10.1371/journal.pone.0034166, http://www.plosone.org. Watson, RA, Coles, RG & Lee Long, WJ 1993, ‘Simulation estimates of annual yield and landed
value for commercial penaeid prawns from a tropical seagrass habitat, northern Queensland, Australia’, Marine and Freshwater Research vol. 44, pp. 211-220.
Long term monitoring in the Port of Thursday Island February 2012 35
Appendix 1- Biomass Analysis
Summary of statistical results for mean above ground biomass versus year for monitoring meadows in Thursday Island (2002-2012). Bold numbers represent a result of no significant difference in biomass between years.
Meadow 1 DF SS MS F P
Between Years 5 453.33 90.67 4.20 <0.001
Within Years 122 2636.18 21.61
Total 127 3089.51
Meadow 2 DF SS MS F P
Between Years 5 56082.04 11216.41 35.36 <0.001
Within Years 125 39649.07 317.19
Total 130 95731.11
Meadow 3 DF SS MS F P
Between Years 4 40.86 10.21 1.85 0.142
Within Years 35 193.77 5.54
Total 39 234.63
Meadow 4 DF SS MS F P
Between Years 5 17543.28 3508.66 6.36 <0.001
Within Years 72 39737.61 551.91
Total 77 57280.89
Meadow 5 DF SS MS F P
Between Years 5 733.56 146.71 3.48 0.006
Within Years 123 5182.30 42.13
Total 128 5915.86
Meadow 6 DF SS MS F P
Between Years 5 28429.10 5685.82 8.22 <0.001
Within Years 143 98968.72 692.09
Total 148 127397.83
Meadow 8 DF SS MS F P
Between Years 5 2925.36 585.07 6.17 <0.001
Within Years 149 14124.14 94.79
Total 154 17049.51
Meadow 26 DF SS MS F P
Between Years 5 69158.11 13831.62 16.71 <0.001
Within Years 157 129964.91 827.80
Total 162 199123.02
Meadow 27 DF SS MS F P
Between Years 4 25601.69 6400.42 5.68 <0.001
Within Years 81 91246.59 1126.50
Long term monitoring in the Port of Thursday Island February 2012 36
Meadow 1
YEAR 2002 2004 2006 2008 2010 2012
2002 2004 YES
2006 YES NO
2008 YES NO NO
2010 YES NO NO NO
2012 YES YES YES YES YES
Meadow 2
YEAR 2002 2004 2006 2008 2010 2012
2002 2004 YES
2006 NO YES
2008 YES YES YES
2010 NO YES NO NO
2012 YES NO YES YES YES
Meadow 3
YEAR 2002 2004 2006 2008 2010 2012
2002 2004 NO
2006 NO NO
2008 NO NO NO
2010 NO NO NO NO
2012 NO NO NO NO NO
Meadow 4
YEAR 2002 2004 2006 2008 2010 2012
2002 2004 NO
2006 NO NO
2008 NO NO NO
2010 NO NO NO NO
2012 NO NO NO NO NO
Meadow 5
YEAR 2002 2004 2006 2008 2010 2012
2002 2004 NO
2006 NO NO
2008 NO NO NO
2010 NO NO NO NO
2012 YES NO NO YES NO
Meadow 6
YEAR 2002 2004 2006 2008 2010 2012
2002 2004 NO
2006 NO NO
2008 NO NO NO
2010 NO NO NO NO
Long term monitoring in the Port of Thursday Island February 2012 37 *2002 data excluded as too few sites (≤3) were recorded.
Meadow 8
YEAR 2002 2004 2006 2008 2010 2012
2002 2004 YES
2006 YES NO
2008 YES NO NO
2010 YES NO NO NO
2012 YES YES NO YES NO
Meadow 27
YEAR 2004 2006 2008 2010 2012
2004 2006 NO
2008 NO NO
2010 NO NO NO
2012 NO NO YES NO
Meadow 26
YEAR 2002 2004 2006 2008 2010 2012
2002 2004 NO
2006 NO NO
2008 YES YES YES
2010 YES NO NO NO