Repeatability of joint-dominated deployable masts
Thesis by
Olive R. Stohlman
In Partial Fulfillment of the Requirements for the Degree of
Doctor of Philosophy
California Institute of Technology Pasadena, California
2011
c
2011
Acknowledgements
The guidance of my thesis advisor, Prof. Sergio Pellegrino, must be acknowledged first and foremost. Thanks to my parents and brothers.
The Jet Propulsion Laboratory provided the sample mast that made this work possible. Fiona Harrison and Yunjin Kim are gratefully acknowledged for involving the Space Structures Laboratory in the NuSTAR project.
The GALCIT machine shop, John Van Deusen of the mechanical engineering shop, S. Case Bradford, and Maen Alkhader made essential contributions to the experimental work of this thesis. I must note the use of Daniel M. Zimmerman’s Caltech thesis formatting class, Norman Gray’s
textpospackage, and Till Tantou’s fantastic documentation of TikZ & PGF. Special thanks to Paco L´opez Jim´enez and Vincent Zeng for their help in editing this thesis.
Dr. Dan Harris of the Harvard-Smithsonian Center for Astrophysics and Prof. John Krupczak of Hope College have continued to encourage my academic aspirations long after I left my sum-mer internships. My advisor and mentor from Carnegie Mellon University, Prof. Stephen Garoff, introduced me to laboratory work at Carnegie Mellon’s Interfacial Physics Laboratory.
Matt Longnecker showed me that I could operate a power tool and still hope to come away with all my fingers. Without my teammates and seniors from buggy—especially (but far from exclusively) Sonia Balsky, Shafeeq Sinnamohideen, Shandor Dektor, Justin Burstein, and Sean Kelly—I would never have gained the confidence to make foolish errors or reach for success in design.
Abstract
Deployable masts are a class of structure that can be stowed in a small volume and expanded into long, slender, and stable booms. Their greatest benefit as space structures is their packing ratio: masts can typically be packed to a fraction of their deployed length at a diameter only modestly wider than their deployed width. This thesis is concerned with precision deployable masts, which can be stowed and deployed with repeatability of the tip position of better than 1 mm over 60 m. The methods of investigation are experimental measurements of a sample mast and numerical modeling of the mast with specially attention to hysteretic joints.
A test article of an ADAM mast was used for the experimental work. Two categories of experi-ment were pursued: measureexperi-ments of mast components as inputs to the model, and measureexperi-ments of full bays as validation cases for the model. Measurements of the longeron ball end joint friction, cable preload, and latch behavior are of particular note, and were evaluated for their variability. Further measurements were made of a bay in torsion and a short two-bay mast in shear, showing that there is residual displacement in this mast after shear loading is applied and released.
The modeling approach is described in detail, with attention to the treatment of the mast latches, which lock the structure in its deployed configuration. A user element subroutine was used within the framework of the Abaqus finite element analysis solver to model the behavior of the latches with high fidelity.
Contents
Acknowledgements iv
Abstract v
1 Introduction 1
1.1 Motivation and goals . . . 3
1.2 Approach . . . 4
1.3 Outline . . . 5
2 Background 6 2.1 Analysis of trusses and deployable masts . . . 6
2.2 Effects of materials and joints . . . 8
2.3 Metrology and experimental methods . . . 10
2.3.1 Lasers . . . 10
2.3.2 Photogrammetry and videogrammetry . . . 11
2.3.3 Other methods . . . 11
2.4 ADAM mast . . . 12
Definitions of terms . . . 12
2.4.0.1 WSOA sample mast . . . 17
2.4.1 Applications of ADAM . . . 20
2.4.1.1 IPEX-II . . . 20
2.4.1.2 Shuttle Radar Topography Mission . . . 20
2.4.1.3 NuSTAR . . . 21
3 Experimental properties of mast components 23 3.1 Longeron ball-end friction . . . 23
3.1.1 Experiment . . . 24
3.1.2 Results . . . 25
3.2 Cable preload . . . 31
3.2.1 Empirical relationship between tension and vibration frequency . . . 31
3.2.1.1 Calibration experiment . . . 32
3.2.1.2 Results . . . 35
3.2.2 In situ measurements of cable preload . . . 36
3.2.2.1 Experiment . . . 36
3.2.2.2 Results . . . 37
Sample distribution . . . 37
3.3 Latch and cable behavior . . . 39
3.3.1 Stiffness of cables . . . 39
3.3.2 Latch behavior experiment . . . 40
3.3.3 Analytical model of latch . . . 42
3.3.4 Results . . . 43
3.3.4.2 Deviation from fit shape . . . 45
4 Experimental properties of mast bays 47 4.1 Stowage and deployment . . . 48
4.1.1 Experiment . . . 48
4.1.2 Results . . . 49
4.2 Shear loading . . . 52
4.2.1 Experiment . . . 53
4.2.2 Results . . . 54
4.3 Biaxial shear loading . . . 57
4.3.1 Experiment . . . 57
4.3.2 Results . . . 58
5 Finite element model 62 5.1 Basic elements . . . 62
5.1.1 Corner joints and pulleys . . . 63
5.1.2 Battens and longerons . . . 63
5.1.3 Ball-end joints . . . 63
5.1.4 Cables C and D . . . 64
5.2 Latch user element . . . 65
5.2.1 Cable systems . . . 65
5.2.2 Latch constitutive relationship . . . 67
5.2.2.1 Mechanism scale latch motion: analytical model . . . 67
5.2.2.2 Lookup table and blended profile . . . 70
5.2.3 Formulation of user element . . . 73
5.2.3.1 Zones of bead behavior . . . 74
5.2.3.2 Newton-Raphson method and lookup table interpolation . . . 75
5.2.3.3 Stiffness matrix . . . 76
5.3 Model generation . . . 78
5.3.1 Modeling stochastic variability . . . 78
5.3.2 Initializing the mast model . . . 79
6 Parametric studies 82 6.1 Calibration cases . . . 83
6.1.1 Batten stiffness . . . 83
6.1.2 Ball-end friction . . . 85
6.2 Impact of modeling practices . . . 88
6.2.1 Variability in ball-end friction . . . 88
6.2.2 Cable preload - variability . . . 89
6.2.3 Latch model - variability . . . 91
6.2.4 Measured vs. idealized latch behavior . . . 92
6.2.5 Geometric imperfections . . . 93
6.3 Component properties . . . 94
6.3.1 Longeron stiffness . . . 94
6.3.2 Cable stiffness . . . 95
6.3.3 Mean cable preload . . . 96
7 Validation 99 7.1 Torsional motion . . . 100
7.2 Shear loading . . . 104
7.3 Biaxial shear loading . . . 105
8 Discussion 110
B Mast generation code (Matlab) 118 B.1 Mast generation pseudocode . . . 118
C Fortran UEL code 120
List of Figures
1.1 Artist’s depiction of the Shuttle Radar Topography mission above the earth (NASA image [33]). A mast was used to deploy and stabilize the outboard antenna (foreground)
at a distance of 60 m from the orbiter. . . 1
1.2 Deployable masts in the Space Structures Laboratory at Caltech, from left to right: two bays of the WSOA sample mast; Coilable boom in canister; two partially deployed bays of IPEX-II. . . 2
2.1 Hierarchy of mast subsystems and parts. . . 13
2.2 Definition of terms on the mast. Note that latch orientations alternate with each bay. 13 2.3 Notation for a face of an ADAM mast. A latched face is shown in (a) and an unlatched deformation in (b). . . 14
2.4 Closeup of an ADAM mast bay face (a) and cable assembly (b). . . 14
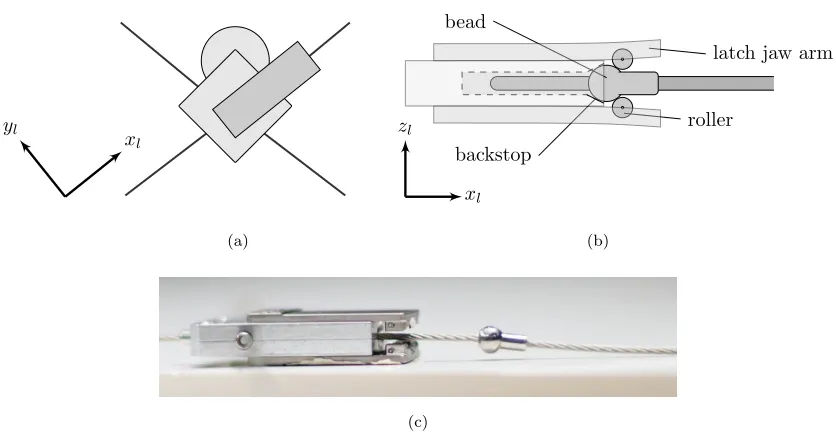
2.5 Definition of terms in the latch. Note that while in the fully latched position, seen in the side view (b), the bead is preloaded against the backstop by the rollers. A photograph of a latch from the sample WSOA mast is shown in (c). . . 15
2.6 The mechanisms of motion of a bay without diagonals. The simple shearing mechanism (a) is active in both shear directions. The torsional mechanism (b) is used to stow the bay. . . 16
2.7 Top view of the completely stowed NuSTAR mast in its deployment canister (NASA image [5]). The corners of the top bay follow a set of white channels to the motorized corkscrew, where it continues towards full deployment while the next batten square enters the opposite set of white channels. . . 17
2.8 The WSOA sample mast, shown with three fully deployed bays and a single partially deployed bay. . . 18
2.9 Batten square of the WSOA sample mast. . . 19
2.10 Longeron (a) and longeron ball end joint (b) of the WSOA sample mast. . . 19
2.11 The SRTM mast (NASA image [33]). The mast is approximately 1 m wide and 60 m long when fully deployed. . . 21
2.12 Artist’s image of NuSTAR, with the optics at left and detectors/spacecraft bus at right (NASA image [5]). . . 21
3.1 Experimental setup for longeron ball end friction test. . . 24
3.2 Time series of displacements and loads for torsion testing of friction. . . 25
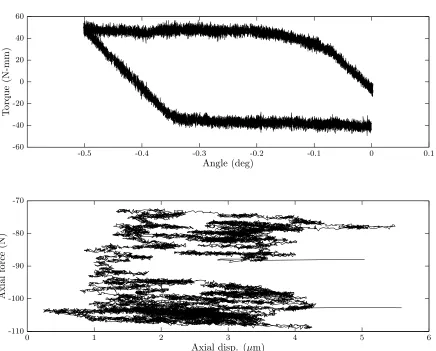
3.3 Force vs. displacment and torque vs. angle curves. . . 26
3.4 Results of friction testing. Each corner was tested four times, and the longeron rotated to a new position for each of the four tests. The straight lines ( ) are fit values of Coulomb friction. Experimental data for the twelve tested longerons is shown in black. 27 3.5 Results of friction testing. Each corner was tested three times, and the longeron rotated to a new position for each of the three tests. The straight lines ( ) are fit values of Coulomb friction. Experimental data for the twelve tested longerons is shown in black. 28 3.6 Geometry of the longeron ball-end joint . . . 29
3.8 Mock bay side with inline force sensors. . . 33 3.9 Mock bay (side view) with vibration testing equipment. . . 33 3.10 Resonance peaks of nine experimental data points. The vertical axis uses a log scale.
Peak values used for the fit are highlighted with vertical lines. . . 34 3.11 Data for empirical fit for the vibration method. Plot (a) shows the data points and
the empirical fit of Equation 3.9; (b) shows the same averaged tensions with the four constituent tensions. . . 35 3.12 The four-bay mast and vibration measurement setup. . . 36 3.13 Four representative sweeps of Bay 2, Side A. The weighted peak is located at the
vertical grey line. When all twelve samples are included, the standard deviation of weighted peak locations is 7.3 N, while the standard deviation of the simple maximum peak locations is 11.7 N. . . 37 3.14 Histogram of sixteen face preloads. The overlaid curve is the normal distribution with
the same mean and standard deviation. . . 38 3.15 The measured force-strain relationship for the cables. The first cycle of stretching
and releasing the cable shows a slightly lower stiffness, while all subsequent cycles are indistinguishable. Lines of slope 60 and 73 kN are underlaid, and fit the loading and unloading curves, respectively. . . 39 3.16 The latching mechanism setup. Two support methods were used without impact on the
results: suspension from above and a combination of a hinged support at the weight end with a simple vertical support at the other end. . . 41 3.17 Photograph of the latch rig in the material testing machine. . . 41 3.18 Placement of retroreflective strips on the latching mechanism. The top strip is applied
to a metal tab, which is fixed to the cable and the back of the bead; the bottom strip is fixed to the body of the latch and away from the jaws, which would deform slightly during bead capture. The bottom strip was applied over black electrical tape to reduce stray reflections. . . 42 3.19 Latch variables (side view). . . 43 3.20 Experimental and fit data for two load displacement cycles of one latch. Only the data
between pairs of vertical lines was used in the fit. A closeup of the near-vertical section aroundx=−2 mm is shown in Figure 3.21 . . . 44 3.21 A closeup of the experimentally measured latch behavior (grey) in contrast with
ideal-ized near-backstop behavior overlaid (black). The figure on the right shows an extreme close up of backstop behavior. Two repetitions of the same loop of bead motion within the same trial are shown. . . 45 3.22 Deviations from idealized shapes of the bead and backstop. A closeup of the front of
a bead, which contacts the backstop, is shown in (a), and (b) shows a closeup of a backstop. . . 46 4.1 Experimental setup for torsion test, showing laser arrangement. . . 48 4.2 Six degrees of freedom defining the motion of the top batten square. . . 50 4.3 Moment-angle relationship in a single bay. A full stowage and deployment cycle is
shown in (a), while in (b) a set of three smaller loops, without any delatching, is superimposed on the same full cycle. . . 51 4.4 Path of the centerpoint of the top batten square in thex-y plane. . . 52 4.5 Schematic of shear loading experiment. The loading cables lie in a plane 57.5 mm
above the center of the top batten square. . . 53 4.6 Detail of force sensors. . . 54 4.7 Loading and displacement patterns for the shear experiment at 0◦. . . 55 4.8 Load and displacement relationships for shear experiments at 0◦ and 90◦. The
4.9 Load and displacement relationships for shear experiments at 0◦ and 180◦. Positions from the 180◦experiment have been inverted so that the plotted coordinates are in the
mast frame. . . 56
4.10 Loading and displacement patterns for an experiment with loading of the top plate and a set with loading at the batten square corners. The bend that appears in the data at zero load is a spurious result that arose from the assumption of rigidity of the top batten square, which was actually deforming out of square. . . 57
4.11 Schematic of biaxial shear loading experiment. Thex-loading cables lie in a plane 57.5 mm above the center of the top batten square; the y-loading cable is 35.5 mm above the center of the top batten square. . . 58
4.12 Loading and displacement patterns for the final data set of the biaxial shear experiment. 59 4.13 Load-displacement and displacement-displacement relationships. The first data set, at 0 N static load, is shown in black ( ) on each plot. . . 60
5.1 Variables for two-section cable. The variables describing the unstretched state are given in (b). . . 66
5.2 Bead positions in the latch. . . 67
5.3 Geometry of the analytical latch model. The geometry of the unstressed latch, without bead contact, is shown in (a). When the bead contacts the latch jaws, it forces them further apart by 2δ, as shown in (b), and the forces of (c) are applied to the bead. . . 68
5.4 Location of the backstop. The value of xbackstop is negative, in accordance with the sign convention of the bead positionx. . . 70
5.5 A representative latch profile (Latch profile #3). The right-hand graph shows the data near the backstop. In (a) is the profile as modeled, with the lookup table section and the analytically defined section. In (b) is the original experimental data and the fit to that data. Slight differences between the experimental and lookup table data are visible where the lookup table data has been processed to obtain a monotonic relationship. . 71
5.6 Another representative latch profile (Latch profile #7). The right-hand graph shows the data near the backstop. In (a) is the profile as modeled. In (b) is the original experimental data and the fit to that data. Slight differences between the experimental and lookup table data are visible where the lookup table data has been processed to obtain a monotonic relationship. . . 72
5.7 User element flowchart . . . 73
5.8 An example of the bead zones. . . 75
5.9 Geometric variables of the user element. . . 76
5.10 Mast initialization and high-level modeling workflow. . . 80
5.11 TensionsTAand TB during mast intialization. Cable unbalancing begins at step 115. 81 5.12 Stabilization factors during mast intialization. . . 81
6.1 Two quantitative measures of mast performance. . . 82
6.2 Top view of deformation and displacement at the measured batten square corner. The direction ofda is parallel to the load vector. . . 83
6.3 Simulation vs. experiment for four values of the batten Young’s modulus. . . 84
6.4 Simulation vs. experiment for four values ofµin the longeron ball-end joints. . . 86
6.5 Relationships between mean ball-end joint friction coefficientµand the range of resting positions (a) and mast stiffness (b). The range of resting positions in the experimental measurements of a two-bay mast was 21µm. . . 87
6.6 Spread in experimental data with and without variation in the ball-end friction. No other properties are randomized. . . 89
6.7 Spread in experimental data with and without variation in the cable preload. No other properties are randomized; a single latch model (#3) is used for all faces. . . 90
6.9 Spread in experimental data with and without variation in the latch model. No other
properties are randomized. . . 91
6.10 Contrast between the use of fit curves and lookup tables near the backstop. . . 92
6.11 Effects of geometric imperfections on the shear response in the (1,1) direction of a two-bay mast (two trials). . . 93
6.12 Shear response of the two-bay mast at various longeron Young’s moduli. . . 94
6.13 Shear response of the two-bay mast at various cable stiffnesses. . . 95
6.14 Simulation vs. experiment for four values of preload tension in the cables. . . 97
6.15 Relationships between mean preload and the range of resting positions (a) and mast stiffness (b). . . 98
7.1 Twist vs. moment for the experiment and simulation with the calibrated ball-end friction value. Gaps occur where the simulation failed to converge within the allotted number of iterations. Because the load steps were split into several files, the simulation picks up after skipping the remainder of the previous file. Three models generated with independent stochastic component properties are included in (a), while a single model is run through multiple loops of torsion in (b). . . 101
7.2 Twist vs. moment for the experiment and simulation with the experimental ball-end friction value.. Gaps occur where the simulation failed to converge within the allotted number of iterations. Because the load steps were split into several files, the simulation picks up after skipping the remainder of the previous file. Four models generated with independent stochastic component properties are included in (a), while a single model is run through multiple loops of torsion in (b). . . 102
7.3 The motion of the four beads in their latches for a torsion simulation. The lines x=−1.4 mm andx= 1.5 mm, where the beads transition from zones 1 to 2 and 2 to 3, respectively, are marked with horizontal lines ( ). . . 103
7.4 Force-displacement curve for shear in the (1,1) direction for six two-bay mast models with stochastic component behaviors and the calibrated ball-end friction valueµ= 0.0375.104 7.5 Force-displacement curve for shear in the (1,1) direction for six two-bay mast models with stochastic component behaviors and the experimental ball-end friction valueµ= 0.14. . . 105
7.6 Shear in thexdirection with zero y load for six two-bay mast models with stochastic component behaviors. (Calibrated ball-end friction value.) . . . 106
7.7 Shear in thexdirection with zero y load for six two-bay mast models with stochastic component behaviors. (Experimental ball-end friction value.) . . . 107
7.8 Shear in thexdirection with simultaneous constant shear in theydirection for six two-bay mast models with stochastic component behaviors (calibrated ball-end friction). Figures 7.8a and 7.8b are for the case ofF−y = 53 N, and Figures 7.8c and 7.8d are for the case ofF−y= 95 N . . . 108
7.9 Shear in thexdirection with simultaneous constant shear in theydirection for six two-bay mast models with stochastic component behaviors (experimental ball-end friction). Figures 7.9a and 7.9b are for the case ofF−y = 53 N, and Figures 7.9c and 7.9d are for the case ofF−y= 95 N . . . 109
8.1 Relationship between mean ball-end joint friction coefficientµand the range of resting positions. . . 111
8.2 The response curves of two- and twelve-bay masts under the same tip shear load. . . . 113
List of Tables
2.1 Sizes of WSOA sample mast parts. . . 18 2.2 Characteristic stiffnesses of mast parts. . . 19 3.1 Summary of friction values. . . 30 3.2 Summary of face resonant frequency data from the four sides of four bays of WSOA.
ndenotes the number of trials; whennis given as (a)b, there wereatrials of whichb
produced usable data. . . 38 3.3 Fit values for eight tested latches. . . 44 5.1 Properties of modeled battens and longerons. . . 63 6.1 Summary of variation in range of resting positions at zero load. Six trials of each type
were performed. . . 92 6.2 Summary of variation in range of resting positions and stiffness at zero load. The
stiffness is considered to be the average of the loading and unloading slopes ∆xload
/∆ux. . . 96
Chapter 1
Introduction
Deployable masts are a class of structures that can be stowed in a small volume and expanded into long, slender, and stable booms. Their greatest benefit as space structures is their packing ratio: masts can typically be packed to under 5% of their deployed length[1]. This thesis is concerned with precision deployable masts, which can be stowed and deployed with repeatability of the tip position of better than 1 mm over 60 m. Whether or not repeatability of hundreds of microns over tens of meters is adequate depends, of course, on the application.
Figure 1.1: Artist’s depiction of the Shuttle Radar Topography mission above the earth (NASA image [33]). A mast was used to deploy and stabilize the outboard antenna (foreground) at a distance of 60 m from the orbiter.
spacecraft drives the cost of the launch vehicle. Masts with position control systems and mastless formation flying systems are possible, but every added level of complexity is a potential point of failure and drives up the risk, cost, and power consumption of the mission. Precision deployable masts are often, therefore, the technology of choice for telescopes and other very long spacecraft.
[image:15.612.152.497.317.577.2]As focusing optics, light collection area, and detector quality improve, the precision of a telescope mast must also improve. The depth of focus—that is, the region in which the detector must be located to produce a well-focused image—is inversely proportional to the resolution of the system; if the density of pixels at the focal plane increases by a factor of two, the range of focal distances that allow an unblurred image decreases by half. At the time of this writing, the only high-precision telescope application of a deployable mast is the upcoming NuSTAR mission, which will require no ongoing focus adjustment [28], despite anticipated thermal extension of the mast of as much as millimeters over its 10-m length.
Figure 1.2: Deployable masts in the Space Structures Laboratory at Caltech, from left to right: two bays of the WSOA sample mast; Coilable boom in canister; two partially deployed bays of IPEX-II.
and requires less volume than a coilable truss of equivalent stiffness. However, its heavily jointed design raises the possibility of complex friction effects. How reliable is a joint-dominated structure in precision applications, and what design factors impact friction behavior? These questions have guided this research, and their answers will drive design decisions in large and precise formation structures of the future.
1.1
Motivation and goals
Tip position is the fundamental measurement of a deployable mast’s performance. This is the position, in six degrees of freedom, of the outboard tip of the mast relative to the base. A given mission will often have particular requirements that the tip position must meet: it must be known to a certain precision at crucial moments in the mission, and it must fall within a certain range during operations. McEachen [31] describes the qualification testing of a deployable mast, which includes modeling of a variety of sources of tip position error. One such source is the cumulative errors of joint misalignments along the structure, a subject of focus in this thesis.
There are many sources of variation in a mast’s tip position. Dynamic effects are their own complete area of study, but even within that field, complete static and quasi-static characterization of a mast may be required to avoid exciting resonant modes during use. Static position errors are dominated by thermal effects, which are present in every type of mast; they are not a special concern of joint-dominated masts. Secondary to thermal distortions are mechanical sources of static position error. Aside from catastrophic mechanical failures, the mechanical sources of change in the tip position are history-dependent material properties and history-dependent interfaces. As with thermal distortions, all masts are similarly subject to material plasticity, strain hardening, and cyclic damage. It is joint-dominated masts in particular that are subject to friction and other interface effects.
While a mast could be composed of unique parts (and some low-aspect-ratio and telescoping masts are), most slender space masts are based on modular designs. This means that they contain many nominally identical parts, and those parts will have a certain spread in their properties. With many properties, this sort of spread is not consequential; the effect is often very small, or averaged out over many bays, or revealed and accounted for after ground testing. It is not obvious, however, that this is true ofevery stochastic property of mast parts.
under-standing the magnitude of their impact on mast performance is the broad goal of this work. More specifically, this thesis will characterize the impact of hysteretic parts and stochastic properties on the linearity and hysteresis of a mast under transient quasi-static load. The framework for this characterization will be applicable to a range of mast designs beyond the particular ADAM mast of this study.
1.2
Approach
The approach of this study is rooted in experiment and modeling. The ultimate product is a framework for modeling a mast with stochastic properties, friction, preloaded cables, and nonlinear part response. The computational model presented here is valid for large displacements, including those displacements that engage the nonlinear effects of the deployment locking mechanism. Joint-driven hysteresis will be addressed through measurements and modelings of two key parts: the longeron joints and the locking mechanism. The effects of stochastic part properties will be addressed through measurements of these two parts and the cable preload.
Two types of experiments are needed to build a mast model: part characterization and mast char-acterization. Part characterization is the measurement of the properties of individual components, such as the spring stiffness of the diagonal cables. The part characterizations presented here focuses on hysteretic and stochastic properties, in keeping with the study goals. In particular, longeron joints, cable preload, and the complex constitutive relationship of the latch were characterized for both their average behaviors and the variability between parts.
Mast characterization comprises measurements of the behavior of an assembled mast of one or more bays. These measurements are essential to the model validation. Two levels of mast motion were measured: a stow-and-deploy cycle that covered a bay’s deployment path, and shear loading of a short two-bay mast. The shear loading results explore the possibilities for tip displacement during use.
hysteretic behavior.
The marriage of detailed characterization of the mast as it is and extensive control over the modeled mast makes it possible to investigate which properties of the mast govern its performance. Analyzing a mast at this level of detail may establish a high degree of confidence in its future behavior and focus design and manufacturing effort on the areas of greatest impact.
1.3
Outline
The remainder of this thesis is organized as follows.
In Chapter 2, the literature on deployable masts and jointed trusses is reviewed. The second part of the background section introduces the particular mast that is the subject of this work.
Chapters 3 and 4 describe two categories of experiment: measurements of mast parts as inputs to the model, and measurements of full bays as validation cases for the model. Chapter 3 deals with the experimental properties of mast parts, specifically measurements of the longeron ball end joint friction, cable preload, and latch behavior. Chapter 4 presents measurements of a bay in torsion and a short two-bay mast in shear.
The modeling methods are overviewed in Chapter 5, with a detailed description of the most important elements. The model of the bay locking mechanism is addressed.
Chapter 6 includes a selection of parametric studies. The parametric studies are focused on the case of a two-bay mast in shear, as in the experiments of Chapter 4.
The validation of the model is presented in Chapter 7, returning to the experimental measure-ments of Chapter 4.
Chapter 2
Background
This chapter begins with a literature review which addresses a number of studies of trusses, deploy-able masts, and joint-dominated structures, including the influences of realistic moving joints and the space environment. Particular masts have been characterized through a number of experimental methods. Important tools for laboratory and in-flight mast characterization include laser rangefind-ing and videogrammetry, and masts of varyrangefind-ing levels of precision and stiffness have been addressed. Studies and missions using the ADAM mast are presented in Section 2.4.1.
2.1
Analysis of trusses and deployable masts
Trusses are a classical topic in mechanics, addressed at length by Timoshenko and Young [48] and others. A deployable jointed truss is first idealized as a pin-jointed truss. This idealization provides a first pass at the stiffness of the mast, and can give a starting point for the required range of material stiffnesses and member lengths that an application will demand. Other researchers have extended this analytical approach to include advanced beam theory, including port-buckling behavior (e.g., Peek and Triantafyllidis [35]).
Within the limitations of linear analysis, there are some basic design parameters that can be identified (or at least bounded) analytically. Greschik [15] describes some of the concerns that arise when rigid elements of a truss are replaced with cables. In particular, it is noted that the cable should be preloaded to at least the maximum stress of the theoretical member it replaces. This also implies that “for a tendon to be used in lieu of a strut, its extreme load after sufficient pretensioning will be at least twice that associated with an equivalent strut with no prestress applied.”[15, p. 559]’ This observation highlights the importance of accurately assessing any nonlinearities in the cable behavior that might appear at high loads. Greschik also notes that asymetric prestressed elements can cause shape eccentricity in an otherwise unstressed truss. This shape eccentricity may go on to impact the stiffness of the structure, essentially prebuckling the previously straight line of longerons. Tan and Pellegrino [47] presented a computational analysis of a pantographic mast. The finite element package ABAQUS was used, with beam elements rather than a detailed solid model. They followed this up with a custom Matlab model, using Guyan reduction to produce a manageably sized model for correlation studies. Results from the Matlab model, which used linear properties for all components, are instructive:
According to [the Matlab model], increasing the active cable pretension has the effect of softening the mast, and the reduction in natural frequencies is approximately linear with the active cable tension. However, experiments had shown the opposite effect and hence it can be concluded that to properly simulate the actual behavior of the model structure it is necessary to consider the effects of the component nonlinearities on the overall vibration behavior.[47]
2.2
Effects of materials and joints
To improve the level of accuracy in predictive modeling of a mast, thermal and micromechanical effects must be included. Thermal expansion can be quite significant, and is a driver of material selection, motivating efforts to match the expansion of metal joints with the contraction of composite members. Kegg [22] describes materials selection that balances graphite rods with metal joints for a low net coefficient of thermal expansion in a deployable mast of the FASTMast design [3]. The negative coefficient of thermal expansion (CTE) of P75 graphite epoxy, at −1×10⁻⁶/◦C,
was balanced against the positive coefficient of 8.3×10⁻⁶/◦C in the titanium joints. When some additional connecting parts were made of ultra-low-CTE Invar, the total mast was able to achieve a CTE of 0.68×10⁻⁶/◦C. Using parts with such mixed properties raises questions of bond strength, also addressed by Kegg. A broad review of stability in space structures has been presented by Edeson et al. [11] and includes a great deal of information on the choice of materials for reliability on the space environment, among other topics.
While thermal effects are an essential area of study for space structures, this thesis will focus on the mechanical sources of error that arise from friction, which affect every stage of mast function. It is occasionally possible ameliorate the effects of friction in the joints by designing solid-state hinges, which have their own limitations. Tape-spring hinges are often quite nonlinear in their behavior [41, 29] and may suffer from the stresses of long-term storage [25]. Tape-spring-based booms are increasingly widely used and well-developed [46], constituting their own class of deployable mast; the applications of these very lightweight masts generally have different demands from the applications for joint-dominated masts. In heavily jointed structures, hysteresis in deployment results in an unpredictable final deployed configuration, especially if gravity has an effect on the hysteretic behavior. This severity of the difference between the expected and realized shapes is compounded if the hysteresis produces an identical error in every joint. ADAM booms, for example, are designed so that its bays are deployed in alternating directions, in the hopes that this will cause deployment errors to cancel one another over the length of the mast. Once a mast is deployed, its resonant frequency and damping factors depend upon friction. The magnitude of friction forces will again depend on gravity and the preload in joints.
presumably through frictional losses. These qualitative observations make it clear that the direction and presence of gravity can be an essential factor in the behavior of a truss, especially the dynamic behavior of a truss without preloaded joints, where the force in the joint due to gravity is much more substantial than loads internal to the truss. Beyond the effects of gravity, many space-qualified lubricants behave differently depending on the atmosphere in which they are tested. For example, Fleischauer [13] described the complications of testing with the solid lubricant molybdenum disulfide, which is sensitive to moisture, asserting that “It is imperative that ground testing and storage of devices lubricated with MoS2 films be effected in a protected environment, either vacuum or inert
gas.” The lifetime of a spacecraft with fluid lubricants can be limited by the time it takes for them to escape under vacuum, inviting sealed joint designs that increase the complexity of the spacecraft. Despite the significance of friction in jointed structures, advanced tribology is not generally applied to their analysis. Generally, the only forms of friction considered are Coulomb friction and viscous damping. Warren et al. [50] consider an analytical model of a latching joint with a simple deadband. They concluded that “this modeled behavior replicates not only the magnitude of the lurches that were observed in the experiments, but also the convergence rate observed in the data.” However, the analytical model was one-dimensional, and thus of only limited relevance to the study’s small deployable structure. Advanced treatments of tribology demand a computational approach and detailed characterization of moving parts.
Friction is a leading source of unpredictable behavior in the transition from the ground to or-bit. Friction, in combination with thermal expansion, is known to cause transient motion. This phenomenon, known as “thermal snap,” occurs when two surfaces are held in static friction and thermal expansion overwhelms the frictional force. As a joint is suddenly released from static fric-tion and then resticks in a new posifric-tion, it shows an accelerafric-tion profile with an impulsive start and damped harmonic ringing. Thermal snap has been produced in a laboratory setting [21], and was studied in orbit with the IPEX-II boom. IPEX-II identified transient thermal snaps as causing accelerations around 120µg at a frequency around 50 Hz [27, p. 4].
Chapman [6] included modal response data of joints and struts with nonlinear behaviors, including free play and hysteresis in joints, in a numerical model for a mast. This complex model, based on detailed experimental characterization of the damping factors and other behaviors of many mast components, produced good agreement with experimental characterization. Subsequent work has been done [7] to better integrate for the many effects of joints on the dynamic responses of joint-dominates structures. Lake et al. [26] presented a summary of a number of concerns relevant to large deployable structures with an eye to stability and microdynamics, common theme in the study of precision and joint-dominated deployable structures.
2.3
Metrology and experimental methods
Experiments on actual flight articles are a necessary pre-flight confirmation of their quality. Ground testing equipment may be required to approach the sensitivity of telescope optics to measure any structural effect that would impact the optical configuration. Sometimes, this requirement can be avoided; the NuSTAR telescope will be launched with a one-time adjustment motor [19], which will slightly reposition the optics to account for errors in the ADAM mast that separates the optics bench and the detectors. An adjustment mechanism like this motor relaxes the mast repeatability requirements, but adds an additional critical, powered, moving part.
Laser distance measurements and MEMS accelerometers are common methods for high-precision experimental observations. Accelerometers can generally only be applied to frequency studies; direct measurements of displacement are preferred for static tests. Lasers have a limited range of detection, so larger motion has often been measured through photogrammetry. Photo- and videogrammetry compare the locations of particular markers on a structure as they move. For complete force-response data, force transducers and shakers are combined with these measurements of the structure position or acceleration response.
2.3.1
Lasers
Laser rangefinders can be used for distance measurements and are a tool of choice for measuring the final deployed length of a boom. A modified off-the-shelf rangefinder was used to monitor the axial motion of the 60-m mast of the Shuttle Radar Topography mission with a precision of approximately 1 mm at a rate of 0.2 Hz [10].
configuration is described by Liebe et al. [28]. The metrology system will determine the position of the mast tip in three degrees of freedom using a set of two lasers and two position sensitive detectors. The lasers are fastened to the outboard tip of the mast, and aimed at detectors on the main spacecraft bus. By reading the position of the laser dots at a rate above the major natural frequencies of the mast, the metrology system will provide crucial data about the pointing of the mast at all times during observation. Because the x-ray detectors record the time and impact position of each incoming photon, the reconstructed images can be corrected to account for motion of the mast tip, even if vibrational modes of the mast are excited during observation. These corrections will allow the system to achieve a resolution that would otherwise demand exceptionally stable pointing of the 10-m mast.
2.3.2
Photogrammetry and videogrammetry
SRTM[9] and the ST8 SAILMAST[32] experiment both made use of photogrammetry. Both of these systems consisted of a “constellation” of LED lights and a camera. In the case of SRTM, a modified star tracker (an Advanced Stellar and Target Reference Optical Sensor) was used to reduce the quantity of output data. The star tracker’s internal software reduces the amount of information output from a full-field image to a set of point locations.
It is generally possible to get sub-pixel resolution of the position of a bright point target with photogrammetry. Generally, this is done by slightly defocusing the camera so that each point is spread over a number of pixels. Then, the center of the circle this forms can be found to precision finer than the size of a pixel. This means that a camera need only have a moderate resolution for modest precision goals. For example, McEachen et al. [32] used a 720 x 576-pixel PAL-video CCD camera and achieved<2 mm resolution at a 40-m distance.
2.3.3
Other methods
Accelerometers were the primary tool of the Interferometry Program Experiment II (IPEX-II), and used in previous investigations of thermal snap [20]. In this experiment, an ADAM mast was observed in the space environment under various thermal and vibrational loads. IPEX-II was mounted on ASTRO-SPAS, a free-floating experimental platform, so it was free of major dynamic loads and subject only to intentional loading, thermal loading, and the motion of the data recording tape drives. Accelerometers have also been used for regular modal analysis, as in [14] and [47].
Greschik and Belvin [16] proposed a system of fly beams to support large structures during dynamic testing with minimal disturbance to the vibrational mode shapes.
2.4
ADAM mast
Proposed mast geometries and packing methods are quite diverse. Mast designs can be distinguished from one another by their deployment method and the deformations that the bays undergo during stowage and deployment. Partially and fully strain-energy-deployed masts exist in a number of geometries, and include FASTMast [3], Coilable [2], the MARSIS antenna [30], and Astromast [12]. Aside from the jointed FASTMast, these designs all feature some type of continuous longitudinal members or solid strain-deformable hinges. Another class of deployable masts requires entirely powered deployment, often working against strain energy in parts that will be provide preload in the deployed state. ADAM is one such mast, and perhaps the most prominent in space applications. The ADAM mast is a deployable truss structure, patented in 1993 [8]. It has since been used in a number of space missions and studies. The design is modular and jointed. ADAM must be deployed from a motorized canister and includes a reversible locking mechanism on each face of each bay. Each bay locks independently, allowing the mast to be deployed one or two bays at a time. Because the bays are jointed, the longerons can be relatively wide and stiff, unlike the deformable longerons of a Coilable [2] or Astromast [12], achieving a given stiffness in a container of smaller radius than a continuous-longeron mast. The ADAM design can be understood as a deformable box-shaped structure of stiff members, shaped and rigidized by cables and an integrated latching system.
mast bay
face
cable assembly
latch assembly
pulley latch jaws
backstop cable D
cable C
cable A-B bead
longeron ball-end joint batten
corner joint batten square
batten corner joint
Figure 2.1: Hierarchy of mast subsystems and parts.
This hierarchy is further illustrated in Figures 2.2, 2.3, and 2.5. The mast is composed of repeating bays, with longerons in the axial direction and battens providing perpendicular spacing. Diagonal cables A, B, C, and D on each face carry tension when the mast is fully deployed.
x y z bay
cable assembly
face longeron
batten square batten
corner joint
Figure 2.2: Definition of terms on the mast. Note that latch orientations alternate with each bay.
x z
cable A-B
bead cable C cable D
pulley ball-end
(a) (b)
Figure 2.3: Notation for a face of an ADAM mast. A latched face is shown in (a) and an unlatched deformation in (b).
(a) (b)
Figure 2.4: Closeup of an ADAM mast bay face (a) and cable assembly (b).
roller
latch jaw arm bead
backstop
xl
yl
xl
zl
(a) (b)
[image:28.612.115.533.91.309.2](c)
Figure 2.5: Definition of terms in the latch. Note that while in the fully latched position, seen in the side view (b), the bead is preloaded against the backstop by the rollers. A photograph of a latch from the sample WSOA mast is shown in (c).
(a) Shear mechanism. (b) Torsion mechanism.
Figure 2.6: The mechanisms of motion of a bay without diagonals. The simple shearing mechanism (a) is active in both shear directions. The torsional mechanism (b) is used to stow the bay.
Because of the different structural roles of the battens, longerons, and diagonals, the mast’s resistance to bending and axial deformations is driven by the stiffness of the battens and longerons, while its resistance to torsion and shear is driven by the stiffness of the diagonals. Hence, torsional and shear motions are more likely to interact with the locking mechanisms on the cable assemblies. In extreme cases, such interactions could cause catastrophic failure of the mast by unlocking a bay side, but before that occurs, the elasticity of the mast will become nonlinear and hysteretic effects in the latch may create persisting changes in the overall shape of the mast.
channels
[image:30.612.122.451.84.344.2]corkscrew
Figure 2.7: Top view of the completely stowed NuSTAR mast in its deployment canister (NASA image [5]). The corners of the top bay follow a set of white channels to the motorized corkscrew, where it continues towards full deployment while the next batten square enters the opposite set of white channels.
2.4.0.1 WSOA sample mast
Figure 2.8: The WSOA sample mast, shown with three fully deployed bays and a single partially deployed bay.
Table 2.1: Sizes of WSOA sample mast parts. Bay width (longeron ball end to ball end 230 mm Bay height (center of latch to center of latch) 170 mm Longeron length (ball end to ball end) 150 mm
Stowed height per bay 15 mm
Stowed radius (including joints) 350 mm
No engineering data about the sample mast was available, requiring initial estimates of the stiffness of parts. The battens, shown in Figure 2.9, are made of a carbon composite, which was assumed to be solid. The longerons, shown in Figure 2.10 appear to be aluminum. The longerons are taped at either ends, and each have a mass of 32 g with the end fittings, with a length of approximately 146 mm and a radius of approximately 5 mm; assuming they are made of aluminum, these dimensions give an expected mass of approximately 31 g for solid aluminum, consistent with the measured mass. Further analysis of, and adjustments to, these assumptions is presented in Section 6.1. As summarized in Table 2.2, the battens and longerons are on the order of 100 times stiffer than the cables, and hence the behavior of the sample mast is not highly sensitive to their actual stiffness values.
Figure 2.9: Batten square of the WSOA sample mast.
(a)
(b)
[image:32.612.205.446.75.323.2]Figure 2.10: Longeron (a) and longeron ball end joint (b) of the WSOA sample mast.
Table 2.2: Characteristic stiffnesses of mast parts.
Part Axial stiffness (kN) Young’s modulus (GPa) Radius (mm)
Battens 6500 220a 3.1
Longerons 5000 70b 4.8
Cables 73 -
-aIndirectly calibrated, see Section 6.1.1
2.4.1
Applications of ADAM
2.4.1.1 IPEX-II
IPEX-II flew on the Space Shuttle Discovery in August of 1997. Its purpose was purely the study of truss behavior in the space environment [27]. One of the primary goals was to observe thermal snap in orbit, so it was outfitted with high-sensitivity accelerometers. It demonstrated that thermal snap (slipping against static friction in a joint due to thermal expansion) occurred in an ADAM mast when it moving into and out of sunlight. The IPEX-II mast has also been used as test hardware in a number of studies on mast dynamics [34] and micromechanics. Hardaway and Peterson [18] used the IPEX-II mast to demonstrate that a jointed bay, under shear loads much lower than those that would cause frictional slippage, would produce very subtle vibrations in its shear mode. This was attributed to “the sudden release of strain energy stored in the hysteretic mechanisms and/or the materials of the structure.” [18, p. 2076]
An early version of ADAM, IPEX-II was not produced for a specific structural use and lacks certain features of later systems, such as a reliable latch backstop. It was used for some preliminary testing in this project, but the WSOA sample mast was preferred because it is a later model with a variety of performance advantages.
2.4.1.2 Shuttle Radar Topography Mission
The Shuttle Radar Topography Mission (SRTM) was flown by the Space Shuttle Endeavour as a part of STS-99 in February of 2000. SRTM used an ADAM boom to create a long 60-m separation between two parts of its interferometric synthetic aperture radar system [17]. This radar system was used to generate an elevation map of the majority of the earth’s surface in greater detail than had been previously available.
Figure 2.11: The SRTM mast (NASA image [33]). The mast is approximately 1 m wide and 60 m long when fully deployed.
either case, Umland describes a failure that resulted from minute changes in a tightly toleranced moving part during the time spent in storage.
Despite this difficulty, the SRTM experiment produced an altitude map of 80% of the earth’s surface. Calibration of the radar data [52] required simultaneous tracking, through the metrology system, of the position and attitude of the outboard antenna. GPS and ground telemetry for the shuttle orbiter were also integrated for production of the final map.
At the time of this writing, the SRTM mast is on display in the Smithsonian Air and Space Museum[44]. It is, at 60 m, the longest rigid structure ever flown in space [33].
2.4.1.3 NuSTAR
NuSTAR (Figure 2.12) is an x-ray telescope, scheduled to launch in 2012, which will dramatically improve astronomers’ ability to resolve objects in the hard x-ray spectrum. It will take observations in the range of 10-79 keV with 40 arcsecond resolution [5]. X-ray focusing optics, unlike visible light optics, rely on reflective elements oriented at grazing angles to the incoming rays [23], and the focal length of this telescope is consequently quite long in comparison to the diameter of its optics. The optics will be deployed and held 10 m away from the detectors by an ADAM boom. NuSTAR is the precision use of this technology to date, and also arguably the highest-precision application currently possible. The focusing requirements of this system are not very stringent, requiring accuracy of millimeters in the axial separation between the optics and the detectors [28].
Because the absolute deployment location of the mast is difficult to measure on the ground, due to complications associated with complete gravity offloading, an adjustment mechanism is built into the last section of the mast to enable a one-time alignment to optimize the location of the optical axes on the focal plane. This mechanism provides two angular adjustments as well as rotation. The mast is not perfectly rigid, but undergoes thermal distortions particularly when going in and out of Earth shadow (the mission is deployed in a low-Earth orbit) that translate into changes in telescope alignment of 1–2 [arcminutes].[19, p. 5]
Chapter 3
Experimental properties of mast
components
This section presents experimental measurements of the longeron ball-end joint friction, the in situ cable preload, the cable stiffness, and the latch behavior.
Characterization of the latches occupies a substantial portion of this chapter because they are the most complex single part on the mast, and because their behavior is very difficult to model from first principles. Because the latches are typically under tension during use, and because of the relatively large displacements they can undergo, the support rigging for latch measurements required special attention.
3.1
Longeron ball-end friction
Friction in the ball-end joints of the mast resists rotation of the longerons in their sockets. A very low friction can lead to behavior that resembles a mast with pin joints, while very high friction approaches the behavior of an unjointed structure. The load required to guarantee sticking or slipping is dependent on joint friction coefficients, so this parameter works in concert with the cable preload to determine whether there will be joint slippage and the range of positions the joint can maintain against the restoring forces at work in the mast.
3.1.1
Experiment
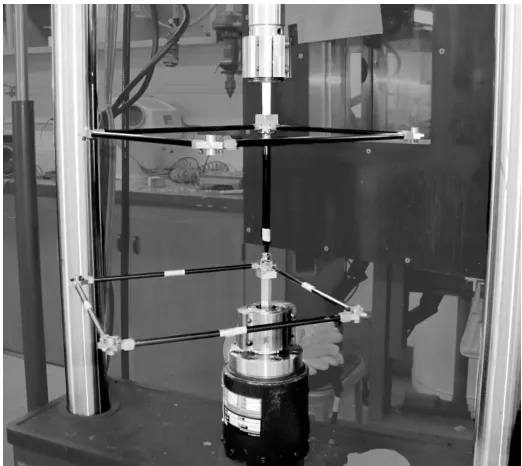
[image:37.612.193.454.261.494.2]The ball-end joint friction was measured using an MTS material testing machine, model 358.xx, with axial-torsional load cell model 110.19. This is a pneumatic machine and can simultaneously control torsion and axial load, with a load cell capacity of 3300 lbf (15 kN) in axial force and 1500 in-lbf (170 N-m) in torsion. One longeron and its two batten corner fittings were tested at once (therefore, it is expected that the results describe slippage of whichever end had less friction). The batten corner fittings cannot be detached from the batten squares, so remained connected during the tests, as can been seen in Figure 3.1. The head was adjusted to provide between 75 and 400 N of compressive force on the vertical longeron.
Figure 3.1: Experimental setup for longeron ball end friction test.
rotation in actual use.
0 100 200 300
-120 -100 -80 -60
Time (s)
Axial
force
(N)
0 100 200 300
-50 0 50 100
T
orque
(N-mm)
0 100 200 300
-5 0 5 10×10
−3
Axial
disp.
(mm)
0 100 200 300
-1 -0.5 0 0.5
Angle
[image:38.612.211.387.117.417.2](deg)
Figure 3.2: Time series of displacements and loads for torsion testing of friction.
Four longerons were tested. These were the longerons from the four corners of the top bay of the WSOA mast. The top two bays were used in all the full-bay experiments.
3.1.2
Results
Figures 3.4 and 3.5 show the results of the torsion testing of longerons under compressive load. The effect of friction can be reduced to the ratioτ /Faxial, which ranged fromτ /Faxial= 0.2 to 0.6 mm,
for torqueτ and axial loadFaxial.
0 1 2 3 4 5 6 -110
-100 -90 -80 -70
Axial disp. (µm)
Axial
force
(N)
-0.5 -0.4 -0.3 -0.2 -0.1 0 0.1
-60 -40 -20 0 20 40 60
Angle (deg)
T
orque
[image:39.612.105.541.210.561.2](N-mm)
-300 -200 -100 0 -100
0 100
Axial load (N)
-300 -200 -100 0 -100
0 100
-300 -200 -100 0 -100
0 100
T
orque
(N-mm)
-300 -200 -100 0 -100
0 100
(a) Corner BC
-300 -200 -100 0
-100 0 100
Axial load (N)
-300 -200 -100 0
-100 0 100
-300 -200 -100 0
-100 0 100
T
orque
(N-mm)
-300 -200 -100 0
-100 0 100
[image:40.612.158.493.115.694.2](b) Corner DA
-300 -200 -100 0 -100
0 100
Axial load (N)
-300 -200 -100 0
-100 0 100
T
orque
(N-mm)
-300 -200 -100 0
-100 0 100
(a) Corner CD
-300 -200 -100 0
-100 0 100
Axial load (N)
-300 -200 -100 0
-100 0 100
T
orque
(N-mm)
-300 -200 -100 0
-100 0 100
[image:41.612.148.507.158.628.2](b) Corner AB
circle of contact
4mm
[image:42.612.242.400.77.272.2]55◦ 2.3 mm
Figure 3.6: Geometry of the longeron ball-end joint
Assuming uniform friction around the contact circle, it is possible to approximate the metal-on-metal kinetic friction as follows.
Ff =µmetalFn (3.1)
Fn=
Faxial
sin(55◦) (3.2)
(2.3 mm)Ff =τ (3.3)
µmetal≈
τ Faxial
sin 55◦
2.3 (3.4)
This corresponds to a range from µ= 0.08 to 0.21 for the metal-on-metal friction in the joint. This result is of the order of magnitude of friction coefficients for unlubricated metal-on-metal friction.1 Several things are noteworthy about these results. As mentioned, the compression varied throughout each experiment; while this was not intended, it revealed that the data does show some resemblance to the idealized frictional behavior, in the sense that there are at least locally linear relationships, passing through (0,0), between the compression and the torque.
There is a notably large spread in the data, and even within the data on any given longeron. This is somewhat related to the length of the test, or the number of cycles of torsional motion the longeron undergoes in a given data set. For example, Figure 3.7 shows the fifteen cycles used to characterize corner DA at one angular position. All tests produced the same effect: the joints appear
1For example,µ≈0.5 for brass on mild steel [51, p. 139], although no information about the specific materials
to increase in friction as they are worked back and forth over a number of cycles.
First cycle Last cycle
-300 -250 -200 -150 -100 -50 0 0
10 20 30 40 50 60 70
Axial load (N)
T
orque
(N-mm)
Figure 3.7: Close view of the fourth data set for corner DA.The friction value appear to increase with each cycle of torsional motion.
Table 3.1: Summary of friction values.
Corner (number of longeron rotations) meanτ /Faxial±st. dev. meanµ±st. dev.
AB (3) 0.39±0.04 mm 0.12±0.02 BC (4) 0.60±0.07 mm 0.21±0.02 CD (3) 0.36±0.06 mm 0.14±0.01 DA (4) 0.23±0.02 mm 0.081±0.008 Four corners 0.39±0.15 mm 0.14±0.05
The ball-in-cone shape of the joint creates a dilemma in modeling the friction, even under the assumption that the ball joint reliably rests loaded against the cone. The distance from the axis of rotation of the ball to the circle of contact with the cone is dependent on the axis of rotation. As described in Section 5.1.3, this effect is ultimately disregarded in the computational model, as further calibration of the friction values was done.
friction value ofµ≈0.03. The implementation of the idealized but varied friction values is discussed in Section 5.3.1.
Measurements of the longeron joint friction could be improved with a more involved approach to these measurements. More repeatable alignment of the parts in a testing rig may be possible, and more controlled surface cleanliness and ambient conditions would be ideal. It would be useful to measure the friction reaction for different directions of joint rotation. The possibility of angle-dependent friction exists as well, due to the surface flaws in these joints and sockets. It would also be possible to measure the response of a bay skeleton, without cables, in simultaneous axial and torsional loading, which would exercise the most common direction of motion for the longeron joints. The study of the ball-end joint behavior could be greatly expanded, but the approach pursued here did not produce successful a priori knowledge of the longeron ball-end joint friction for the mast model.
3.2
Cable preload
The diagonal cables on the face of each bay carry tension in the fully deployed and locked configura-tion. Under normal operating conditions, the cables should always be tensioned and never slack. A number of manufacturing conditions affect the range of cable preloads, including the elastic modulus of the cable, the length of the cable, and the sizing of all the surrounding parts, which in tandem determine the final position of the face corners.
The level of preload in the cables is an important input to the model, affecting the state of the latches and friction in the longeron end joints. Although the cable preload in this structure was evaluated primarily for its relationship with friction, preloads in the general case can be noteworthy for their effects on structural stiffness, as discussed by Pellegrino [36], and the subject is of general importance in predicting structural performance. The primary goal of these experiments was to identify the mean and standard deviation of the cable tensions in a deployed mast. This was later transformed into a statistical distribution of initial cable lengths for the finite element model.
3.2.1
Empirical relationship between tension and vibration frequency
existence of a simple relationship between the tension in the cables and the restoring force against out-of-plane motion on a face.
Assuming that the latch assembly is suspended in the plane of the bay face by four cables of equal lengthL and tensions T1 throughT4, it will experience a restoring force Fr at the center of
the latch assembly for a small out-of-plane displacementδof
Fr=
4
X
i=1
Ti
δ
L; (3.5)
which, further assuming massless cables and a latch mass m, can be connected to the resonant frequency for small vibrations,ω, through Equation 3.6
ω2= Fr
mδ =
P4
i=1Ti
Lm (3.6)
Equation 3.6 is the guiding relationship for the identification of cable preload. No attempt will be made to identify true values of Lor m, only the overall coefficients that define the relationship betweenf =ω/2π andTmean=P
4
i=1Ti/4. Simultaneous measurements off andTmean produced
the coefficients of a quadratic polynomial that is used in Section 3.2.2 as the calibration curve for in situ cable preload measurements.
3.2.1.1 Calibration experiment
The measurement procedure consisted of applying a vibrating force to the latch at the center of a bay face and identifying the bay side’s resonant frequency in out-of-plane motion. There is a monotonic relationship between cable tension and resonant frequency, which had to be quantitatively identified before in situ cable tensions could be measured. Because of the difficulties inherent in measuring the tension of a stranded cable in situ, a mock bay side (shown in Figure 3.8) with space for inline force sensors (Futek model LCM300, with a capacity of±250 lbf [1110 N]) was built.
Force sensor
x z
Figure 3.8: Mock bay side with inline force sensors.
The latch at the center of the cable assembly was excited by a Labworks, Inc., model ET-132 shaker performing a sine wave sweep from 50 to 100 Hz over 5 minutes. This range was selected after a number of preliminary sweeps established the typical peak locations. A force sensor at the end of the shaker sting measured the applied force, while a Keyence model G157 laser rangefinder tracked the out-of-plane motion of the latch. The positions of the shaker, force sensor, and laser can be seen in Figure 3.9. Data was recorded at 1000 Hz. Dividing the fast Fourier transform (FFT) of the displacement by the FFT of the applied force, a clear peak can be identified. A set of typical peaks obtained for different cable preloads is shown in Figure 3.10.
Force sensor Latch
Shaker (sine wave sweep)
Mock bay side
Laser rangefinder
y z
Figure 3.9: Mock bay (side view) with vibration testing equipment.
50 100
214 N
50 100
Frequency (Hz) 188 N
50 100
187 N
179 N 178 N
Displacemen
t/F
orce
176 N
156 N 130 N
[image:47.612.172.464.92.451.2]125 N
Figure 3.10: Resonance peaks of nine experimental data points. The vertical axis uses a log scale. Peak values used for the fit are highlighted with vertical lines.
y= |F(x)|
|F(F)| (3.7)
fpeak =
P
iy
2
ifi
P
iy
2
i
(3.8)
whereF denotes the FFT,xis the displacement output by the laser displacement sensor,Fis the force as reported by the dynamic force sensor,yiis the ratio of displacement to force at frequencyfi,
andfpeak is the calculated peak location. The values found with this weighting procedure differed
3.2.1.2 Results
The peak locations were used to identify a quadratic polynomial that relates the cable tensionTmean
to the resonant frequency of a sidefpeak. The polynomial, by least-squares fitting, is
Tmean= 0.0362fpeak2 −0.2396fpeak−4.5611 (3.9)
forT in N andf in Hz. The root mean squared deviation, calculated aspP(Tmeas.−Tcalc.)2/(9−3)
for the nine data points and three fit parameters of Figure 3.10, was 1.5 N.
Fit curve Data points T
mean T1-4
60 65 70 75 80 85
120 130 140 150 160 170 180 190 200 210 220
Resonant frequency (Hz)
Av
erage
cable
tension
(N)
60 65 70 75 80 85
120 130 140 150 160 170 180 190 200 210 220
Resonant frequency (Hz)
Av
erage
cable
tension
(N)
[image:48.612.107.537.255.523.2](a) (b)
Figure 3.11: Data for empirical fit for the vibration method. Plot (a) shows the data points and the empirical fit of Equation 3.9; (b) shows the same averaged tensions with the four constituent tensions.
This method characterizes the average tension in the four cables that meet at the latch. By deliberately adjusting the rig such that T1 6=T2, we can affirm that this is the measured quantity.
3.2.2
In situ measurements of cable preload
Armed with the empirical relationship between resonant frequency and cable tension, the cable tensions of an actual mast can be collected. This is the data that should be reflected in the finite element model of the mast, and is ultimately encoded as a mean and variance in the unstretched lengths of the cables.
3.2.2.1 Experiment
A four-bay subsection of the WSOA mast was bolted by the pre-existing threaded holes in its base joints to a 1/2-in-thick aluminum plate, which was in turn bolted to a granite table, as shown in Figure 3.12. The four bays were numbered 1-4 from bottom to top, and the faces lettered counterclockwise as A, B, C, and D. Different bays’ faces were excited and observed by adjusting the height of the shaker and laser, and different faces of the same bay were accessed by unbolting the aluminum baseplate rotating it 90◦, and reattaching it.
[image:49.612.152.497.440.698.2]The shaker was suspended by a cotton rope approximately 64 cm below a horizontal bar sup-ported by an adjustable-height stand. To measure bay 4, the rope was shortened so that the pendulum arm length was approximately 44 cm, because the stand could not be adjusted to the height of this bay. The force sensor was connected to the approximate center of the latch with wax, and the shaker was able to push and pull on the latch through this connection.
The shaker was run though a logarithmically distributed sine sweep from 50 to 100 Hz over periods ranging from 300 to 500 s for each data point.
As a brief investigation of the effect of load history on cable tension, a simple load was applied between two vibration tests of a single side of the bottom bay. The mast was loaded with a shear of approximately 90 N at its tip, in the ±xand ±y directions. The tension in the cables on the measured face did not measurably change after any of these transient loads. This supports the assertion that we have measured a fundamental property of this particular mast, rather than a highly variable or transient property.
3.2.2.2 Results
Resonant frequencies of sixteen total bay sides range from 60 to 100 Hz, corresponding to average diagonal tensions of 132-331 N. A set of typical results is shown in Figure 3.13.
60 80 100
60 80 100
f (Hz)
60 80 100
60 80 100
Displacemen
t/F
orce
Figure 3.13: Four representative sweeps of Bay 2, Side A. The weighted peak is located at the vertical grey line. When all twelve samples are included, the standard deviation of weighted peak locations is 7.3 N, while the standard deviation of the simple maximum peak locations is 11.7 N.
Table 3.2: Summary of face resonant frequency data from the four sides of four bays of WSOA.n
denotes the number of trials; whennis given as (a)b, there wereatrials of whichbproduced usable data.
Side A Side B Side C Side D
n T (N) n T (N) n T (N) n T (N) Bay 1 15 233.4±5.3 (3) 2 238.5±3.1 25 274.7±7.2 2 221.4±0.1 Bay 2 12 244.1±7.3 2 235.2±2.0 8 318.6±4.4 2 177.1±0.004 Bay 3 2 220.7±2.6 2 205.3±0.9 8 234.5±3.0 2 205.5±0.7 Bay 4 1 186.4 2 187.2±0.3 5 132.7±4.2 2 170.0±0.2
While these frequencies are only reproducible to a standard deviation of a couple of Hertz, they differ from one another from fives or even tens of Hertz (standard deviation of the 16 meanfs was 8.4 Hz), and therefore some variability in cable pretension between faces and bays is established. The average standard deviation of measurements within a single side was 6 N, while the standard deviation of the sixteen mean measurements was 47 N, as illustrated in Figure 3.14.
100 150 200 250 300 350
0 1 2 3 4 5
Cable tension (N)
Num
b
er
of
sides
Figure 3.14: Histogram of sixteen face preloads. The overlaid curve is the normal distribution with the same mean and standard deviation.
3.3
Latch and cable behavior
The most complex subsystem of the mast is the latching mechanism located at the center of each cable assembly. This is one of the least stiff parts of the mast, and demonstrates behavior that is nonlinear, hysteretic, and nonrepeatable on the micron level. The latch experiments were designed to isolate the latch so that the data would be useful in parametric studies, and at the same time maintained a geometry and external load levels similar to a latch in use.
Ultimately, the most important outcome of the latch studies is the constitutive relationship between the position of the bead (which is fixed on cable A-B) and the force applied to the bead. This force is assumed to be equivalent to ∆T =TB−TA. In Section 5.2.2, a method for integrating
this data into a finite element model is presented.
3.3.1
Stiffness of cables
The stiffness of the cables was measured using an Instron (model 5569) material testing machine. Using fittings that bolted together to hold the cable terminating beads, the ends of cables A and C of one bay face were connected to the testing machine and stretched and released at a rate of 0.6×10⁻⁵strain/s, or 0.1 mm/minute. The results of this test are shown in Figure 3.15.
Experimental data Fit lines
-0.5 0 0.5 1 1.5 2 2.5 3 3.5 4
×10−3 0
20 40 60 80 100 120 140 160 180
Strain
T
ension
[image:52.612.199.437.422.631.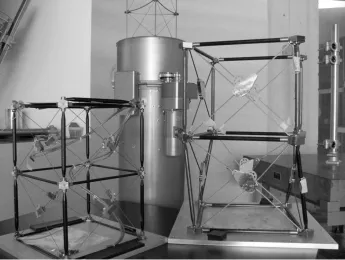
![Figure 2.7: Top view of the completely stowed NuSTAR mast in its deployment canister (NASAimage [5])](https://thumb-us.123doks.com/thumbv2/123dok_us/17255.1277/30.612.122.451.84.344/figure-view-completely-stowed-nustar-deployment-canister-nasaimage.webp)