Abstract:A plant is the heart of an agricultural field and it improves source of energy as well as financial income. We discuss several types of leaf diseases in the plants and their identification process, symptoms of disease and remedy measures are explained. There is a huge source of plants, but due to the effect of environmental condition or as weather, climate change, many non-native diseases occur on plants and cause social, ecological and financial losses. Many of the farmers are unable to recognize new disease. So the farmer needs an expert person who recognizes the disease and symptoms appearing on the plants, this will increase the cost of farming. To reduce farming, we introduce Android Application which diagnosis and identify the type of disease and symptoms of disease on plant leaves. The Android application performs basic operations like color transformation, thresholding and edge detection. Our system work on such plant leaves which are affected by many diseases that is a virus, fungi, excess of nutrients and insects, etc.We use image processing to detect and classify these diseases. Implement image processing operation on an android mobile device. It identifies the actual type of disease and its symptoms. Finally, using SVM-GA classifier to diagnosis the cotton leaf disease. Using Android Application type of disease, symptoms, remedy measures and recovery suggestions are given at a very less time and low cost.
Index Terms:Android application, Image processing-Scaling process, Binarization, Edge detection-canny edge detector.
I. INTRODUCTION
Agriculture plays an essential role in the process of economic development. It is the cultivation of plants, animals, fungi and other vital structures for fiber, food, medicines and other products used to sustain and improve human life. Agriculture was the key evolution in the emergence of secondary human civilization. It represents one third of the gross domestic product (GDP) [27-31]. India is an agricultural country and about 70% of the population depends on agriculture. In this article, we present a brief description of various types of leaf diseases and their identification techniques. The proposed work focused mainly on cotton diseases and their symptoms. India is the second largest cotton producer in the world.Cotton growing in this country is around 9 states. The total production of the cotton
Revised Manuscript Received on July 09, 2019
N.R. Deepa, Assistant Professor, Department of CSE, Coimbatore Institute of Engineering and Technology, Coimbatore, Tamil Nadu, India.
Dr.N. Nagarajan, Principal, Coimbatore Institute of Engineering and Technology, Coimbatore, Tamil Nadu, India.
Dr.D. Palanivel Rajan, Professor, Dept. of CSE, C M R Engineering College, Hyderabad, Telangana, India.
R. Balamurali, Associate Professor, Chennai institute of technology, Chennai, India
in 2014-2015 crossed the mark of 400 lakhs Bales.Disease on cotton is a major problem in reducing cotton productivity. About 70% to 80% of the disease on cotton is found on its leaves. Through image processing and diagnosis using android applications, research on cotton leaf diseases can be strongly studied.Today in the world technology is essential to have such type of an android application gives a result at very less time and effectively with low cost [1]. So our paper aims to give a detailed description of leaf disease identification. By analyze and identify a leaf shape is a major problem. The purpose of this article is to focus on plant leaf disease detection based on image processing using an android application.In our proposed work we develop an Android application through which user can identify plant species based on photos of plant leaf captured by mobile phone and image species define which type of disease it is, how to recover or how to prevent by infection or viruses or high level nutrients of such diseases for normal growth and maintain quality and higher level production in market. Disease management/Detecting leaf disease is a challenging task in image processing. Most diseases are seen on the leaves or stems of the plant. Cotton is called as “White Gold” or the “King of fibers”. It provides livelihoods for approximately 60 million people and is a major crop that provides substantial income to millions of farmers in both developed and developing countries. Cotton is a warm crop that requires regular water supply, usually in the form of rain or from a canal on the upper surface and / or groundwater source. To maintain growth and balance between the vegetative growth phase and the reproductive phase, a regular supply of water is required. About 55% of the world's cotton surface is under irrigation, and the rest is rainwater irrigation [32-36].
Estimated Annual Losses worldwide due to diseases: Diseases-14.1%
Insects -10.2% Weeds -12.2%
Types of Leaf Diseases
Generally, two types of disease infect the cotton leaf. First one is Biotic Diseases (Parasitic or infectious diseases) and the second one is A-Biotic Diseases (Non-Parasitic or non-infectious diseases). Biotic diseases are caused by living organisms (infectious) like bacteria, viruses, fungi, nematodes, insects, mites, rodents, birds and other animals. A-biotic diseases are caused by non-living organisms (non-infectious),
Image Processing System for Detecting and
Recovering from Cotton Leaf Disease using The
Android Application
such as low/high temperature or moisture, Deficiencies/Excess of nutrients, lightening injury, injurious atmospheric gases, etc. A-biotic damage occurs in many plant species and does not spread from plant to plant over time and also can’t show the presence of disease signs. But in biotic damage can spread out one plant to another plant. So this problem is limited in certain species. Biotic diseases have physical signs of the pathogen, such as fungal growth, bacterial mud and insects.
General Symptoms of diseases:
Blight- Quick discoloration, decease of twigs and foliage (or) flowers.
Canker - Dead area of bark or stem, often sunken or raised. Chlorosis -Yellowing the plant leaves.
Decline - Plant vitality is gradually decreasing.
Dieback - The branches from the tip, the roots or branches gradually die.
Distortion - Distorted tissues in plant.
Gall - The plant is abnormally swollen or enlarged. Gummosis - Exudation of gum or sap.
Leaf Distortion - The leaves can be twisted, cupped, rotated or otherwise deformed.
Leaf scorch - Burn along the edge of the leaf and enter the leaves from the edge.
Leaf spot - A spot on the leaf.
Mosaic - Dark plant tissue and varying patterns of light. Necrosis - Dead tissue - necrotic areas are also versatile and no further detail diagnosis is possible.
Stunting - Deficiency of growth. Wilt - Common wilting of the plant.
[image:2.595.308.546.52.222.2]Witches broom -An abnormal broom is like the growth of many weak slots.
[image:2.595.36.294.164.750.2]Fig 1: Symptoms of Bacterial Diseases.
Fig 2: Symptoms of Fungi Diseases.
Fig 3: Nutritional Deficiency in Plants.
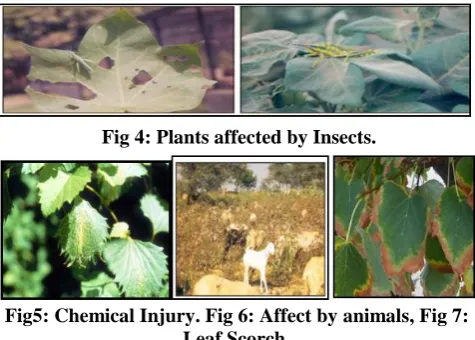
Fig 4: Plants affected by Insects.
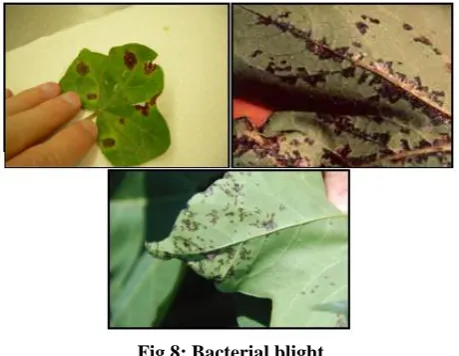
Fig5: Chemical Injury. Fig 6: Affect by animals, Fig 7: Leaf Scorch.
This article is systematically divided into the following sections. Section 2 highlights recent work in this area. Section 3 covers various diseases and their remedies. Section 4 highlights the proposed method for leaf disease detection, which represents more comments on various image processing techniques. Section 5 gives the results and discussion of our proposed work. Finally, Section 6 summarizes this article and the possible fate direction
II. RELATEDWORK
species of plants. The algorithm is very useful in properly classifying species contained in the training library [19].The application of digital image processing techniques for the detection, quantification and classification of plant diseases from digital images in the visible spectrum. Although a disease symptom can manifest in any part of the plant [3]. Ajay. A, et al. (2012) discuss the possibility of disease testing for cotton leaf disease. First, we can identify three types of diseases on the leaves of cotton by the method of self-characteristic regulation and extraction.In [4] Android-based application is used. That will determine the level of nitrogen efficiency of rice. This approach can overcome the color blindness and color perception using LCC method (Leaf Color Chart). Finally testing accuracy is based on the corresponding results based on the android application.
P. Revathi, M. Hemalatha discovered cotton leaf spot diseases in [25] using edge segmentation techniques based on homogeneous segmentation. This system is studied with eight types of cotton leaf diseases, which are Fusaria wilt, Verticillium wilt, Root rot, Boll rot, Gray molds, Foliar rot, Bacterial rot and Leaf curls. In this work, the symptoms of cotton leaf stain images are detected mobile and classified using a neural network.Proposed research work will describe the technique “Recognition of leaf spot diseases”. In this system observing large fields of crops and discover the symptoms of diseases. Each and every disease can be identified by homogenization techniques and solely, canny using edge detection to identify the affected parts of the leaf spot. Authors Bed Prakash, Amit Yerpude[5] and paper[10] deals with “identification leaf disease” using the Probabilistic Neural Network. This paper presents the survey on various types of leaf diseases in plants and their identification process. PNN is much faster and more accurate than other identification techniques like genetic algorithm, Back Propagation Neural Network, Principal component analysis and so on. Soy bean is a very important harvesting mechanism, but for different reasons such as diseases, pests and sudden changes in weather conditions. [13] This article examines the visual symptoms of a particular disease by segmentation. The phenomenon of image segmentation uses Sobel filters, Canny edge detectors, Prewitt filters and K-means clustering techniques. Once identified the disease, corrective measures can be taken to remove or reduce the problem[15]. This article has made a strive to study the need of an electronic expert system (android app) which help farmers to take proper decisions and improve their agriculture experience without suffering from heavy losses [17]. R. Preethi et al. [9] has developed the system to detect and classify all major diseases by scaling the thresholds. The threshold differs for each disease according to its characteristics and the area of the affected areas. Renuka Rajendra Kajale et al. [16] describe the approach to the observation and calculation of texture information in foliar diseases.The processing system consists of four main steps, color image is changed to HSV, then the green pixels are masked and removed using specific threshold value and then preprocessed image is segmented. Segments are extracted using edge detection technique. Finally, the texture information is acquired. The diseases present on the plant leaf are evaluated based on the texture information. Atul Shire et
al [23] survey on plant leaf disease using image processing technique. Histogram equalization [11] is used to enhance the images this technique is used under image enhancement technique. It provides clear image to human eyes. So these types of diseases can be recognized on the plant leaves. But Vinita et al [21] discussed the plant diseases using Histogram technique. But in this paper canny edge detection algorithm is used. This approach plots the strong edges of healthy and infected plant. Dheeb et al [24] discussed detection and classification of leaf Diseases using K-means –based Segmentation and Neural –networks based classification. This paper focused on detecting and classifying leaf diseases using image processing technique. It will give the software solution for detecting plant diseases. [12]
One of the most important techniques in image segmentation is Edge detection technique. It divides thephoto into its subareas or sub-objects. Image segmentation must fragment the object from the background to properly read the image and carefully identify the image edge using the erroneous edge detection mechanism. But this paper reduces amount of data when filters out the leaves image and cropping images. [14] In this paper application of texture statistics for detecting the plant leaf disease has been explained. [18] Automatic detection of plant disease is a very important research topic in agricultural field. This paper proposed E-Agriculture analysis for grading plant diseases. Diagnosis plant leaf diseases using Back propagation using neural network in paper [22]. But Vinita et al [21] analyses and reviews image processing techniques for numerous plant species that have been used for identifying plant diseases. The major techniques for detection of plant diseases are: BPNN (Back propagation Neural Network), SVM (Support Vector Machine), k-means clustering and fuzzy logic. These techniques are used to examine the healthy and diseased plants leaf.
III. VARIOUSTYPESOFDISEASES
The diseases on the cotton leaves are classified as given below:
1) Bacterial Disease:
Bacterial blight: Xantomonascampestis. Crown gall: Agrobacteriumtumefaciens.
Lint degradation: ErwiniaherbicolaPantoeaagglo. 2)Fungal Disease:
Anthracnose: Glomerellagossypii. Areolate mildew: Ramulariagossypii, Cercosporellagossypii.
Ascochytablight: Ascochytagossypii. Black root rot: Thielaviopsisbasicola, Chalaraelegans.
Boll rot: AscochytagossypiiWoronichin. Charcoal rot: Macrophominaphaseolina. Leafspot: Alternariamacrospora. Lint contamination: Aspergillusflavus. Phymatotrichum root rot: cotton root rot, Phymatotrichopsisomnivore.
Stem canker: Phomaexigua. Verticilliumwilt: Verticilliumdahlia. 3) Viral Diseases:
Abutilon mosaic:
Blue disease: phytoplasma.
Leaf crumple: Genus Bigeminivirus, Cotton leaf curl virus (CLCuV). 4) Nematodes diseases:
Lance: Columbia nematode, HoplolaimusColumbus.
Root-knot nematode: Meloidogyne incognita. Sting nematode: Belonolaimuslongicaudatus.
5) Other Problem Causing Diseases: Due to insects, Nutrients inefficiency, weather condition etc.
We go through the particular type of diseases on the cotton leaves.
Bacterial disease:
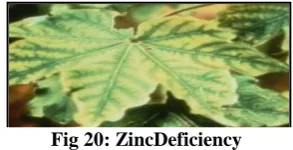
[image:4.595.308.544.49.216.2]Bacterial blight of cotton: Affecting cotton plant from infection by Xanthomonascampestiscitric.This bacterium can affect the cotton plant during all growth stages, affecting stems, leaves, bracts and bolls. The spot diameter is increased 3 mm to 5 mm.
Fig 8: Bacterial blight Symptoms of Bacterial Diseases:
The water immersion points on the leaves are separated by veins and have an angular appearance. The lesions are enlarged, blackened, necrotic, and the leaves fall from the plants. The disease may also cause enlarged gray-black lesions extending from the leaves to the petiole and stem. This is called the "black arm" stage; the acute black arm indication may cause the stem to wrap; the cotton boll may have a water immersion lesion; the cotton boll lesion expands and becomes hollow and brownish black.
Fungal disease:
[image:4.595.53.283.277.455.2]Several species of fungus can cause seedling diseases, but the main active ingredients are Pythium spp, Rhizoctoniasolani, Phomaexigua (Asochyta) and Fusarium spp. These pathogenic organisms can attack the seed from germination. Plant-parasitic nematodes will generally increase the ability of these fungi to cause disease. The fungus can also attack the seedlings before emergence, and partially or completely strip the seedling stems and seedling roots. Seed and seedling diseases are characterized by soft water rot.
Fig 9: Fungal diseases-Asochytablight, Asochytagossypii Symptoms of Fungal Diseases:
The Cercospora leaf spot fungus Cercospora round red lesion on the leaf, swells in the middle and turns white or gray; the lesion usually has a pattern of concentric rings and red borders. Dark gray spores are formed in the center of the lesion to make them appear dark gray. Asochyta mushroom Asochytagossypii - brown or gray spots on the leaves, surrounded by a red halo; long crabs on the stem cause the leaves to wither and die. Alternaria leaf spot fungus Alterneriamacrospora - small round brown lesions on cotyledons and seedling leaves that expand and form a concentric pattern; necrotic areas merge, usually with purple borders; the core of the lesion may dry out and fall out of the plant, Form a "bullet hole" on the leaf.
Verticillium Wilt:Verticillium wilt, caused by the soil fungus Verticillium dahliae, is the most economically important disease in the region. The fungus infects plants at the beginning of the season through the roots, grows through the vascular system and finally blocks the xylem elements. As a result, plants display severe wilting symptoms during flowering as the water requirements of the plants increase. The vascular discoloration (or tanning) extends over the entire trunk and into the petioles. Plants rarely wither, but can become immature at the end of the season. The leaves develop at the edges and between the veins a typical yellow blotchiness. The lower leaves are usually affected first, and then other leaves may be affected. The leaf margins form dead tissue, which can replace the patchy areas.
[image:4.595.310.548.596.842.2]Symptoms of Verticillium Wilt:
The symptoms occur when the harvest is in squares and bulbs. Early infested plants are severely stunted. The first symptoms can be seen as bronze of veins. This is followed by intervening chlorosis and yellowing of the leaves. Finally, the leaves begin to dry, resulting in a burned appearance. At this time, the characteristic diagnostic feature is the drying out of the leaf margins and the areas between the veins, giving an appearance. The affected leaves fall off and leave the branches barren. Infected stems and roots, when split, show a pinkish discoloration of the wood tissue, which can be rejuvenated in longitudinal stripes in the upper parts and branches. The affected leaf also shows brown spots at the end of the petioles. The affected plants may carry some smaller capsules with immature lint.
Nematodes:
[image:5.595.310.543.106.276.2]All nematodes that cause plant diseases are very small (0.5 to 0.75 mm), colorless nematodes. Most of these nematodes live in the soil and feed on the roots of plants. Some plant parasitic nematodes live on branches and leaves. Some nematodes can also be used as carriers of viral plant diseases, such as tobacco ring staining and tomato ring staining. These viruses are commonly found in perennial herbaceous plants and cause signs of depression, shortening, ring spots, and leaf inlays.
Fig 11: Symptoms of nematodes and Root –knot Symptoms of Nematodes:
Root connection: The Meloidogyne Incognita-Cotton crop will be affected. Use a tolerant variety. Tolerance variants and nematicides are used. Use non-host investigations to implement crop rotations. Lance (Hoplolaimus Columbus) - Nematicides may be beneficial. Cotton harvest is damaged. Use nematicide. Use a non-host to implement a crop rotation. Rotylenchulusreniformis - This number of nematodes can cause damage. Correct pH, fertility or hard shell conditions. Nematicides may be beneficial. Cotton harvest is damaged. Use nematicide. Use a non-host to implement a crop rotation. Aphids (Belonolaimuslongicaudatus) - Cotton crops may be affected. Use nematicide. Use a non-host to implement a crop rotation.
Viral Diseases:
The Cotton Leaf Curl Gemini Virus (CLCuV) causes a vital disease of cotton in Asia and Africa [2] [3] [4]. The leaves of the affected cotton curl upwards Fig. 3 and carry leaf-like inclusions on the underside, along with a thickening of the
vein. In recent years, severe CLCuV epidemics have occurred in Pakistan, with yield losses of up to 100% in areas where the infection occurred at the beginning of the growing season.
Fig 12: Cotton leaf curl Gemini virus (CLcuV) Symptoms of Viral Diseases:
The leaves of the affected plants are small, cupped and wrinkled. Leaf veins are distorted and thickened. Plants that were infected at a young age are stunted.
Nutrient Deficiency: Sulfur and Boron:
The most restrictive nutrients for cotton production are nitrogen, potassium and phosphorus. However, fertilization with sulfur (S) and boron (B) is important on many delta soils to achieve the best yields of cotton fluff. Sulfur is needed by cotton plants to produce amino acids needed to make proteins and enzymes. About 3 percent of the plant tissue consists of sulfur. Boron is studied as a micronutrient because it is a cell wall constituent and accounts for only 0.2 percent of the plant material. Many farmers have no soil test from their fields that has been tested for sulfur or boron. One reason for this is that most soil testing laboratories do not include the elements in their standard analysis.
Fig 13:Nutreints deficiency in sulfur and boron Potassium:
[image:5.595.68.276.372.529.2]Fig 14: Potassium deficiency Nitrogen:
[image:6.595.355.497.108.200.2]Nitrogen is one of the main nutrients for plants. It is contained in the chlorophyll of the leaves and is used to convert solar energy into carbohydrates that provide the harvest with energy. It is also responsible for the return on investment. Excess nitrogen can delay ripeness, cause overgrowth, reduce fiber retention, compromise fiber quality, increase pest control, and contaminate groundwater and surface water.
Fig 15: Nitrogen Deficiency Calcium:
[image:6.595.52.285.274.356.2]Calcium is needed in the plant cell to favorably affect the enzyme action and to cement the cell walls in the form of calcium pectate, particularly at the growth points of roots and shoots at which cell division and elongation take place. Cotton is known to be a series calcium storage for the synthesis of organic acid compounds in the plant.
Fig 16: Calcium Deficiency Iron (Fe):
Iron deficiency may be visible if the leaf veins remain a little green, while the top leaves are chlorotic and bleached, as iron can not be easily transferred from older to younger tissues.
Fig 17: Iron Deficiency
Manganese:
Manganese is needed in minimum quantities for the best cotton production. It is related to the movement of iron in the plant, which in turn helps in the combination of chlorophyll. On strongly acidic soils below pH 5.2, manganese may be present. The leaves can be visibly curled and hollow and have inhibited growth, sometimes referred to as a "crease leaf". It
[image:6.595.360.495.280.362.2]can be confused with thrombosis and must be confirmed by both soil and plant analysis. Limiting the pH from 5.8 to 6.5 reduces manganese availability and increases the availability of P, which can help reduce the environmental impact of manganese.
Fig 18:Magnese deficiency Phosphorus:
[image:6.595.353.500.428.503.2]Phosphorus is a necessary macro nutrient element in plantleaves, required for energy transfer. Excess of nutrients, totally affects the cotton leaves. A shortage of Phosphorus will lead to a breakdown of plant.
Fig 19:Phosphorus deficiency Zinc:
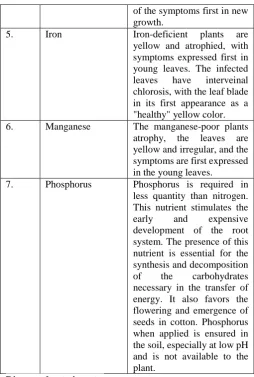
Zinc deficiency has become a limiting factor in crop production It appears in the younger leaves in the upper canopy its translocated from older leaves to younger leaves.
Fig 20: ZincDeficiency
Table 1:Name of the Nutrients Deficiency and its Symptoms
S.No Name of the Nutrient Deficiency
Symptoms
1. Sulfur and Boron Similar to symptons in
nitrogen deficiency.
2. Potassium The maximum consumption
of potassium in cotton is carried out during the third to fourth week of flowering. It can be serious in early maturation, varieties of rapid fruiting.
3. Nitrogen The size of the leaf is
reduced and the number of knots of the fruit is also reduced.
4. Calcium Calcium deficient plants are
atrophied, with distorted leaves, hollowed out and
interveinal chlorosis
[image:6.595.97.241.452.536.2] [image:6.595.297.557.532.831.2] [image:6.595.298.556.535.831.2]of the symptoms first in new growth.
5. Iron Iron-deficient plants are
yellow and atrophied, with symptoms expressed first in young leaves. The infected leaves have interveinal chlorosis, with the leaf blade in its first appearance as a "healthy" yellow color.
6. Manganese The manganese-poor plants
atrophy, the leaves are yellow and irregular, and the symptoms are first expressed in the young leaves.
7. Phosphorus Phosphorus is required in
less quantity than nitrogen. This nutrient stimulates the
early and expensive
development of the root system. The presence of this nutrient is essential for the synthesis and decomposition
of the carbohydrates
necessary in the transfer of energy. It also favors the flowering and emergence of seeds in cotton. Phosphorus when applied is ensured in the soil, especially at low pH and is not available to the plant.
Diseases due to insects:
[image:7.595.41.296.46.424.2]Whitefly:Bemisiatabaci. It is important sucking insect pest of cotton crop.
Fig 21: Disease due to whitefly insects Symptoms:
Chlorotic spots on the leaves that then come together to form an irregular and yellowish tissue of the leaf that extends from the veins to the outer edges, severe infestation results in premature defoliation, mold development, bud break and capsules and a bad opening of the capsule. It also transfers diseases of cotton leaf curl virus.
Generalcareandmaintenance mechanism for cotton leaves:
Cotton fields should be kept away from weeds and additional irrigation should be provided if there is not enough water to pass through the rain. Nutritional needs depend on the type of soil in which the cotton grows. Cotton grows in acidic soils, and plants have higher demand for nitrogen and phosphorus, while in sandy soils, potassium is more important. It is not recommended to germinate cotton in the same field for more than three years. Harvest should be harvested to prevent leaf disease (cotton leaves) in the soil.
Remedy Measurement for Various types of diseases
Bacterial diseases: Lint degradation:
Plow crop residues and use good field sanitation. The elimination of wild weeds of cucurbits is important because they can serve as sources of inocula. Good control of cucumber beetle vectors is a must.
Fungus diseases:
Verticilliumwilt:The continuous sowing of cotton increases the presence of the wilting organism in the soil. The fall or rotation of non-host summer crops such as sorghum, Sudan grass, corn or winter rotation with small grains materializes to decrease the incidence of the disease in certain places. Cultural practices that promote early maturity or the use of early-season or short-season growers may reduce the incidence of the disease. Avoid excessive use of nitrogen and irrigation. The fungus can be unrolled on the ground, by the equipment and in the garbage of the gin. No practical methods of chemical control are known.
Anthracnose:The disease organism survives in infected fields in crop residue, so crop rotation is important. Several genetically resistant diversities of cucumber and watermelon are available. A preventative spray program may be required for effective control.
Cercosporacitrullina: Use good hygiene practices to reduce the rest time of previous crops in a timely manner. Crop rotation and biocide spray procedures may be required.
Nutrients deficiency Diseases:
Calcium Deficiency:Soil and/or foliar nutrition analysis was performed to confirm that the problem was nutrition. Follow the recommended fertility application using balanced fertilizers; indicate leaching before planting. Treatment with chelated CA can be used in greenhouse conditions.
Iron Deficiency:Do a soil and / or foliar nutrient analysis to confirm that it is a nutritional problem. Follow the recommended fertility methods with a well-balanced fertilizer. High pH soils often lead to iron deficiency by keeping the iron in insoluble form. Powdered sulfur applications can be used in small areas to lower the pH. For the spray application a number of chelated iron compounds are available.
Manganese Deficiency:Conduct a soil and / or foliar nutrient analysis to confirm that the problem is diet-related. Follow the recommended fertility treatments with a well-balanced fertilizer. High pH soils often cause manganese deficiency by keeping manganese in insoluble form.
Nitrogen Deficiency: Conduct soil and/or foliar nutrient analysis to confirm that the problem is nutritional.
Potassium Deficiency:Perform analysis of the soil and / or foliar nutrients to confirm that the problem is nutritional. Follow the recommended applications for fertility using a balanced fertilizer and treat the alkalinity or acidity as necessary.
Sulfur/Boron Deficiency:Apply sulfur containing compounds only during moderate temperatures and follow label recommendations carefully.
Diseases due to insects:
recommended dose of insecticide (with 2 ml / l water)
Neem seed kernel extract 5% (50kg),Neem oil at 5ml/l of water.
Fish oil rosin@25mg/lit
Catharanthusrosea extract 5%
Sprinkle any one provided below in early stage (5001 of spray fluid/ha)
Phosphamidon 40 SL 600 ml/ha or Methyl demeton 25 EC 500 ml.
Sprinkle any one provided below in mid and late stages (1000 1 spray ligud/ha)
Phoslane 35 EC at 2.5 1/ha
Triazophos 40 EC 2.0 1/ha
Acephate 75SP 1.30 kg/ha.
Quinalphos 25 EC at 2.0 1/ha
IV. PROPOSEDAPPROACHFORDETECTIONAND
CLASSIFICATIONOFLEAFDISEASES Initially, digital images are acquired from the circumstances using a mobile digital camera. Then, the image preprocessing techniques are applied to the images obtained in the scale (Change image size). Extract the RGB pixel count functions that are necessary for further analysis.After that, convert the color values in RGB to the space specified in the color transformation. Calculate the threshold value for mask green pixel and remove using thresholding technique. A diseased spot of leaf edges detecting using the canny edge detector.After that, some analytical perceptive techniques are used to classify the images according to the specific problem. 4.1 System Implementation
We develop an Android application System, which enables a farmer to capture the images of the infected plant leaf using mobile phone and picture of images based on visual symptoms using image processing algorithms to measure the type of diseases. A panel of experts will report on the status of the data analysis and analysis report, and submit to the proposals for recovery and prevention measures, which will be communicated to the farmer as notification in the application.
A. Android Application Development
The android mobile application development consists of following functionalities are as follows:
Capture the image using a mobile phone Then select the image
Image zoom and crop images Binary edge detection Classification
[image:8.595.321.531.56.278.2] Cotton leaf disease diagnosis
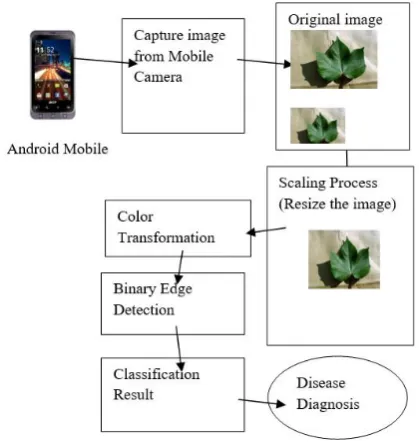
Fig 22: System Architecture System Algorithm
Step 1: Capture image from Mobile Camera. Step 2: Resize the images //Scaling Process.
Step 3: Convert image RGB into HSV image //Color transformation.
Step 4: Convert grayscale image into a binary image //Adaptive Thresholding.
Step 5: Apply the Canny Edge detection in the leaf images //Edge detection.
Step 6: Calculate the number of pixels and area of the images //Feature Extraction.
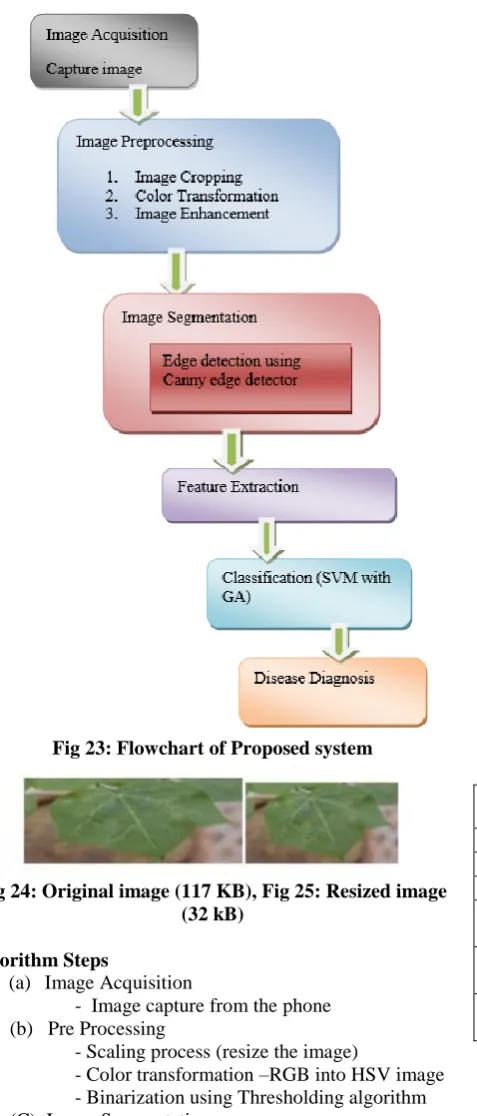
Fig 23: Flowchart of Proposed system
Fig 24: Original image (117 KB), Fig 25: Resized image (32 kB)
Algorithm Steps
(a) Image Acquisition
- Image capture from the phone (b) Pre Processing
- Scaling process (resize the image)
- Color transformation –RGB into HSV image - Binarization using Thresholding algorithm (C) Image Segmentation
- Edge detection using the canny edge detector (d) Feature Extraction
- Shape Extraction - Color Extraction (e) Classification
- Classifier- SVM with GA
(a) Image Acquisition:
Pictures of different sheets are taken with a mobile camera. Then, image processing techniques are applied to the captured images to remove the features used for analysis purposes.
(b)Image Preprocessing:
In the proposed system, there are three techniques for preprocessing:
(i) Resize of image- After acquisition the image. It can be resized.
(ii) Color Transformation- Any image is in the form of its RGB that is Red, Green, and Blue Coordinates. The proposed system used to convert RGB into Hue, Saturation, Value color space representation which is ideal for color perception.
(iii)Binary image - Image binarize using a thresholding algorithm
(i)Scaling Process (resize the image):
Scaling is the process of changing the size of an image. When we want to use an image, it is too large to use it to cause memory problems on the device. The solution to the problem is to resize the image and scale the Image. There are two ways to scale an image to make it larger or smaller. By growing the image, some new pixels are constructed by interpolation. In android for images, scaling will evaluate the height of the three factors, the width of the image, and the resolution of the image it measures in the DPI. DPI is "dots per inch". In android it evaluates the definition of image properties:
Resolution = number of pixels accessible on the display, scaling independent pixels = sp.
Density = how many pixels appear in a constant area of the display, dots per inch = dpi.
Size = the size of the physical space available for displaying a user interface, screen size, inches.
Density Independent Pixel = virtual pixel independent of screen density, dp.
Table 2: Various Density Classes in Android
Class Name Density Factor
Ldpi Low Density 120 dpi sp = ¾ * dp
Mdpi Medium Density 160 dpi sp = dp
Hdpi High Density 240 dpi sp = 1.5 x dp
XHdpi Extra High
Density
320 dpi sp = 2 x dp
XXHdpi Extra Extra High Density
480 dpi sp = 3 x dp
XXXHdpi Extra ExtraExtra High Density
640 dpi sp = 4 x dp
(ii) Color Transformation:
Colored objects in an image can be easily described by their hue, saturation and brightness. The HSV model decouples the intensity components of the color-bearing information in the color image. This model is an ideal tool for developing color image processing algorithms. Hue, saturation and value images can be obtained from RGB color images. We can change each RGB point to the corresponding point in the HSV color model by computing the geometric formula. The images on the mobile phone are averaged for each hue, saturation, and value, and these features are extracted using this method and the output is preserved at the same time.
HSV model:
dependent on the device and is based on the perception of human color. In this color model, "H" indicates a tone, which describes a pure color and is generally associated with the wavelength of light. "S" designates the saturation, which measures the "color" in the HSV color model. "V" indicates value.
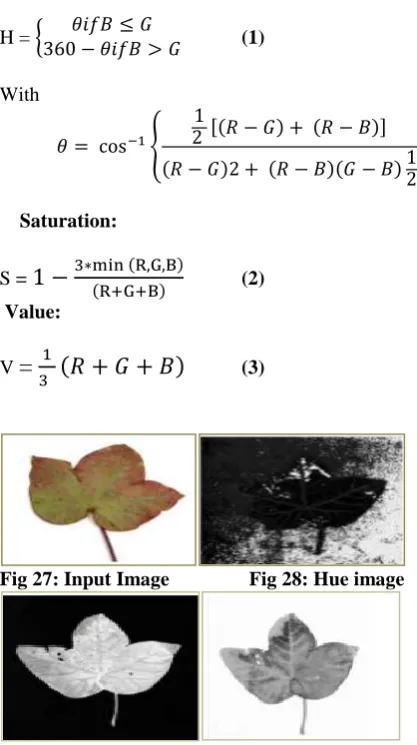
Hue:
H =
(1)
With
Saturation:
S =
(2)
Value:
V
=
(3) [image:10.595.47.256.147.520.2]
Fig 27: Input Image Fig 28: Hue image
Fig 29: Saturation imageFig 30:Value image (iii) Binarization using Adaptive Thresholding:
After color conversion to HSV, a binary threshold is applied. Binary threshold function reduces a grayscale image intoa binary level image. Threshold method is used in this research is an Adaptive Thresholding algorithm. Thresholds extract pixels from an image that represent an object (either a script or other line image data such as graphics, maps). Although the information is binary, the pixels represent an intensity range. Each pixel in the image is automatically thresholded. If the pixel value is below the threshold, it is set to the background value. Otherwise, the foreground value is closed. In order to obtain an optimal threshold value for the adaptive threshold method, this can be observed as an optimization problem.
There are two main approaches to finding the threshold (i) Chow and Kaneko approach
(ii) Local thresholding
(i) Chow and Kaneko approach is not applicable for larger application. So in our proposed work we use a local thresholding algorithm.
(ii) Local Thresholding
A threshold T(x,y) is a value such that
(4)
Where B (x, y) is the binarized image and I (x, y) ≤ [0,1] is the intensity of a pixel at the position (x, y) of the image I. A threshold is calculated in the local adaptive technique. For each pixel, build on some local statistics such as: The range, variance or surface adjustment parameters of the adjacent pixels. Some disadvantages of local threshold techniques are domain size dependent, individual image characteristics, and time consuming. Therefore, some researchers use a compound approach that applies both global and local threshold methods, and some use morphological operators. Niblack, Sauvola and Pietaksinenuse, the local variable technique, while Bernsen uses the mean within the local block.
Niblack’s Technique
In this method local threshold value T(x,y) at (x,y) is deliberated within a window of size w × w was:
Where m (x, y) and δ (x, y) are the local mean and standard deviation of the pixels within the local window and k is a bias voltage. Set as k = 0.5. The local mean m (x, y) and the standard deviation δ (x, y) Adjust the value of the threshold according to the contrast in the local neighborhood of the pixel. The diagonal k controls the degree of adjustment that changes the threshold.
Fig 31:Input image Fig 32:Binary image (c) Image Segmentation
Image segmentation is used to separate images into different segments. It can also be used,
• Identify individual objects in the image
• Find connected pixel regions with similar properties • Find the boundaries between regions
• Delete unwanted areas
Edge Detection
[image:10.595.306.549.476.573.2]The points at which the brightness of the image changes abruptly are usually systematic in a series of curved line segments called edges. The same problem of detecting discontinuities over time is recognized as change detection. Edge detection is a basic tool for image processing, artificial vision, and computer visualization, especially in the areas of attribute disclosure and feature extraction.
Edge Detection techniques
Diverse colors have different brightness values of a particular color.Green image has brighter than the blue and red image or blue image is blurred and red image is the high noise image.
Following are lists of various edge-detection techniques:
Sobel Edge Detection. Roberts Edge Detection.
Zerocross Threshold Edge Detection. Perwitt edge Detection.
Canny edge Detection.
“Canny Edge Detection” is preferred due to thebenefits over other edge recognitionmethods.
Canny Edge Detector
The Canny Edge Detector is one of the most widely used image processing tools, paying attention to edges in a very robust way. This is a multi-step process that can be implemented as a series of filters on the GPU. Precision edge detection technology is based on three basic goals.
1. Low rate of error:
All boundaries should be recognized and there should be no false responses. In other words, the edges must be as close as possible to the real edges.
2. Edge point must be well localized:
The edges must be as close as possible to the edges. That is to say, the distance between the detector as a point of significant edge and the center of the real edge should be minimal.
3. Single edge point response:
For each true edge point, the detector should only return one point. That is, the number of local maxima of the entire real edge must be the smallest. This means that the detector should not recognize multiple edge pixels with a single edge point.
The essence of Canny's work is to express the first three criteria mathematically, and then try to find the optimal solution for these formulas. In general, it is difficult to find close results that satisfy all of the aforementioned goals. However, the numerical optimization of the 1-D step edge using additive Gaussian noise damage concludes that the good approximation of the optimal step edge detector is the first imitation of Gaussian:
=
(5)
Extending this result to 2-D involves identifying that the 1-D method still applies to the direction of the edge normal. Since the normal direction is not specified in advance, the 1-D edge detector needs to be applied in all possible directions. This task can be approached by first smoothing the image using a
circular 2-D Gaussian function and calculating the gradient of the result. To estimate the edge strength, we use the gradient magnitude at each point.
Let f(x, y) denotes the input image g (x, y) denote function:
(6)
We form a smoothed image (x, y), by convolving G and f:
(7)
This operation is followed by computing the gradient and direction (angle)
(8)
And
(9)
With
and
Equation (2) is implemented using an n x n Gauss mask. Remember that M(x,y) and a(x,y) are the same array size as their image. Because it is created using the gradient M(x,y), it usually contains a wide ridge around the local maximum. The following steps are to cut these ridges. One way is to use non-maximum suppression. This can be done in several ways, but the essence of the method is to identify no. The discrete direction of the edge normal (gradient vector). For example, in a 3×3 region, we can define four directions for the edges passing through the center point of the region: horizontal, vertical, +45º and -45º.
The last operation is the threshold g_(N)(x, y) to reduce the false edge points. We do this by using a single threshold, where all values under the threshold are set to 0. If we set the threshold too low, there will still be some false edges (called false positives). If the threshold id is too high, the actual effective edge point (false negative) will be eliminated. Canny's algorithm attempts to improve this by using a hysteresis threshold. We use two thresholds, the low threshold, T1 and the high threshold TH. Canny suggests that the ratio of thresholds should be two or three to one from high to low.
We visualize the thresholding operation as creating two additional images
(10)
(11)
Where initially both and are set to 0after thresholding will have fewer non-zero pixels than in general, but all the non-zero pixels in will be hold in .We eliminate from
all the non zero from by letting
- (12)
After the thresholding operations,all strong pixels in
are assumed to be valid edge pixels and so marked instantly.Depending on the value of TH,the edges in typically have gaps.
Longer edges are established using the following procedure.
(a)Locate the next unvisited pixel p in .
(b) Mark as valid edge pixels in that are connected to p using say 8 connectivity.
(c) If all non zero pixels in have been visited go to step d.Else return to step a.
(d) Set to zero all pixels in that were not marked as well founded edge pixels.
At the end of this procedure, the final image output by the Canny is formed by appending to all the non zero pixels from . We use two additional images, and to clarify the discussion. Inpractice, hysteresis threshold can be implemented directly on by forming a list of strong pixels and the weak connected to them.
Summarizing, the canny edge detection algorithm consists of the following basic steps:
i. Smooth the input image with Gaussian filter. ii. Compute the gradient magnitude and angle
images.
iii. Apply non-maxima extinction to the gradient magnitude image.
iv. Use doublethresholding and connectivity analysis to detect and link analysis.
The above figures show the example for edge detected diseases. Results are for three types of cotton leaves.
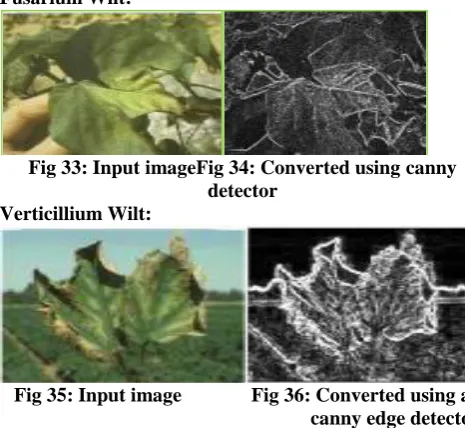
[image:12.595.305.543.49.153.2]Fusarium Wilt:
Fig 33: Input imageFig 34: Converted using canny detector
Verticillium Wilt:
Fig 35: Input image Fig 36: Converted using a canny edge detector
[image:12.595.47.280.465.679.2]Leaf Blight:
Fig 37: Input image Fig 38: Converted using a canny edge detector. The figure 33.Fusarium Wilt and Figure 34.Verticillium Wilt. Figures 35.Leaf Blight is shown after the disease are recognized.
(d) Feature Extraction:
Feature extraction is a dimensionality reduction technique that effectively represents the most informative part of an image. There are three main types of features, such as color, shape, and texture.
A. Color based Feature Extraction:
The color features are obtained by calculating the average (M) and standard deviation (SD) of the pixel intensities that produce the spots in the three classical planes; the red (R), green (G), and blue (B) of the segmented image. The global sampled average of an image is the average intensity of all pixels in the image.
Let A be an X × Y image, then its mean is given by:
(13)
Where ‘m’ is the mean.
Variance is the second moment of intensity about its mean and it’s given by
(14)
Standard deviation is the square root of the variance and is given by
(15)
B. Shape based Feature Extraction
Sharpness,Eigen values, Area, Perimeter and Aspect-ratio are computed as shape based features to detect the diseases. Area of an object is defined as the number of pixels comprising the object. So area can be enumerated by counting the object pixels.
The following shape features are extracted to classify the disease:
1) Area: It is the actual number of pixels in the region of interest.
[image:12.595.344.518.517.575.2]2) Number of Objects: It is the number of white pixels which are disconnected to each other in binary image.
(e) Classification:
It is the decision stage of image processing technology. It uses the extracted features as input to identify plant leaf disease. The performance of the system is highly dependent on the type of classifier used. Classification is typically done by comparing feature extraction inputs. This classifier requires a long training time. In SVM, it is difficult to understand the function (weight) of learning. A large number of support vectors for the training set are used to perform the classification task. To get good results, use genetic algorithms to train and test the SVM. Support Vector Machine (SVM) is the best of all machine learning algorithms. SVM uses an optimization algorithm by minimizing confusion, which will improve the accuracy of the classification.
(i) Genetic Algorithm
The procedure of image grouping that goes from maximum probability to neural networks hinge on on the vectors of characteristics maintained by the intensity values in each spectral channel for each pixel. But the spectral information alone is not enough to identify a pixel. The characteristics of your neighborhood, such as texture, or the average value of nearby pixels are required to obtain good spectral information. For different types of spatial content, information could also be added in the pixel characteristics vector as additional quality dimensions.
(ii) Proposed SVM with Genetic algorithm:
The SVM process based on genetic algorithm is the best solution for finding cotton diseases. The work we propose is based on the selection of features using edges, colors and shapes. These features can help identify and classify leaf diseases. Here, first we must use SVM to separate feature vectors and use genetic algorithms to classify diseases. Initially, binary SVM classification was applied to find the best separated hyperplane (OSH). This will create the largest margin between the two types of elements. To build the OSH, the SVM maps the data to a higher dimensional feature space. The SVM always performs this non-linear mapping with the help of a kernel function. The feature vector closest to the OSH in the higher feature space is also referred to as a support vector (SV). This contains all the information needed for the classification.
Consider training set with each input x Rn and an associated output yi. Each input x is first mapped into a higher dimension feature space F, by via a nonlinear mapping . When those data are linearly non-separable in F. There exists a vector w € F and a scalar b which define the separating hyper plane as:
(16)
Where, are called slack variable. Hyper plane which
optimally separates the features in F is one that to minimize,
.w.w + c (10)
Subject to (17)
Where, c is called regularization parameter which determines the tradeoff between maximum margin and minimum classification error. Optimal OSH can be find as, maximize
(18)
Subject to
Where, a1, ..aL are called as non-negative lagrangian multipliers. This feature vectors are taken by the input to genetic algorithm. Next, the genetic algorithm can perform the operation of classification. Processing steps of genetic algorithm is as follows,
i. Fitness of each chromosome can be evaluated. ii. For each cross validation process before steps to be
repeated.
iii. Then average fitness of the 10-fold cross validation is calculated.
iv. Crossover, Standard Deviation and Mutation techniques are applied.
v. Initially, terminates the maximum number of generation will be created.
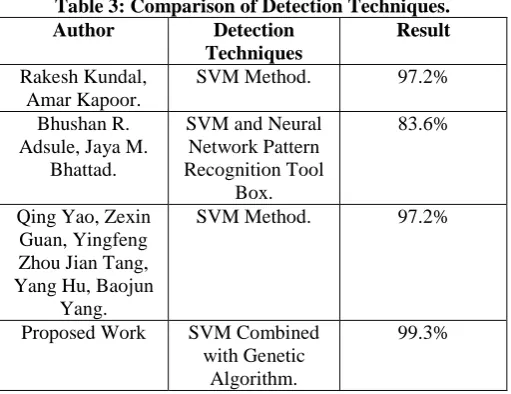
[image:13.595.300.556.393.590.2]Here, classification made with genetic for separating cotton leaf diseases. Existing Algorithms BPN, Fuzzy logic and SVM Classifiers with Edge, CMYK Color splitting model features has been combined and tested with our own collected cotton leaf data sets. In this investigation, the existing models have been analyzed to have low accuracy rates and error rates. The proposed SVM with genetic algorithm based method given higher accuracy rate.
Table 3: Comparison of Detection Techniques.
Author Detection
Techniques
Result Rakesh Kundal,
Amar Kapoor.
SVM Method. 97.2%
Bhushan R. Adsule, Jaya M.
Bhattad.
SVM and Neural Network Pattern Recognition Tool
Box.
83.6%
Qing Yao, Zexin Guan, Yingfeng Zhou Jian Tang, Yang Hu, Baojun
Yang.
SVM Method. 97.2%
Proposed Work SVM Combined
with Genetic Algorithm.
99.3%
V. RESULTSANDDISCUSSION (1) Experimental Setup
ANDROID:
are all configured on the computer and will be corrected to start writing in excess of programs that can run an Android compatible mobile device. Android is an efficient, programmer-friendly operating system that can manage hardware operation details and relieves application programs from having to deal with those details and makes it easy to write applications. The Android system maintains background processing, provides a rich user interface library, supports 2D and 3D graphics using the OpenGL-ES standard and leases, gets the file system and also a built-in SQlite database. Android apps, mainly compiled in the Java programming language.
The Android software development kit contains the tools you need to create, compile, and package Android applications. The main way to develop Android applications is based on the Java programming language.
[image:14.595.300.555.44.473.2]As shown in Figure 37, Android runs a custom JVM on top of a Linux kernel. It allows developers to write JAVA code with the JAVA libraries developed by Google. The Linux kernel has built-in camera driver, Wi-Fi driver, Bluetooth driver, etc. In the market, most Android devices also have custom matching hardware. Therefore, it is very appropriate for retinal prosthesis researchers to program and test their image processing algorithms and transfer protocols on the Android platform. In this document, we explain how to implement image processing operations on an Android mobile device.
Fig 39: Android System Architecture (2) Performance Evaluations:
An experimental analysis for various classifiers and the effect of the disease detection metrics on plant leaves is conducted. Performance metrics analyzed using precision, sensitivity, specificity and overall accuracy. Various types of classifiers are used in many image processing techniques. All types of classifiers having some limitations and accuracy level are low.
Table 4: Performance Evaluation of SVM -GA,SVM, BPNand Fuzzy Classifiers in diseases vise Cl ass Disease Name Bac teri al Blig ht Fus ariu m Wil t Lea f Blig ht Roo t Rot Nut rien t defi cien cy Ve rti cili um Wi lt Accur acy SV M Pre cisi on
0.89 0.86 0.89 0.95 0.90 1.0 0 0.91 % Sen siti vity
1.00 0.90 0.85 0.90 0.95 0.9 0
Spe cifi city
0.98 0.97 0.98 0.99 0.98 1.0 0 BP N N Pre cisi on
1.00 0.87 0.89 0.95 0.90 1.0 0 0.93 % Sen siti vity
1.00 1.00 0.85 0.90 0.95 0.9 0
Spe cifi city
1.00 0.97 0.98 0.99 0.98 1.0 0 FU ZZ Y Pre cisi on
1.00 0.87 0.94 0.95 0.90 1.0 0 0.94 % Sen siti vity
1.00 1.00 0.85 0.95 0.95 1.0 0
Spe cifi city
1.00 0.97 0.99 0.99 0.98 0.9 0 SV M - G A Pre cisi on
1.00 1.00 1.00 1.00 1.00 1.0 0 0.993 % Sen siti vity
1.00 1.00 0.99 0.98 1.00 1.0 0
Spe cifi city
1.00 1.00 1.00 0.99 0.98 1.0 0
Quantitatively, the performance was evaluated in terms of sensitivity, specificity, and precision. In which calculate using false positives (FP), true positives (TP),true negatives (TN), and false negatives (FN) as follows:
(i) Precision:Accuracy calculated based on the number of correct detections (true positive), number of incorrect detections (false positive) and number of missed detections (false negative), to show the robustness of detection. The leaf accuracies are 99.3% for bacteriosis, fusarium wilt, leaf rust, root rot, nutrient deficiency and verticilium wilt.
(ii) Sensitivity: It relates to the test’s ability to determine positive results. Sensitivity is not same as the positive predictive value or precision (ratio of true positives to combine true and positives).
(iii) Specificity:It is related to the ability of the test to establish negative results. If a test has a high specificity, it shows a positive test result means a high probability of the presence of disease.
Sensitivity =
(19)
Specificity =
(20)
Precision =
[image:14.595.54.284.358.528.2](3) Experimental results for SVM-GA classifier:
[image:15.595.46.291.153.348.2]The disease is detected early on before diseases affect the entire plant. Six diseases may be detecting cotton sheets by the SVM method with GA and compared with other methods. The proposed method provides a higher success rate. In this method, we achieved 99.3% accuracy in the detection of leaf diseases.
Fig 40: Comparative analysis of various classification techniques
CONCLUSION
In this paper, the various types of leaf disease, its symptoms
and recovery suggestions are discussed. To make an android application for leaf disease detection and recovery suggestions using image processing in which all details are given regarding leaf disease and its preventive measures displays.Through this paper, five major steps were implemented, namely image segmentation, image preprocessing, image acquisition, feature extraction and classification. This is useful for extracting accurate characteristics of the disease. In this work, the new classification method was proposed using SVM with genetic algorithm. We found that the SVM-GA gives good results in terms of accuracy for disease classification. The algorithms work successfully, with a precision of more than 99.3% for the detection of foliar diseases.
REFERENCES
1. Salve Yosef Khilari Pranay, HaseA.k.”android based Image Processing system for leaf Disease detection and Recovery Suggestions”, Vol. 3,Issue 07,2015
2. KshitijFulsoundar, Tushar Kadlag, SanmanBhadale, Pratik Bharvirkar, Prof S.P.Godse,” Detection and classification of plant leaf diseases”, International Journal of Engineering Research and General Science Volume 2, Issue 6, October-November, 2014.
3. Ajay A. Gurjar and Viraj A. Gulhane,“ Disease Detection On Cotton Leaves by Eigen feature Regularization and Extraction Technique”, (IJECSCSE 1) 2012, pp 1-4.
4. Van Joshua L. Abergos, Philip ZesarBoreta , Ricardo John B. Comprado , Stephen R. Soltes , Andy V. Tatel “Android-Based Image Processing Application for Rice Nitrogen Management”,Ateneo de Naga University
March 2012.
5. Bed Prakash, Amit Yerpude ,”A Survey on Plant Leaf Disease Identification” Volume 5, Issue 3, March 2015
6. NaikDurgeshManikrao, Dr. Prof. A.J.Vyavahare,” Disease Detection of Cotton crop using Image Processing Technique: A Survey”, (IJRASET) ,Volume 3 Issue VI, June 2015.
7 Amjad Farooq, Jehanzeb Farooq, Abid Mahmood, Amir Shakeel, Abdul Rehman, Asia Batool,Muhammad Riaz, Muhammad Tasdiq Hussain Shahid and SairaMehboob,”An overview of cotton leaf curls virus disease (CLCuD) a serious threat to cotton productivity”,AJCS 5 (13): 1823-1831 (2011)
8. Arti N. Rathod, BhaveshTanawal, Vatsal Shah,” Image Processing Techniques for Detection of Leaf Disease”, Volume 3, Issue 11, November 2013.
9. R. Preethi, S. Priyanka, U. Priyanka, A. Sheela,” Efficient knowledge based system for Leaf disease detection and classification”,IJARSE, Vol. No.4, special issue (01), March 2015.
10. V. Sathish1, Dr. K. Ramesh Kumar,”identification and classification ofPlant leaf disease”, IJARSE, Vol. No.4, Special Issue (01), March 2015.
11. Deepak J. Dange and Prof. M. A. Sayyad,”Computer Vision image Enhancement and Plant Leaves DiseaseDetection”, Plant Disease Detection,IJMTER-2015.
12. KomalBodkhe, Nisha Thakur, Shraddha Deshmukh, Asst. Prof. PreranaJaipurkar,”Analysis of Fungus in Plant Using Image Processing Techniques “, Vol. 2, Issue 1, pp: (12-18), April 2015 – September 2015,
13. Ravi C. Shinde, Jibu Mathew C and Prof. C. Y. Patil, “Segmentation Technique for Soybean Leaves Disease Detection”, Research article, International Journal of Advanced Research (2015), Volume 3, Issue 5, 522-528 522.
14. Sanjay B. Dhaygude, Mr. Nitin P. Kumbhar,“Agricultural plant, Leaf Disease DetectionUsing Image Processing”, Vol. 2, Issue 1, January 2013.
15 Prof. R. N.Kadu,S.Kangane,S.Vikhe,R. Pandita,V.Inamke,”Leaf disease Detection Using Arm 7 and image Processing”, IJERA publications,Vol.5.Issue 2,(part -1) February 2015,pp.68-71. 16. RenukaRajendraKajale,”Detection &Recognization of plant leaf
Diseases using image processing and Android O.S.”IJERGS,Volume 3,Issue 2,Part 2,March-April, 2015.
17. Santhosh Reddy, Abhijeet Pawar, SumitRasane, Suraj Kadam,”A survey on crop Disease Detection and prevention using android application”,IJISET-Vol. 2,Issue 4,April-2015.
18. AratiA. Dandavate, Pooja Bhingole, Neha Raut, RenukaR.MurkiBhavi,DhanshriMote,”E-Agriculture analysis and Grading disease of the leaf using Image Processing”,IJSRD,Vol.3,Issue 01,2015.
19. Jayme Garcia ArnalBarbedo, “ Digital image processing techniques for detecting, quantifying and classifying plant diseases ”, SP RINGER PLUS-2013
20. Kiran, Gavhale, UjwallaGawande,”an overview of the Research on plant Leaves Disease detection using Image Processing Techniques”, Vol.16,issue 1,pp 10-16-jan2014.
21. Vinita Tajane,N.J.Janwe,”Ayurvedic Plants disease Identification using CBIR”, Vol. 2,Issue 6,June 2014.
22. Sanjeev S sannakki,Vijay S Rajpurohit, VB Nargund, PallaviKulkarni,”Diagnosis and classification of Grape Leaf Diseases using Neural Networks”,Conference paper,IEEE,2013
23. Atul shire, UmeshJawarkar, MnojManmode,”A review paper on: Agricultural Plant Leaf disease Detection Using Image Processing”,Vol.2Issue 1,January-2015.
24. Dheeb al. Bahish, MAlikbraik and SuliemanBani-Ahmed,”Detection and classification of leaf diseases using K-means-based segmentation and Neural-networks-based Classification”,Asian Network for scientific Information,2011.
25. P. Revathi& M. Hemalatha,” Classification of Cotton Leaf Spot Diseases Using Image Processing Edge Detection Techniques”, IEEE, International conference on emerging Trends in science, engineering & technology, 2012, pg: No: 169-173.
26. P. Revathi, M. Hemalatha, “Cotton Leaf Spot Diseases Detection Utilizing Feature Selection with Skew Divergence Method”, International Journal of Scientific Engineering and Technology Vol. 3, Issue No.1, pp. 22-30 Jan 2014.
27. Sathish, T., and Karthick, S. “HAIWF-based fault detection and classification for industrial machine condition monitoring”, Progress in Industrial Ecology, vol. 12, no. 1-2, pp. 46-58, 2018
28. T. Sathish, and J. Jayaprakash, “Meta-Heuristic Approach to Solve
Multi Period
Disassembly-To-Order Problem of End-Of-Life Products using Adaptive 0
0.2 0.4 0.6 0.8 1 1.2
SVM
FUZZY
BPNN
Genetic Algorithm”, International Journal of Mechanical & Mechatronics Engineering IJMME-IJENS, Vol. 15, No. 3, pp. 59-67, 2015.
29. T. Sathish, “Experimental investigation on degradation of heat transfer properties of a black chromium-coated aluminium surface solar collector tube”, International Journal of Ambient Energy, Taylor and Francis Publishers, Vol. 39, doi: https://doi.org/10.1080/01430750.2018.1492456.
30. T. Sathish, “Heat Transfer Analysis of Nano-Fluid Flow in a converging Nozzle with different aspect Ratios”, Journal of New Materials for Electrochemical Systems, Vol. 20, pp. 161-167, 2017.
31. Sathish, T. “Performance measurement on extracted bio-diesel from waste plastic”, Journal of Applied Fluid Mechanics, vol. 10, pp. 41-50, 2017.
32. Sathish, T., Jayaprakash, J. “Optimizing Supply Chain in Reverse Logistics”, International Journal of Mechanical and Production Engineering Research and Development, Vol. 07, pp. 551-560, 2017. 33. Sathish, T., Periyasamy, P. “Modelling of HCHS system for optimal E-O-L Combination section and Disassembly in Reverse Logistics”, Applied Mathematics and Information science, Vol. 13, No. 01, pp. 1-6, 2019.
34. Sathish, T., Muthulakshmanan, A. “Design and simulation of connecting rods with several test cases using AL alloys and high Tensile steel”, International Journal of Mechanical and Production Engineering Research and Development, Vol. 08,Issue 1, pp. 1119-1126, 2018.
35. Vijayan, V., Parthiban, A., Sathish, T., Siva Chandran, S., Venkatesh, R. “Performance Analysis in End Milling operation”, International Journal of Mechanical Engineering and Technology, Vol. 09, Issue. 11, pp. 2263-2271, 2018.