Abstract: obtaining an exact measurement of oxygen saturation (SpO2) using a finger-probe based pulse oximeter is dependent on both artifact-free infrared (IR) and red (R) Photoplethysmographic signals. However, in actual real-time environment condition, these Photoplethysmographic signals are corrupted due to presence of motion artifact (MA) signal that is produced due to the movement/motion from either hand or finger. To address this motion artifacts interference, the cause of the contamination of Photoplethysmographic signals by the motion artifacts signal is observed. The motion artifact signal is established to resemble similar to an additive noise. Motion and noise artifacts enforce constraints on the usability of the Photoplethysmographic, predominantly in the setting of sleep disorder detection and ambulatory monitoring. Motion and noise artifacts can alter Photoplethysmographic, resulting wrong approximation of physiological factors such as arterial oxygen saturation and heart rate. For overcoming research challenges, this manuscript present a novel hybrid approach for detection of artifacts. Firstly, this work present an accurate SpO2 measurement model. Secondly, present an adaptive filter and adaptive threshold model to detect artifact and obtain derivative of correlation coefficient (CC) for labelling artifacts respectively. Lastly, Enhanced Support Vector Machine (ESVM) Model is presented to perform classification. Experiment are conducted on both real-time and simulated dataset set. Our hybrid approach attain significant performance in term of accuracy, sensitivity, specificity and positive prediction.
Keywords: Artifact detection, Machine learning, PPG, SVM.
I. INTRODUCTION
Photoplethysmographic (PPG) signals are some of the main physiological signals used for assessing oxygen carrying hemoglobin level in Heart Rate (HR) and blood [1]. The SpO2 value given by the pulse oximeter shall be used in measuring or showing some symptoms [2] such as hypoxemia [3], pulmonary embolism (PE) [4], congenital heart disease (CTD) [5], lower extremity arterial disease (LEAD) [6], acute heart failure (CTF) [7], and chronic obstructive pulmonary disease (COPD) [8]. Other than measuring the symptoms, the pulse oximeter shall be possibly used in assessing testicular torsion (TT) [9] and pulp vitality (PV) [10] also.
Revised Manuscript Received on March 08, 2019.
D.S Subhagya, Research Scholar, Electronics & Communication Engg, Jain University Bangalore, Karnataka,
Keshavamurthy. C, Professor of E & CE, Shri Revana Siddeshwara Institute of Technology, Chikkajala, Bangalore.
For obtaining these signals (oxygen carrying hemoglobin level in heart rate and blood), the. ultimate modest, cost effective and broadly used noninvasive method is pulse oximetry. By means of this method, PPG signals are acquired by using a minor wearable device which is easily adjustable on forehead or on the finger tips. LED light of particular wavelength is brightened on one side of the wearer’s finger. As the light travels through the finger, some of the light is captivated in the skin tissues whereas the left over is sensed by a sensor on another side of the device. As the captivated light’s power is reliant on the blood flow. The capacity of blood in the arteries fluctuates along with the heart pulse, therefore the light sensed by the sensor also differs resulting in a periodic signal that is used to measure HR. As PPG signals are extremely prone to motion artifact because of body movement, so even a smallest change sensed by these devices can misrepresent the PPG signal which affects hemoglobin level in blood and HR information [11].
To identify and remove mild motion artifacts from multiple signal processing units, a new algorithm is developed and processed, and use of in which finger movements sensed or a minor glitch in body position are stored [12], [13] Likewise, in [12] modified active adaptive noise filtering algorithm is used for eliminating motion artifacts, however it is reliant on the selection of listed signals. Independent component analysis (ICA) described in [14] is relatively similar in effecting eliminating motion artifacts. Other than verifying from patients HR, with the research on PPG signals from various data sets and doctors review PPG signals are extremely adaptive to motion artifact because of human body instability, Due to that a micro distortion sensed by the embedded system(device) can misrepresent PPG signals and that affects the hemoglobin level in blood and HR information[11].
Numerous methods [15], [16] are been explained in the literature for extraction of respiratory rate (RR) and heart rate (HR) and from Photoplethysmographic signals. But then again signal and ecological artifacts cause falsifications in Photoplethysmographic signal, which makes inaccurate assessment of respiratory rate and heart rate. It is mandatory to have complete mechanized embedded system, it is vital to make an extra module which permits to sense sections which are not functional for valuation due to artifacts noise/distortions. These two methods for controlling motion artifacts has offered by the state of work.
Motion Artifact Detection Model using Machine
Learning Technique for Classifying
Abnormalities in Human Being
Primary one was to build based on filtering means which is adaptive in nature mechanism [17], empirical mode decomposition technique [18], and wavelet transformation method [19]. These approaches have great computational difficulty. They are restricted to boundaries of performance since there is no static model existing both for Photoplethysmographic or artifacts. Even bad, valuable info regarding respiratory and heart contraction and relaxation activities can be skipped when introducing filters, even if it is a sanitized portion of Photoplethysmographic. Signal of rich quality metrics are considered and allocated to pulses such that only worthy pulses are stored. Classification based models that cumulate multiple signal morphology structures are utilized in [20], that includes examining signals and wave’s morphology and assigning to multiple pulse signal in rich quality metrics, but, the approaches need huge demonstrative labeled database for testing and training problems. They appears barely possible for the real objective as of great difference amid prospect and ambiance methods as well extended period of time required for expert to tag signals, additional strategy is based on DT (decision tree) and predetermined thresholds and later used to choose if particular signal/pulse matched to referral value by formulating the Euclidean space. Numerous predetermined threshold are later used to opt a particular signal/pulse can be considered or declined. These technique are unable to be combined in stand-alone method as layout and thresholds are physically secured. Besides, research offered doesn’t take under consideration of HR fluctuation with respect to SpO2 that has a straight result/consequences on the pulse shape.
All the stated means are beneficial but they have more or less other drawback. That is, they consume higher computation time and computational cost, and suffers from eradicating of motion artifacts.The drive of this study is to offer an effective process of eliminating motion artifacts, in which concurrent three-axis acceleration data is attained and are utilized for calculating time and level of motion artifact in Photoplethysmographic signal and efficiently screen SpO2 and heart rate in intense exercise (12-15 km/hr) that is running by the subject.
To overcome the research challenges, this work firstly present an accurate SpO2 measurement model considering the impact of artifacts. Secondly present a data preprocessing model to obtain PPG signal with and without artifact using adaptive filter model. Further present a batch or template selection model using adaptive threshold model to obtain derivative of correlation coefficient for labelling artifact and without artifacts. Then, ESVM model is presented which takes these input feature with labelled class for training.
Lastly, ESVM perform classification considering various kind of data.
The Contribution of research work is as follows: This work presented an accurate SpO2 measurement. Further presented adaptive filter and adaptive threshold model for identifying artifact and obtain derivative of correlation coefficient for labelling artifacts respectively. This manuscript presented a novel classification method namely ESVM for artifact detection, ambulatory monitoring and sleep disorder detection.
Our model attain superior performance in terms of Accuracy, specificity, sensitivity, and positive prediction.
The rest of the paper is organized as follows. In section II, the proposed hybrid motion artifacts detection model using enhance support vector machine classifier is presented. In penultimate section experimental study is carried out. The conclusion and future work is described in last section.
II. HYBRIDMOTIONARTIFACTDETECTION
MODELUISNGENHANCEDSUPPORTVECTOR
MACHINECLASSIFIER
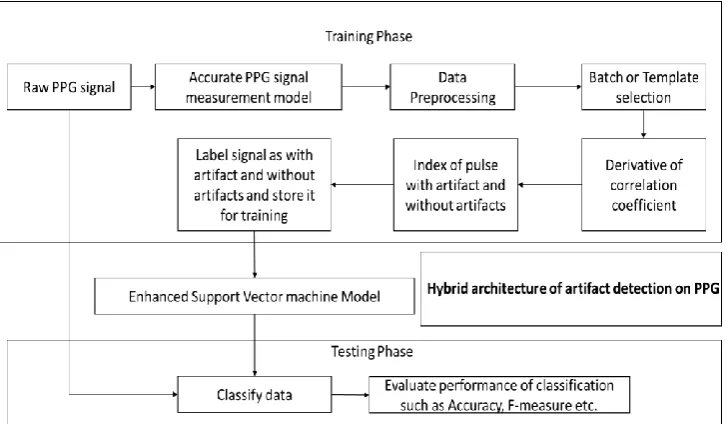
Fig. 1. Hybrid Architecture For Artifact Detection On PPG Signal Using Enhanced Support Vector Machine Model.
a) SPO2 computation optimization considering the presence motion artifact:
The arterial oxygen saturation can be derived using [25] and normalized optical density ratio or ratio of absorbance [26] is obtained as follows
ℛ𝓉𝒹=𝒜𝒞𝒜𝒞ℛ 𝒟𝒞ℛ
ℐ 𝒟𝒞ℐ (1)
where 𝒟𝒞 and 𝒜𝒞 are amplitudes of direct current component and alternating current components respectively, ℛ and ℐ depicts red light and infrared light channel respectively. This work considers frequency domain ratio of absorbance at heart beat rather than measuring at alternating current components which is obtained as follows
ℛ𝓉𝒹=QQℛ ehr 𝒟𝒞ℛ
ℐ ehr 𝒟𝒞ℐ (2)
where ehr is frequency per beat corresponding to
harmonic, Qℛ ehr and Qℐ ehr are signal power at frequency
ehr. The relationship of ehr with respect to SpO2 calculation
is obtained as follows
2 = h ℛ ehr (3)
where h depicts linear fitted calibration curve (LFCC). The photoplethysmography signal has been designed as combination of motion artifact affected signal and clean signal [27], [28], and [29]. These design are considered to correct but are far from accurate considering real-time object (person) specific environment. As a result, the spectrum of good photoplethysmography signals and the control of these photoplethysmography signals primarily allocates in the initial set of harmonics (three harmonic sets) of the HR frequency. Thus, it shows that it can obtain extra perfect and exact spectrum computation or estimates by using a parametric spectrum methodology.
This work considers a empirical signal method in which the interference are of following three classes are describes below. Firstly, abnormal or arbitrary motion artifacts that causes non-periodic interferences, secondly, normal motion artifacts that resembles periodic interference and lastly, unavoidable Gaussian noise (GN) when fluid parameter (i.e., passage of fluid through tissue) is less. The PPG signal model is derived based on the conventions considered by the
researcher in [27], [30]. Here, they considered that the non-pulsating and non-pulsating segments has been considered to possess dissimilar/varied optical absorption rate (OAR) sb
andsw. Based on the model presented in [27] the infrared
component ℐ and Red component ℛ are measured as follows
ℐ = 𝒮 + ℳ (4)
ℛ = sb∗ 𝒮 + sw+ ℳ (5)
where 𝒮 represent signal and ℳ represent motion. However, our approach considers PPG (heart rate specific Spo2) harmonic components for modelling signal which is obtained as follows
g, β = b cos 2πgu + β , (6)
where b, β, and g depicts the amplitude, phase, and frequency of the i respectively. Considering N motion harmonics and Q PPG sample (heart beat specific Spo2), the motion and signal related component is estimated as follows
ℳ = ℳnormal + ℳabnormal (7)
= N+Qj=Q+1ij gj, βj + n u
= N+Qj=Q+1ij gj, βj (8)
where n u depicts abnormal motion. This work further normalize the model by relaxing the component in motion possess same sb and component in signal possess same sb due to the presence of colored noises, every abnormal motion artifacts/harmonic set has specific respective sj in our approach. Let consider that that the both signal is composed of white noise x u with same power α2, the signal in our approach can be estimated as follows
ℐ = Qj=1sji gj, βj + N+Qj=Q+1sji gj, βj + x u + n u (9)
ℛ = Qj=1i gj, βj + N+Qj=Q+1i gj, βj +sQ+N+1n u + (10)
b) Adaptive filter Model for detecting motion artifacts: For building an adaptive filters, this work considers using stochastic gradient decent (.i.e., here
[image:3.595.109.473.50.262.2]𝑓 𝑜 at present instance of time. The expected reference signal of motion artifacts signal is used for filtering purposes. The stochastic gradient decent are obtained as follows
v o = v o , v o − 1 … v o − n + 1 U
(11)
o + 1 = i o + δ. f∗ o . v o
= e o − iI o .
where 𝑣 𝑜 , 𝑓 𝑜 , 𝑒 𝑜 are input, error induced signal and expected output respectively. Whereas 𝛿 depicts step length to be used in adaptive filter and 𝑖 𝑜 are the weights of the computed filter. The 𝛿 defines how adaptive filter coverages that is directly related on weight optimization. Larger the size of 𝛿 is choses, the gradient decent with respect to weight will result in high amplitude wavering near optimal parameter, that result in less accuracy and higher mean square error or vice versa. Therefore, optimization to bring good tradeoff for computing coefficient using an arbitrary PPG signal with minimum undesirable noise is expressed as follows
𝑧𝐷 𝑜 = 𝑥𝑈 𝑜 . 𝑣 𝑜 ∶ 𝑂𝑢𝑡𝑝𝑢𝑡 𝑐𝑜𝑛𝑠𝑡𝑟𝑢𝑐𝑡𝑖𝑜𝑛 (12) 𝑓 𝑜 = 𝑒 𝑜 𝑧𝐷 𝑜 𝐸𝑟𝑟𝑜𝑟 𝑐𝑜𝑚𝑝𝑢𝑡𝑎𝑡𝑖𝑜𝑛:
𝑣𝐷∗ 𝑜 = 𝑑𝑗∗. 𝑣 𝑜 − 𝑗 − 𝑁 + 1
𝐽−1
𝑗=0
𝑢 𝑜 + 1 = 𝑢 𝑜 + 𝛿. 𝑣𝐷∗ 𝑜 𝑓 𝑜 ∶ 𝑊𝑒𝑖𝑔𝑡 𝑜𝑝𝑡𝑖𝑚𝑖𝑧𝑎𝑡𝑖𝑜𝑛 In Eq. (12), 𝑑𝑗∗ depicts coefficient of computed filter for optimization. Now stability and convergence are impacted by the reference signal 𝑣𝐷∗ 𝑜 with delay incurred with respect to both forward paths [31]. One of the parameter of these filter is used for adaptive filtering block.
Signal peak and adaptive threshold modeling:
Slope Sum Mechanism (SSM) is utilized for enhancing ascending segment of photoplethysmography signal while it decline descending segment of these signals. The, each signals is transpired further into a Slope Sum Method signals for identifying upper limits and track it utilizing proposed strategy which is adaptive in nature. The onset and offset of each signals is first established considering certain window size. Then upper limit are detected considering offset and onset of each and every signals. The SSM of a given instance of time 𝑢 is obtained as follows
𝕊u= ul=u−xφvl (13)
If 𝜑𝑦𝑙> 0 then 𝜑𝑣𝑙 is set as follows (14) 𝜑𝑣𝑙= 𝜑𝑦𝑙
If 𝜑𝑦𝑙< 0 then 𝜑𝑣𝑙 is set as follows
𝜑𝑣𝑙= 0 (15)
where 𝜑𝑣𝑙 depicts outcome of the low pass filter, and 𝑥 depicts chosen window size. This work considers a window size of 3 seconds for peak tracking. Firstly, we measure the peak value of PPG keeping subject at rest for estimating initial threshold [32]. Utilizing these initial threshold, the forthcoming window upper limits is computed utilizing proposed threshold model which is adaptive in nature. In each windows iteration update, the threshold parameter is optimized and upper limits computation lasts till computation of all signals is completed. In scenario of lost upper limits, the preceding parameter is kept for aiding computing peak parameter of the missing or next window.
Research methodology:
By perceiving the morphology structure of a photoplethysmography waveforms, it can see slight variation
in amplitude and shape and the pulse with identical forms. A pulse is a signal part among any two consecutive minima. In circumstance of presence of artifacts due to noise or motion, the shape of those pulses rapidly varies rapidly or abruptly. As shown in [33] and [34], using template/batch and comparing metrics of these batches aid in performance improvement. This work present a design to enhance automatic batch estimation and to perform comparative analysis among pulse and the template, this work use CC derivatives parameters, that follows the modification of pulse morphological structure. Lastly, we include arbitrary distortion testing to obtain optimal strategy for attaining adaptive threshold.
Data preprocessing: the database is obtained from [35] which composed of PPG signal. The data was collected with hand held fixed on a table top for 20 seconds and later certain movement is performed for another 20 second an PPG signals are collected. PPG signals are collected with selection ratio of thousand hertz and signal are filtered using proposed adaptive filter model presented in above section.
Pulse segmentation: Pulse-to-pulse (P2P) session 𝑈𝑃 is considered to be inverse of the heart frequency and it varies with respect to time. This frequency may match with determined upper limit of 0.5 to 3 Hertz when using Fourier transformation of the Photoplethysmographic. Then, window size (WS) of 𝑀 is considered for estimation of local HR frequencies 𝑔ℋ To overcome error corresponding to local determined upper limits due to diastolic peak (distortion) [36], using moving average that depicts heart beats with respect to SpO2 areas, a block of interest are generated. Therefore, the block bounds are the minima of the corresponding signal 𝑦𝒜 which is computed as follows. 𝑦𝒜=𝒳1 𝑦 𝑜−𝑥−12 + ⋯ + 𝑦 𝑜 + ⋯ + 𝑦 𝑜−𝑥−12 (16)
where 𝑜 is the signal features size, 𝒳 =𝑈𝑃 2 =
1
2𝑔ℋ is the window size of the moving average, and 𝑦 depicts the size of PPG signal. The pulse maxima is a minimum parameter of 𝑦 𝑜 in each segment due to delay incurred by moving average. Therefore, the pulse extracted are maximum with respect to 𝑈𝑃
2.
Batch or template construction: In each window, pulse batch 𝒫𝒯is constructed by averaging entire pulses obtained from considered window.
The CC 𝒞𝑗 𝑜 among each pulse 𝒫 𝑜 and 𝒫𝒯 of the considered
window are computed. For attaining good accurateness performance, the pulse batch should be computed in most stable (adaptive) window. Then, the concluding pulse batch 𝒫 is one with max average 𝒞𝑗.
Artifact identification for labelling: Post obtaining ideal 𝒫, a comparative analysis among 𝒫 and all pulses in batch list is performed. That is, considering a pulse of index or list, this work identify its upper limit with respect to the batch. From
both direction of this upper limit, we chose 𝑈𝑃
2samples, where 𝑈𝑃 is the size of batch. The 𝒞 is then computed among batch
and the segment of these pulses. When motion artifacts arises, the 𝒞 of these pulse is impacted and has low parameter values than those of
𝒟𝒞𝑙 is used and thresholding is required for decision. But
variation among different individual affects
photoplethysmography features. As a result, having fixed threshold for all photoplethysmography signals is not practicable. To overcome, adaptive threshold modelling presented in above section is used.
Further, to identify and label the signal are with artifact on without artifacts using adaptive threshold model. This work computes 𝒟𝒞𝑙 for pulse 𝑙 and considers 𝒟𝒞𝑙 = 𝒟𝒞0𝑙+
𝑦𝑙~𝑂 0, 𝛼2 and 𝒟𝒞0𝑙 is the true 𝒟𝒞𝑙. Further checks
𝒟𝒞0
𝑙 ≤ 𝕋 over 𝒟𝒞0𝑙 > 𝑇. i.e., if 𝒟𝒞𝑙 > 𝑄, then
ℒ𝒜 = 1, 𝑝𝑟𝑒𝑠𝑒𝑛𝑐𝑒 𝑜𝑓 𝑎𝑟𝑡𝑖𝑓𝑎𝑐𝑡 (17)
if 𝒟𝒞𝑙 ≤ ℚ, then
ℒ𝒜 = 0, 𝑛𝑜 𝑝𝑟𝑒𝑠𝑒𝑛𝑐𝑒 𝑜𝑓 𝑎𝑟𝑡𝑖𝑓𝑎𝑐𝑡𝑠 (18)
Where ℚ is threshold which can be obtained as follows ℚ = 𝛼𝛾𝜔
𝕋
𝛼 (19)
In which 𝛾𝜔 𝑛 is the adaptive solution to Eq. (16), 𝛼 is the
variance of the additive noise, 𝜔 is false alarm rate, and 𝕋 is the tolerance.
Classifier construction using enhanced support vector machine:
The enhanced support vector machine first extract features of normal PPG data and PPG with artifacts as training parameter which are labeled (withoutArtifact: 0, and withArtifact: 1). The support vector machine then trains the model utilizing labelled feature sets and collects support vector among features sets that maximize the distance among different set of classes considered. Then, the support vector machine builds a decision boundary from the obtained support vectors. If the estimated result from the decision boundary is dissimilar from its trained set label, the outcome is said to be as training error. For addressing such circumstances, a soft-margin SVM is considered. This aid in fixing boundary even when the training set cannot be fragmented and are mixed. For minimizing training error and maximizing margin a slack parameters is introduced. For evaluating support vector using ESVM model is obtained as follows
min 𝔻 𝜇𝓏+
1 2 𝕆
𝓏=1 𝓊𝓉, 𝓊𝓉 , (20)
Such that 𝕌𝓏 𝓊𝓉, 𝑧𝓏 + 𝕔𝕥 ≥1= 𝜇𝓏 for 𝓏 =1,2,3, … , 𝕆,
and 𝜇𝓏≥0
where 𝕆 is the number of vectors, 𝜇𝓏 is the slack parameter, 𝔻 is regulation variable, 𝓊𝓉 is the weight vector,
and <. , . > is the inner product function. The 𝕌𝓏 is the
𝓏𝑡 target parameter, 𝕔
𝕥 is the bias, and 𝑧𝓏 is the 𝓏𝑡 input
parameter. The support vector machine DB 𝔾𝓏is described as
𝔾𝓏= 𝓊𝓉∗, 𝑧 + 𝕔𝕥∗= 0 (21)
where 𝑧 is the input feature, 𝓊𝓉∗ represent weight vector, and
𝕔𝕥∗ depicts bias parameter. By emerging the 𝑧𝓏 and 𝑧 term to
𝑧𝓏→ 𝑧𝓏 and 𝑧 → 𝑧 , the non-linear SVM (NL-SVM) (i.e., the
ESVM) can be transformed to linear based SVM as follows
𝕌𝓏 𝓊𝓉, 𝑧𝓏 + 𝕔𝕥 ≥ 1 (22)
Further, to make classification using ESVM, a kernel function 𝕃𝕥 . , . , which is a dot-product in the transpired
feature vector space is described as 𝕃𝕥 𝑧𝓏, 𝑧𝓏′ = 𝑧
𝓏 , 𝑧𝓏′ (23)
where 𝑧𝓏′=1,2, … , 𝕆.
Further, the ESVM model is assessed using different PPG data which is consist of signal data of different motion specific data. The ESCM based approach can efficiently classify these signal when compared with existing approach which is proven experimentally in below section.
III. RESULTANDANNALYSIS
This section presents experiment analysis of proposed motion artifact detection model performance using ESVM classifier over exiting classifier model [38-43]. The system environment used for experiment analysis is Windows 10 enterprises edition, Intel Pentium I-7 class Quad core processor, 16 GB RAM, and NVIDIA CUDA enabled GPU. The ESVM model is implemented using C# library and Python 3. The performances is evaluated in terms of Accuracy (𝐴𝑐), Sensitivity (𝑆𝑛), Specificity (𝑆𝑝) and Positive
Prediction (𝑃𝑃). The Accuracy is calculated as follows
𝐴𝑐𝑐𝑢𝑟𝑎𝑐𝑦 𝐴𝑐 =
𝑇𝑃∗𝑇𝑁
𝑇𝑃+𝑇𝑁+𝐹𝑃+𝐹𝑁 (24)
The specificity is calculated as follows 𝑆𝑝𝑒𝑐𝑖𝑓𝑖𝑐𝑖𝑡𝑦 𝑆𝑝 =
𝑇𝑁
𝑇𝑁+𝐹𝑃 (25)
The sensitivity is calculated as follows
𝑆𝑒𝑛𝑠𝑖𝑡𝑖𝑣𝑖𝑡𝑦 𝑆𝑛 =𝑇𝑃+𝐹𝑁𝑇𝑃 (26)
The positive prediction is calculated as follows
𝑃𝑜𝑠𝑖𝑡𝑖𝑣𝑒 𝑃𝑟𝑒𝑑𝑖𝑐𝑡𝑖𝑜𝑛 𝑃𝑃 =𝑇𝑃+𝐹𝑃𝑇𝑃 (27)
For experiment analysis the database is obtained from [35] which composed of PPG signal. The data was collected with hand held fixed on a table top for 20 seconds and later certain movement is performed for another 20 second an PPG signals are collected. PPG signals are collected at a sampling rate of 1000 Hz and signals were filtered using [37] with a pass band between 0.05 - 5 Hz [37]. Further, we collect sample of different individual IR and R value using pulse oximeter. The Signal is composed of both with artifacts and without artifacts. Person age, BMI information are added and labeling of artifact and without artifact is done manually.
a) Performance evaluation considering varied experiments in terms of Accuracy, Specificity, Sensitivity and Positive Prediction:
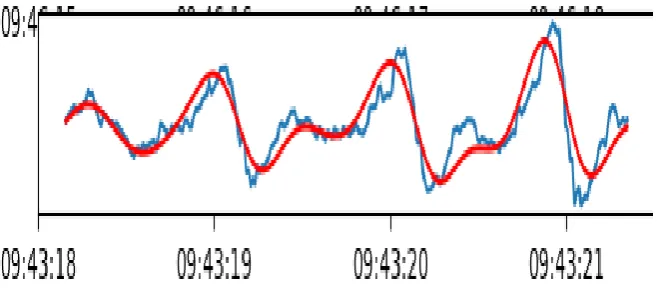
The Figure 1, depicts the outcome attained by proposed model in identifying, detecting motion artifact and eliminating motion and obtain clean PPG signal. The blue signal depicts PPG signal with motion artifacts and the blue signal is the clean PPG signal obtained by proposed design. These result are fed into ESVM classifier for automatic and accurate detection and classification of motion artifact and
Fig. 1 Outcome attained by proposed model.
In [38] performed classification of sleep apnea and sleep hypopnea conditions using varied categorizations based on rigorousness of SDB using SVM. The classification outcome attained by these model shows are evaluated in terms of sensitivity and positivity prediction. A sensitivity performances improvement of 74.2% and 87.5% is attained considering apnea and hypopnea, respectively. Then, positive prediction performance improvement of 87.5% and 63.4% for apnea and hypopnea, respectively. Similarly, considering both apnea + hypopnea, a sensitivity and positive prediction performance improvement of 92.4% and 92.8% is attained, respectively. In [39] showed Apnea Hypopnea Index describes the rigorousness of sleep apnea hypopnea symptoms utilizing the signals acquired using Polysomnography. The results show an Accuracy, Specificity, Sensitivity of 88.61%, 64.29% 93.85% using Least Square SVM. In [40] performed classification and analysis of pulse oximetry readings to forecast obtrusive sleep apnea rigorousness in kids. An accuracy of 85.255 is attained. In [41] presented a fusion model and attained an
[image:6.595.90.507.487.616.2]accuracy of 75.46%, 83.35%, 81.56% considering varied experiment for SpO2 and heart rate detection. In [42] presented a classifier model using SVM to distinguish between MNA-corrupted and MNA-free PPG data. The model attained accuracy, sensitivity, and specificity improvement of 92.0%, 93.0%, and 93.0% respectively. In [43] their model attained a mean specificity performance of 85.8%, 80.5%, and 80.0% for the minor, modest, and worst (rigorous) conditions, respectively. Then, attained a mean sensitivity 72.5%, 74.2%, and 71.5% for the minor, modest, and worst (rigorous) conditions, respectively. Similarly, attain a mean accuracy performance of 70.3%, 77.1%, and 71.9% for the minor, modest, and worst (rigorous) conditions, respectively. In our model we attained accuracy of 95.97%, sensitivity of 94.6%, specificity of 97.5% and positive perdition of 98.57% performance is attained. The experiment out of proposed and its comparison with state-of-art technique is given in TABLE I below. The overall result attained shows the efficiency of proposed hybrid model using ESVM classification model over state-of-art technique.
Table.1 Performance Evaluation Over State of art Technique
Accuracy Sensitivity Specificity Positive
prediction
[38] - - 85.2% 83.5%
[39] 88.61% 93.85% 64.29% -
[40] 85.255 - - -
[41] 83.35% - - -
[42] 92.0% 93.0% 93.0% -
[43] 71.8% 80.24% 71.2% -
Our approach 95.97% 94.6% 97.5% 98.57%
IV. CONCLUSION
Motion and noise artifacts enforce constraint on the usability of the Photoplethysmographic, predominantly in the setting of ambulatory observation and sleep disorder detection. Motion and noise artifacts can affect/falsify Photoplethysmographic, resulting inaccurate estimate of physiological information’s such as SpO2 and HR. In this manuscript, the work presented a new hybrid method for detection of artifacts. Firstly, this work present an accurate SpO2 measurement model. Secondly, present an adaptive filter and adaptive threshold model to detect artifact and obtain derivative of correlation coefficient for labelling artifacts respectively. Lastly, Enhanced Support Vector Machine (ESVM) Model is presented to perform
classification. Experiment are conducted on both real-time and simulated dataset set. Our hybrid approach attain significant performance in term of accuracy of 95.97%, sensitivity of 94.6%, specificity of 97.5% and positive perdiction of 98.57% is attained. The future work we would consider performance evaluation considering varied dataset and further enhance the classification model.
REFERENCES
1. J. Allen, “Photoplethysmography and its application in clinical physiological measurement,”
2. S. Sinchai, P. Kainan, P. Wardkein and J. Koseeyaporn, "A Photoplethysmographic Signal Isolated From an Additive Motion Artifact by Frequency Translation," in IEEE Transactions on Biomedical Circuits and Systems. doi: 10.1109/TBCAS.2018.2829708, 2018.
3. AJubran, “Pulse oximetry,” Intensive Care Med., vol. 30, no. 11, pp. 2017–2020, 2004.
4. J. A. Kline et al., “Use of pulse oximetry to predict in-hospital complications in normotensive patients with pulmonary embolism,” Amer. J. Med., vol. 115, no. 3, pp. 203–208, 2003.
5. A Bakr and H. Habib, “Combining pulse oximetry and clinical examination in screening for congenital heart disease,” Pediatr Cardiol, vol. 26, no. 6, pp. 832–835, 2005.
6. G. I. Parameswaran, K. Brand, and J. Dolan, “Pulse oximetry as a potential screening tool for lower extremity arterial disease in asymptomatic patients with diabetes mellitus,” Archives Internal Med., vol. 165, no. 4, pp. 442–446, 2005.
7. J. Masip et al., “Pulse oximetry in the diagnosis of acute heart failue,” Revista Espa de Cardiol., vol. 65, no. 10, pp. 879–884, 2012.
8. S. A. Shah, C. Velardo, O. J. Gibson, H. Rutter, A. Farmer, and L.Tarassenko, “Personalized alerts for patients with copd using pulse oximetry and symptom scores,” in Proc. Conf. IEEE Eng. Med. Biol. Soc., Chicago, USA, pp. 3164–3167, 2014.
9. H.-W. Chen, L.-C. Weng, T.-M. Wang, and K.-F. Ng, “Potential use of pulse oximetry for the diagnosis of testicular torsion,” JAMA Pediatr, vol. 168, no. 6, pp. 578–579, 2014.
10. M. Bargrizan, M. A. Ashari, M. Ahmadi, and R. Jamileh, “The use of pulse oximetry in evaluation of pulp vitality in immature permanent teeth,” Dent Traumatol, vol. 165, no. 4, pp. 43–47, 2016.
11. Z. Zhang, Z. Pi, and B. Liu, “Troika: A general framework for heart rate monitoring using wrist-type photoplethysmographic signals during intensive physical exercise,” IEEE Transactions on Biomedical Engineering, vol. 62, no. 2, pp. 522–531, Feb 2015.
12. M. R. Ram, K. V. Madhav, E. H. Krishna, N. R. Komalla, and K. A. Reddy, “A novel approach for motion artifact reduction in ppg signals based on as-lms adaptive filter,” IEEE Transactions on Instrumentation and Measurement, vol. 61, no. 5, pp. 1445–1457, May 2012.
13. A Wood, Physiology, Biophysics, and Biomedical Engineering, ser. Series in Medical Physics and Biomedical Engineering. CRC Press, 2016.
14. T. Schck, C. Sledz, M. Muma, and A. M. Zoubir, “A new method for heart rate monitoring during physical exercise using photoplethysmographic signals,” in 2015 23rd European Signal Processing Conference (EUSIPCO), pp. 2666–2670, 2015.
15. E. Gil, P. Laguna, J. Martinez, O. Prez, A. Alberola, and L.Sornmo, “Heart rate turbulence analysis based on photoplethysmography,” IEEE Transactions on Biomedical Engineering, vol. 60, no. 11, 2013. 16. A Garde, W. Karlen, J. M. Ansermino, and G. A. Dumont, “Estimating
respiratory and heart rates from the correntropy spectral density of the photoplethysmogram,” PLoS ONE, vol. 9, no. 1, 2014.
17. M. R. Ram, K. Madhav, H. Krishmaa, N. R. Komalla, and K. A. Reddy, “A novel approach for motion artifact reduction in ppg signals based on as-lms adaptive filter,” IEEE Tr. Instru. and Meas., vol. 61, no. 5, 2012.
18. Q. Wang, P. Yang, and Y. Zhang, “Artifact reduction based on empirical mode decomposition (emd) in photoplethysmography for pulse rate detection,” in Engineering in Medicine and Biology Society (EMBC), 2010 Annual International Conference of the IEEE, pp. 959– 962, 2010.
19. P. Addison and J. Watson, “Signal processing techniques for determining signal quality using a wavelet transform ratio surface,” 2010.
20. J. W. Chong, D. K. Dao, S. M. A. Salehizadeh, D. D. McManus, C. E. Darling, K. H. Chon, and Y. Mendelson, “Photoplethysmograph signal reconstruction based on a novel hybrid motion artifact detection reduction approach. part i: Motion and noise artifact detection,” Annals of Biomedical Engineering, vol. 42, no. 11, pp. 2238–2250, 2014. 21. J. A. Sukor, S. J. Redmond, and N. H. Lovell, “Signal quality measures
for pulse oximetry through waveform morphology analysis,” Physiological Measurement, vol. 32, no. 3, p. 369, 2011.
22. S. J. Barker and N. K. Shah, “The Effects of Motion on the Performance of Pulse Oximeters in Volunteers (Revised publication)," Anesthesiology, vol. 86, p. 101, Jan. 1997.
23. M. T. Petterson and V. L. Begnoche, “The effect of motion on pulse oximetry and its clinical significance," Anesthesia & Analgesia, 2007.
24 A Pantelopoulos and N. G. Bourbakis, \A Survey on Wearable Sensor-Based Systems for Health Monitoring and Prognosis," Systems, Man, and Cybernetics, Part C: Applications and Reviews, IEEE Transactions on, vol. 40, no. 1, pp. 1-12, 2010.
25 J. G. Webster, Design of pulse oximeters. CRC Press, 1997.
26 J. Yan and G. Bin, “Research on an anti-motion interference algorithm of blood oxygen saturation based on AC and DC analysis,” vol. 23, no. s2, pp. S285–S291, 2015.
27 J. M. Goldman, M. T. Petterson, R. J. Kopotic, and S. J. Barker, “Masimo signal extraction pulse oximetry,” vol. 16, no. 7, pp. 475– 483, 2000.
28 F. Peng, Z. Zhang, X. Gou, H. Liu, and W. Wang, “Motion artifact removal from photoplethysmographic signals by combining temporally constrained independent component analysis and adaptive filter,” vol. 13, no. 1, p. 50, 2014.
29 Y.-S. Yan and Y.-T. Zhang, “An efficient motion-resistant method for wearable pulse oximeter,” IEEE Transactions on information technology in biomedicine, vol. 12, no. 3, pp. 399–405, 2008. 30 R. Yousefi, M. Nourani, S. Ostadabbas, and I. Panahi, “A
motion-tolerant adaptive algorithm for wearable photoplethysmographic biosensors,” vol. 18, no. 2, pp. 670–681, 2014.
31 A Uncini, Fundamentals of Adaptive Signal Processing, ser. Signals and Communication Technology. Springer International Publishing, 2014.
32 D. G. Jang, U. Farooq, S. H. Park, and M. Hahn, “A robust method for pulse peak determination in a digital volume pulse waveform with a wandering baseline,” IEEE Transactions on Biomedical Circuits and Systems, vol. 8, no. 5, pp. 729–737, Oct 2014.
33 E. Gil, P. Laguna, J. Martinez, O. Prez, A. Alberola, and L.Sornmo,“Heart rate turbulence analysis based on photoplethysmography,” IEEE Transactions on Biomedical Engineering, vol. 60, no. 11, Nov. 2013.
34 Q. Li and G. D. Clifford, “Dynamic time warping and machine learning for signal quality assessment of pulsatile signals,” Physiological Measurement, vol. 33, no. 9, p. 1491, 2012.
35 J. A. Sukor, S. J. Redmond, and N. H. Lovell, “Signal quality measures for pulse oximetry through waveform morphology analysis,” Physiological Measurement, vol. 32, no. 3, p. 369, 2011.
36 M. Elgendi, I. Norton, M. Brearley, D. Abbott, and D. Schuurmans, “Systolic peak detection in acceleration photoplethysmograms measured from emergency responders in tropical conditions,” PLoS ONE, vol. 8, pp. 1–11, 10 2013.
37 J. Allen, “Photoplethysmography and its application in clinical physiological measurement,” Physiological Measurement, vol. 28, no. 3, p. R1, 2007.
38 Park, J. U., Lee, H. K., Lee, J., Urtnasan, E., Kim, H., and Lee, K. J., Automatic classification of apnea/hypopnea events through sleep/wake states and severity of SDB from a pulse oximeter. Physiol. Meas. 36(9):2009–2025, 2015.
39 J. F. Morales et al., "Sleep Apnea Hypopnea Syndrome classification in SpO2 signals using wavelet decomposition and phase space reconstruction," 2017 IEEE 14th International Conference on Wearable and Implantable Body Sensor Networks (BSN), Eindhoven, pp. 43-46, 2017.
40 G. C. Gutiérrez-Tobal et al., "Analysis and classification of oximetry recordings to predict obstructive sleep apnea severity in children," 2015 37th Annual International Conference of the IEEE Engineering in Medicine and Biology Society (EMBC), Milan, pp. 4540-4543, 2015. 41 S. Gutta, Q. Cheng, H. D. Nguyen and B. A. Benjamin,
"Cardiorespiratory Model-Based Data-Driven Approach for Sleep Apnea Detection," in IEEE Journal of Biomedical and Health Informatics, vol. 22, no. 4, pp. 1036-1045, July 2018.
42 D. Dao et al., "A Robust Motion Artifact Detection Algorithm for Accurate Detection of Heart Rates From Photoplethysmographic Signals Using Time–Frequency Spectral Features," in IEEE Journal of Biomedical and Health Informatics, vol. 21, no. 5, pp. 1242-1253, Sept. 2017.