Container terminals competitive factors
– results of an international survey
Adam Kaliszewski1,3, Arkadiusz Kozłowski2, Janusz Dąbrowski1, and Hanna
Klimek1
1University of Gdańsk, Faculty of Economics, Institute of Maritime Transport and Seaborne
Trade, Poland
2University of Gdańsk, Faculty of Management, Department of Statistics, Poland
Abstract. Container terminals require continuous benchmarking of competitiveness factors. This paper discusses factors of competitiveness with a main focus on feeder and mixed terminals (in which both feeder and transshipment services are provided). Method statement includes an economic literature review with respect to competitiveness factors and a container port expert survey process to achieve a list of most important factors among global container port operators. Experts were selected from different countries and private container terminals. A questionnaire was developed and sent online to them. Questions required both a ranking of factors as well as assigning monetary values to critical variables. Responses were analyzed using a pre-established strategy. Overall, experts ranked first the role of market related competitiveness factors related to service quality, price level and adaptability to the changing market environment. Intermodal links and general hinterland connections factors were more often mentioned than factors relating to nautical accessibility or other factors. Both assignment of monetary values as well as ranking have produced mutually coherent results. The paper does not claim to be definitive; it aims to provide an update of competitive factors hierarchy and highlights issues for further port development.
1 Introduction
Container terminals are functioning within a framework of constant change resulting from globalization of supply chains, changing alliances among shipping lines and competition for better access to hinterland markets. As year 2017 resulted in more vessel capacity consolidation among shipping lines community, ports worldwide face a problem of shrinking direct customer base and frequent changes to the port compositions of the main loops of major world trade routes. This trend continues in
2018 as Japanese carriers (K Line, MOL and NYK) form ONE alliance from 1st
April. This situation increases operational risk that the less competitive ports can suddenly be left out without any container volumes, while it is not possible to dispose of surplus assets or excess debt in the short term. Thus, a careful monitoring of competitiveness parameters is needed. Looking from a single point of view, in a given container terminal, it is not often evident what should be done in order to increase competitiveness. In this paper C-level executives share their views regarding current level of competitive determinants, as well as give insights into hierarchy of these factors. By aggregation of these individual and independently collected views from various corners of the world, to a certain extent, individual biases are smoothed out and a clearer picture emerges of what matters most in this industry [1].
2
Competitive factors in port literature
Parola et al. [2] reviewed economic journals for a 32-year period (1983-2014) searching for words ‘competitiveness’, ‘selection’, ‘choice’ in combination with the term ‘port’. Based on results from top 25 journals and their impact factor a total of 39 drivers have been reported. The top ten drivers in decreasing order of relevance are following: port costs, hinterland proximity, hinterland connectivity, port geographical location, port infrastructures, operational efficiency, port service quality, maritime connectivity, nautical accessibility and port site.
Haezendonck et al. [3] have proposed 25 determinants related to both cost related determinants as well as qualitative non-costs elements that have been studied during a survey of port experts for port of Antwerp, in the Hamburg-le Havre port range. These determinants include: 1) port infrastructure, 2) port superstructure, 3) port labor (human capital), 4) logistical techniques and communication systems, 5) intra-port competition, 6) inter-port competition, 7) intra-port co-operation, 8) extra-port co-operation, 9) client-relationships in the extra-port, 10) client-relationships outside the port, 11) local government intervention, 12) regional government intervention,13) (supra)national government intervention, 14) port supporting services, 15) activities maritime accessibility, 16) shipping, 17) transshipment, 18) warehousing, 19) value added logistics, 20) manufacturing, 21) activities by agents, forwarders etc., 22) distribution activities within port, 23) road transport, 24) rail transport, 25) inland navigation. These determinants were tested during a field survey with 75 face-to-face interviews.
Tongzon [4] proposed eight determinants of competitiveness with a view of a logistic hub centered around a seaport, with port of Singapore being a world class example of a well-functioning system in the South East Asia. These determinants include: 1) port (terminal) operation efficiency level, 2) port cargo handling charges, 3) reliability, 4) port selection preferences of carriers and shippers, 5) the depth of the navigation channel, 6) adaptability to the changing market environment, 7) landside accessibility, 8) product differentiation.
factors that support business strategy of Turkish ports: customer care, service customization and bundling, service expansion, service diversification and auxiliary services.
The competitiveness determinants of seaports have been directly and indirectly subject of academic research, including Burns [6], Defilippi [7], Fan et al. [8], Haralambides [9], Heaver et al. [10], Magala and Sammon [11], Ng [12], Notteboom and Rodrigue [13], Wan and Zhang [14], Yap and Notteboom [15], Yuen et al. [16].
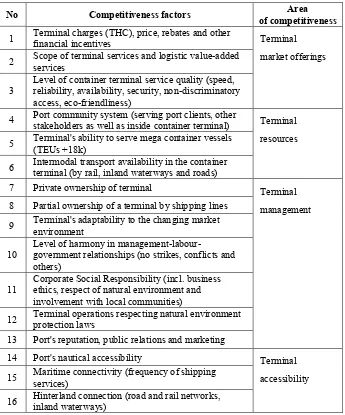
[image:3.482.75.420.219.634.2]In light of literature review, there is a high degree of commonality among competitiveness determinants. Thus, for the purpose of expert survey, a set of 20 factors has been proposed in Table 1 that incorporates most of above findings.
Table 1. The competitiveness factors applied to the expert survey.
No Competitiveness factors of competitiveness Area
1 Terminal charges (THC), price, rebates and other financial incentives Terminal market offerings 2 Scope of terminal services and logistic value-added services
3 Level of container terminal service quality (speed, reliability, availability, security, non-discriminatory access, eco-friendliness)
4 Port community system (serving port clients, other stakeholders as well as inside container terminal) Terminal resources 5 Terminal's ability to serve mega container vessels (TEUs +18k)
6 Intermodal transport availability in the container terminal (by rail, inland waterways and roads)
7 Private ownership of terminal Terminal
management 8 Partial ownership of a terminal by shipping lines
9 Terminal's adaptability to the changing market environment
10 Level of harmony in management-labour-government relationships (no strikes, conflicts and others)
11 Corporate Social Responsibility (incl. business ethics, respect of natural environment and involvement with local communities)
12 Terminal operations respecting natural environment protection laws 13 Port's reputation, public relations and marketing
14 Port's nautical accessibility Terminal
accessibility 15 Maritime connectivity (frequency of shipping services)
17 Port authority charges, price and pricing strategies External business
environment 18 Fast customs and admin clearance of cargo, incl. port's regulations and customary duties
19 Shipping lines concentration level (M&A, alliances) and changes in shipping lines' preferences
20 Supportive government active in promoting ports and logistics transport policies
3 Method statement
In contrast to Esmer et al. [5] this survey was intended for an international usage. The target group contained experts currently working in container terminals, mostly managed by multinational port operators from private sector. With a view to shorten data collection process across different time zones, instead of face-to-face or telephone interviews, an online survey was conducted. Experts have been selected among C-level managers of international port operators. This survey is of explanatory nature, with main purpose of learning what factors matter most to container terminal competitiveness level. First question asked respondents to rank among 20 factors in order of decreasing importance. The second question aimed to differentiate responses in light of monetary weight assigned to each of the factors. As human nature responds in a more cautious way once money is at stake, especially taking into account behavioral effects of endowment and loss aversion with respect to money that respondents already have [17]. In this survey they were asked to expense USD 100 among 20 factors. Then respondents were asked to specify terminal type (feeder, mixed with transshipment over 10% and pure transshipment terminal with min. 80% transshipment share).
The online survey has been conducted from 15th February 2018 to 14th March
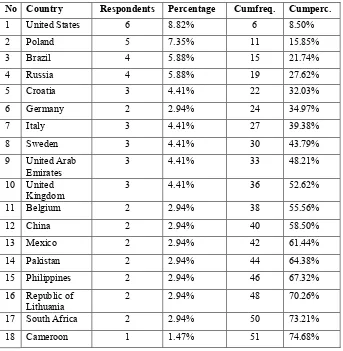
2018, mainly among executive level members of LinkedIn port and container terminal online communities. Respondents have provided a total of 68 rankings of competitiveness factors, including 39 responses regarding monetary weights. Within that figure 30 respondents have chosen to provide full responses. In order to map an approximate location of respondents based on their computer (or smartphone) IP numbers a freegeoip.net service have been consulted to search the geolocation associated to cities along with other relevant information like time zone, geographical latitude and longitude. Thus, a total of 68 responses related to respondents located in 35 countries, incl. Africa, Asia, Europe and Americas.
4 Results of the survey
4.1 Statistics of respondents and container terminals
The survey was anonymous thus 30 exact international container terminals could be identified out of total 68 respondents that ranked competitive factors. This sample represents a widespread geographic range of expert opinions, also including voices from less developed countries.
Survey respondents represent voices from container terminals in Russia (3 terminals), Poland (2 terminals), China (2 terminals), Italy (2 terminals), United States (2 terminals) and terminals in Brazil, Cameroon, Croatia, DR Congo, France, Germany, Iraq, Madagascar, Mexico, Panama, Philippines, Qatar, Republic of Korea, Republic of Lithuania, Slovenia, Sri Lanka, Sweden, United Kingdom and Vietnam.
[image:5.482.73.416.277.628.2]Among above mentioned terminals 14 of them represent feeder terminals with gateway containers, 13 mixed terminals (with both gateway containers and min. 10% transshipment share) and 3 pure transshipment terminals (min. 80% transshipment share). Thus, feeder and mixed terminals dominate among sampled respondents. The ownership of these terminals is private, as no managers representing public bodies have been selected for this survey. It helps with a more focused and homogenous interpretation of the results. In effect this survey captures the voice of the private sector container terminal operators, with more common management and business approach. The total number of experts who have participated in this research, as per country affiliation, is presented in the Table 2.
Table 2. Container terminal experts per country of reply.
No Country Respondents Percentage Cumfreq. Cumperc.
1 United States 6 8.82% 6 8.50%
2 Poland 5 7.35% 11 15.85%
3 Brazil 4 5.88% 15 21.74%
4 Russia 4 5.88% 19 27.62%
5 Croatia 3 4.41% 22 32.03%
6 Germany 2 2.94% 24 34.97%
7 Italy 3 4.41% 27 39.38%
8 Sweden 3 4.41% 30 43.79%
9 United Arab
Emirates 3 4.41% 33 48.21%
10 United
Kingdom 3 4.41% 36 52.62%
11 Belgium 2 2.94% 38 55.56%
12 China 2 2.94% 40 58.50%
13 Mexico 2 2.94% 42 61.44%
14 Pakistan 2 2.94% 44 64.38%
15 Philippines 2 2.94% 46 67.32%
16 Republic of
Lithuania 2 2.94% 48 70.26%
17 South Africa 2 2.94% 50 73.21%
19 Colombia 1 1.47% 52 76.15%
20 Denmark 1 1.47% 53 77.62%
21 France 1 1.47% 54 79.09%
22 Georgia 1 1.47% 55 80.56%
23 Iraq 1 1.47% 56 82.03%
24 Ivory Coast 1 1.47% 57 83.50%
25 Madagascar 1 1.47% 58 84.97%
26 Netherlands 1 1.47% 59 86.44%
27 Panama 1 1.47% 60 87.91%
28 Papua New
Guinea 1 1.47% 61 89.38%
29 Republic of
Korea 1 1.47% 62 90.85%
30 Singapore 1 1.47% 63 92.32%
31 Slovenia 1 1.47% 64 93.79%
32 Spain 1 1.47% 65 95.26%
33 Sri Lanka 1 1.47% 66 96.74%
34 Ukraine 1 1.47% 67 98.21%
35 Vietnam 1 1.47% 68 100.00%
Total 68 100.00%
4.2 Statistics of survey questions
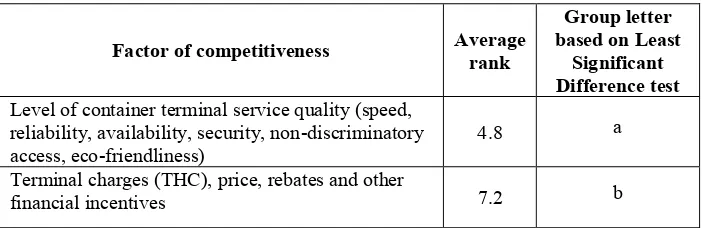
[image:6.482.65.416.499.613.2]The respondents have provided replies by ranking each of the factors on a position from 1 to 20. Note that individual replies have been averaged and a global ranking is shown in Table 3.
Table 3. Ranking of competitiveness factors.
Factor of competitiveness Average rank
Group letter based on Least
Significant Difference test Level of container terminal service quality (speed,
reliability, availability, security, non-discriminatory
access, eco-friendliness) 4.8
a
Terminal charges (THC), price, rebates and other
financial incentives 7.2 b
Intermodal transport availability in the container
terminal (by rail, inland waterways and roads) 8.4 bc Hinterland connection (road and rail networks,
inland waterways) 8.8 bc
Scope of terminal services and logistic value-added
services 8.8 bcd
Port's nautical accessibility
9.8 cde
Maritime connectivity (frequency of shipping
services) 10.0 cdef
Terminal's ability to serve mega container vessels
(TEUs +18k) 10.5 def
Terminal's adaptability to the changing market
environment 10.9 efg
Fast customs and admin clearance of cargo, incl.
port's regulations and customary duties 11.0 efg Port community system (serving port clients, other
stakeholders as well as inside container terminal) 11.3 efgh Port authority charges, price and pricing strategies
11.5 fghi Shipping lines concentration level (M&A, alliances)
and changes in shipping lines' preferences 12.8 ghij Level of harmony in
management-labour-government relationships (no strikes, conflicts and
others) 12.9
hij
Port's reputation, public relations and marketing
12.9 ij
Supportive government active in promoting ports
and logistics transport policies 13.2 jk Partial ownership of a terminal by shipping lines
14.9 kl
Terminal operations respecting natural environment
protection laws 15.6 l
Corporate Social Responsibility (incl. business ethics, respect of natural environment and
involvement with local communities) 15.8
l
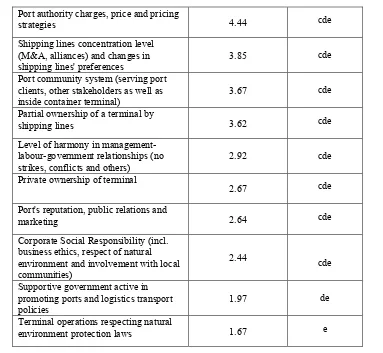
Private ownership of terminal
Above result can be compared with results from the second question regarding allocation of USD 100 into twenty competitive factors. Respondents have not been limited to the way this allocation is done. Values from all responses are counted and compared to the total USD amount for all factors. As responses are consistent the ranking in Table 4 is similar to the ranking in Table 3. In both approaches respondents have indicated that terminal offering (including service level, level of prices and access to hinterland) matter most. Other factors in this sample carry less importance. Perhaps, if sample comprised of more pure transshipment terminals, such issues as ability to serve mega vessels TEUs +18k and nautical access would have gained importance. Softer factors like social corporate responsibility, government support and environment protection are not yet crucial for achieving quarterly and annual volume and profit targets, thus lower positions reported.
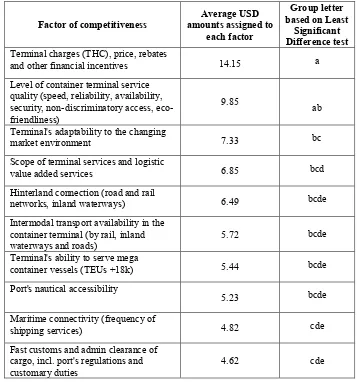
Table 4. Ranking of competitiveness factors based on assignment of nominal USD 100 amount per each respondent.
Factor of competitiveness amounts assigned to Average USD each factor
Group letter based on Least
Significant Difference test Terminal charges (THC), price, rebates
and other financial incentives 14.15 a Level of container terminal service
quality (speed, reliability, availability, security, non-discriminatory access, eco-friendliness)
9.85 ab
Terminal's adaptability to the changing
market environment 7.33 bc
Scope of terminal services and logistic
value added services 6.85 bcd
Hinterland connection (road and rail
networks, inland waterways) 6.49 bcde
Intermodal transport availability in the container terminal (by rail, inland
waterways and roads) 5.72 bcde
Terminal's ability to serve mega
container vessels (TEUs +18k) 5.44 bcde Port's nautical accessibility
5.23 bcde
Maritime connectivity (frequency of
shipping services) 4.82 cde
Fast customs and admin clearance of cargo, incl. port's regulations and
customary duties 4.62 cde
Port authority charges, price and pricing
strategies 4.44 cde
Shipping lines concentration level (M&A, alliances) and changes in
shipping lines' preferences 3.85 cde
Port community system (serving port clients, other stakeholders as well as
inside container terminal) 3.67 cde
Partial ownership of a terminal by
shipping lines 3.62 cde
Level of harmony in management-labour-government relationships (no
strikes, conflicts and others) 2.92 cde Private ownership of terminal
2.67 cde
Port's reputation, public relations and
marketing 2.64 cde
Corporate Social Responsibility (incl. business ethics, respect of natural environment and involvement with local communities)
2.44 cde
Supportive government active in promoting ports and logistics transport
policies 1.97 de
Terminal operations respecting natural
environment protection laws 1.67 e
[image:9.482.55.438.64.417.2]The order of factors in Table 3 and Table 4 results from the average ranking position and the assigned USD amount respectively. However, as the number of respondents was limited, thus the classification obtained does not have to be the same as it would have been obtained had the whole population of container terminal managers worldwide been examined. In order to verify if, on the basis of the obtained results, it is possible to infer in some measure about the importance of particular factors in view of port managers, appropriate statistical tests have been performed. First, it was checked if the ranking performed by the respondents gives grounds for stating that certain competitiveness factors were significantly statistically more frequently selected at higher places than others. Table 5 contains the results of the Friedman test, checking if the average ranks for at least one pair of factors are significantly different from each other.
Table 5. Results of Friedman test.
Test statistics Df p-value
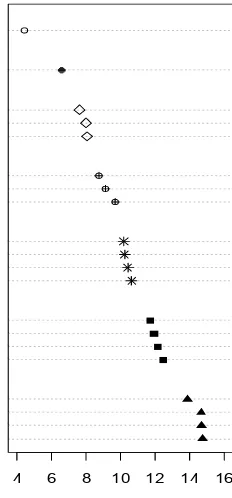
The P-value for the test statistic (assuming the asymptotic chi-square distribution of the Q statistic) is practically equal to zero, which means that there are at least two such factors that have significantly different average positions in the ranking. In order to check how many and which factors have significantly different average positions in the ranking, a post hoc analysis was performed using the Least Significant Difference (LSD) criterion. The results of this analysis are presented in the last column in Table 3. Factors that do not have the same letter are significantly different from each other, while the same letter marked is not significantly different from each other. The first factor is assigned the letter "a" and it has no other factor, which means that the average position in the ranking for this factor is significantly higher than for any other factor. The next letter "b" is assigned to the next four factors, which means that the average ranks for these factors are not significantly different from each other. Groups of factors created as a result of this analysis are not disjoint, e.g. the next group "c" contains three factors from the group "b". Nevertheless, on the basis of post-hoc tests, groups of more important and less important factors can be distinguished in the opinion of port managers. This ranking of grouped factors is shown in Figure 1.
Fig. 1. Ranking of competitive factors.
In the next step, it has been tested if the average USD amounts that the respondents allocated to each factor are significantly different. To take into account the larger differences that could have occurred between the allocated amounts than between ranks, this time the analysis of variance (ANOVA) is applied. The results of the basic ANOVA test can be found in Table 6.
Private ownership of terminal Corporate Social Responsibility
Terminal operations respecting natural environment… Partial ownership of a terminal by shipping lines Supportive government ...
Port's reputation, public relations and marketing Level of harmony in management-labour-government Shipping lines concentration level
Port authority charges, price and pricing strategies Port community system
Fast customs and admin clearance of cargo
Terminal's adaptability to the changing market environment Terminal's ability to serve mega container vessels Maritime connectivity (frequency of shipping services) Port's nautical accessibility
Hinterland connection Scope of terminal services …
Intermodal transport availability in the container terminal Terminal charges (THC), price, rebates and other financial incentives
Level of container terminal service quality (speed, reliability, availability, security,non discriminatory access, eco-friendliness)
1
2
3
4
5
6
7
4 6 8 10 12 14 16
Average rang
Table 6. Analysis of Variance Table.
Df Sum Sq Mean Sq F value p-value
Respondent 38 5.1 0.14
Factor 19 6504.5 342.34 9.8 <0.001
Residuals 722 25214.1 34.92
The value of the test statistic F is very large, which results in practically zero p-value. This means that the average amounts for at least two factors are significantly different from each other. As in the previous case, a post hoc analysis was carried out. LSD, with the Bonferroni adjustment for p-values, was selected as a criterion for comparing the means. The results of this analysis are presented in the last column in Table 4. Analogously to the previous post hoc analysis, factors with the same letter are not significantly different from each other.
Partial ownership of a terminal by shipping lines Private ownership of terminal Terminal operations respecting natural environment protection laws Corporate Social Responsibility (incl. business ethics, respect of natural environment and involvement with local communities) Port's reputation, public relations and marketing Supportive government active in promoting ports and logistics transport policies Level of harmony in management-labour-government relationships (no strikes, conflicts and others) Shipping lines concentration level (M&A, alliances) and changes in shipping lines' preferences Fast customs and admin clearance of cargo, incl. port's regulations and customary duties Maritime connectivity (frequency of shipping services) Port authority charges, price and pricing strategies Port community system (serving port clients, other stakeholders as well as inside container terminal) Hinterland connection (road and rail networks, inland waterways) Intermodal transport availability in the container terminal (by rail, inland waterways and roads) Port's nautical accessibility Scope of terminal services and logistic value added services Terminal's ability to serve mega container vessels (TEUs +18k) Terminal's adaptability to the changing market environment Level of container terminal service quality (speed, reliability, availability, security,non discriminatory access, eco-friendliness) Terminal charges (THC), price, rebates and other financial incentives
0 10 20 30 40 50
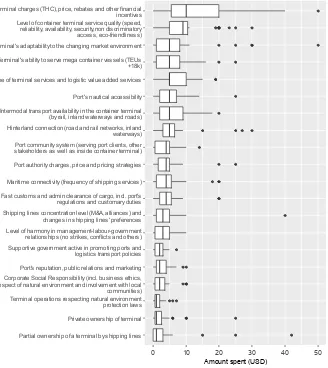
[image:11.482.87.415.258.626.2]As mentioned earlier, the order of the factors by the amount of money allocated is similar to that resulting from the ranking, however the differences between the means of the allocated amounts are not as visible as between average rankings. For example, in the analysis of groups of factors by assigned dollar amounts, the group "c" includes as many as 16 out of 20 factors, and only five groups of factors (letters from "a" to "e") were distinguished. However, in the analysis of the rankings, these groups were as many as 12 (from "a" to "l"). These results are in part due to the smaller number of responses to the question about monetary amounts than to the question about ranking. In addition, quite a large variation in the amounts allocated and their skewed distributions (see Figure 2) also have an impact on the lower statistical power of this test.
5 Discussion and conclusions
Various factors describing the competitiveness of seaports have been described in the literature so far, some of them have greater or lesser importance in the role they play in shaping port competitive capacity and resulting competitive position achieved. Despite previous attempts to organize them, there has been no study so far that would indicate the rank of individual competitiveness factors of marine container terminals worldwide. A total of 68 experts being top managers of maritime container terminals from 35 countries took part in this survey.
The results of this research indicate that in the opinion of these C-level managers operating in various seaports of the world, the most important factors affecting the competitiveness of these terminals are: level of container terminal service quality, which on average received the highest position in the ranking, and “terminal charges (THC), price, rebates and other financial incentives”, for which the average amount of money assigned was the greatest. Further, intermodal transport availability in the container terminal, hinterland connection, as well as scope of terminal services and logistic value-added services are considered important factors of competitiveness. On the other hand, for the least important factors managers recognized those related to caring for the natural environment and corporate social responsibility.
In order to get a full picture of the situation, and in particular to verify the opinions of port experts, it is necessary to conduct a similar survey among customers of container terminals, i.e. shipping lines and shippers. The results of such research will help in the development of a ranking of the most important factors of competitiveness of marine container terminals, taking into account the opinions of all participants of the port services market for containers. The conclusions from the survey, presented in the form of recommendations to interested entities (e.g. owners of container terminals, ministries shaping transport and maritime policy of the countries concerned), will be used to take steps to strengthen the competitiveness of marine container terminals in the port services markets. Such research should be carried out regularly in order to take into account the changing market situation, business environment of terminals, and in particular technical and technological progress in sea and land container transport as well as consolidation activities of container shipping lines.
References
1. J. Surowiecki, The wisdom of crowds: why the many are smarter than the few and
how collective wisdom shapes business, economies, societies and nations (2004)
2. F. Parola, M. Risitano, M. Ferretti, E. Panetti, Transport Reviews, 37, 1 (2016) 3. E. Haezendonck, J. van den Broeck, T. Jans, J Prod Anal, 36, 2 (2011)
4. J. Tongzon, Maritime Economics & Logistics, 9, 1 (2007)
5. S. Esmer, H. Nguyen, Y. Bandara, K. Yeni, The Asian Journal of Shipping and Logistics, 32, 1 (2016)
6. M.G. Burns, Port managemet and operations (2015) 7. E. Defilippi, Maritime Economics & Logistics, 6, 4 (2004)
8. L. Fan, W.W. Wilson, D. Tolliver, Maritime Economics and Logistics, 11, 4 (2009)
9. H. Haralambides, International Journal of Maritime Economics, 4, 4 (2002) 10. T. Heaver, H. Meersman, F. Moglia, E. van de Voorde, Maritime Policy & Management, 27, 4 (2010)
11. M. Magala, A. Sammons, Maritime Economics and Logistics, 10, 1-2 (2008) 12. K.Y.A. Ng, Maritime Economics & Logistics, 8, 3 (2006)
13. T.E. Notteboom, J.P. Rodrigue, Maritime Policy and Management, 32, 3 (2005) 14. Y. Wan, A. Zhang, Journal of Transport, Economics & Policy, 47, 1 (2013) 15. W.Y. Yap, T. Notteboom, Maritime Policy & Management, 38, 5 (2011) 16. A. Yuen, A. Zhang, W. Cheung, Research in Transportation Economics, 35 1 (2012)