Abstract: The wireless communication has become the essential of today’s Internet of Things (IoT) and mobile applications which is increasing exponentially in near future. These applications demand high data rate to speed up the communication among IoT or internet applications. The data rate requirement of individual application is different. To fulfill these demands of every application Long Term Evolution (LTE) integrated with femtocell technology is identified as suitable wireless technology. The running applications on a user equipment changes dynamically. Hence in dense deployment of femtocell and IoT devices, the bandwidth distribution to many active applications becomes more complicated. For multiple running applications per device with available bandwidth constraint, optimal bandwidth allocation to applications has become the most challenging issue. We include the bandwidth allocation to applications during handover of user equipment in LTE-femtocell network. The handover procedure needs efficient cell selection criteria for target cell selection.
Hence in our research we focus on bandwidth distribution among applications by proposing “Efficient Bandwidth Distribution” (EBD) mechanism and efficient cell selection by “Dynamic Cell Selection” (DCS) mechanisms to mitigate above mentioned issues.
Keywords: LTE, femtocell, EBD, DCS, Throughput, QoS, 3GPP.
I. INTRODUCTION
The capacity of wireless networks must grow continuously in order to satisfy the demand of traffic from users and applications. To support these requirements of wireless network, Long-Term Evolution (LTE) and LTE-Advanced (LTE-A) have been standardized by 3GPP [1]. LTE is targeting data rate of 100Mbits/s and 50Mbits/s in the downlink and uplink respectively. The improvements in data rate are due to enhanced channel-dependent scheduling and rate adaptation. The data rate also improved in frequency domain by spatial multiplexing with MIMO, and larger channel bandwidths of up to 20MHz [6]. The standardization of new physical air interfaces is targeting downlink pear data rates of 1Gbit/s at low mobility and 100Mbits/s at high mobility. Combining the principles of Network Functions Virtualization (NFV) with Software Defined Network (SDN) benefits for programmability and flexibility to the fore [7]. The offloading of software defined radio processing to general processing is achieved through NFV to meet the flexibility of programming [5]. Special emphasis to the 4G cellular Long-Term Evolution network is given through the
Revised Manuscript Received on December 05, 2019.
Anita B. Jadhav, Ramrao Adik Institute of Technology, Navi Mumbai, India. Email: [email protected]
Y. Srinivasa Rao, Sardar Patel Institute of Technology, Mumbai, India, Email: [email protected]
concept of Self-Organizing Network (SON). It is observed that huge amount of data is generated in the 4G networks and expected more in future due to densification. The future 4G or 5G network management is expected to provide a new set of challenges due to the need to manage very dynamic networks, need to support 1000x traffic, and 10 fold users, improve energy efficiency, need to improve the experience of the users by enabling Gbps speeds and reduced latency, need to handle heterogeneous spectrum access privileges through the LTE. In our paper we will only focus on the applications to 4G network management to meet high data rate, bandwidth optimization, handover management especially during handover and to reduce delay, bit error rate in the LTE network integrated with femtocell. In our work in order to gain higher data rate we optimize the femtocell-femtocell handover procedure in a macrocell area. To optimize the handover using bandwidth and power parameter, we proposed Dynamic Cell Selection (DCS) mechanism. Our DCS helps in load balancing among the neighboring cells by evaluating the measurement reports and selecting the suitable cell which has sufficient resources. The bandwidth measurement in DCS is computed by bandwidth requirement of users and their applications. To calculated the users and applications bandwidth requirement we proposed Efficient Bandwidth Distribution (EBD) mechanism. Our innovative models, the DCS and EBD mechanisms are simulated in NS-3. We studied and evaluated the performance of our models in terms of throughput, bandwidth, user satisfaction rate for LTE integrated with femtocell Networks. We extended our work by another approach that is MIMO antenna technique to achieve higher data rate and larger channel bandwidths of up to 20MHz. The MIMO technique is used in real time implementation for end-to-end communication using Software Define Radio. The AD9361 provides flexible sampling rate which is very wide ranging from 547 Ksps to 61.44 Msps [18]. The end-to-end communication is shown for image transmission over-the-air using MIMO 2x2 and 1x1 antenna configuration with 64 QAM Modulation schemes and 10 MHz bandwidth of LTE. Due to the limited hardware devices, we show the cell search mechanism and end-to-end communication between two user equipment. The cell search and cell detection algorithms are executed for the real time transmission and reception of application for active user.
Related work: The subcarrier allocation for guaranteed users is determined for performance analysis as a function of call arrival rates and the blocking probability was represented by analytical model [1].
Bandwidth Distribution Algorithm of
Applications in LTE-Femtocell Network
Bandwidth Distribution Algorithm of Applications in LTE-Femtocell Network
To achieve the performance objectives, Hybrid Automatic Repeat Request (HARQ) technique and different multiple input multiple output (MIMO) transmission methods are explain in [2],[15]. A distributed game-theoretic resource allocation technique was proposed by [3]. The opportunistic resource block allocation among the cells was mentioned by [4] to increase the average user throughput. Another approach called software defined radios (SDR) offload the edge devices and the base stations (BSs) by performing the signal processing operations on general computing platforms instead of hardware platforms by using multiple antennas at transmitter and receiver improve communication performance and efficiency. This functionality is achieved through Network Function Virtualization (NFV) to enable the deployment of sophisticated central algorithms [5]. The data rate also improved in frequency domain by spatial multiplexing with MIMO, and larger channel bandwidths of up to 20MHz [6]. Combining the principles of Network Functions Virtualization (NFV) with Software Defined Network (SDN) benefits for programmability and flexibility to the fore. 3GPP Release 12 includes optimization and enhancements of small cells in the dense deployment area. 7]. Different wireless communication techniques such as LTE, NB-IoT, EC-GSM, Lora, Sigfox are compared using parameters coverage, Spectrum, Bandwidth, Data rate, Battery life in [8]. The software defined radio technology for LTE transmit diversity is explained using USRP N210 and study the BER performance [9]. In [10] authors have used the RTL-SDR device to receive the signal and perform the decoding of it. The RTL-SDR device is working only as receiver, it cannot transmit the data. According to [11] Transmit diversity (TD) [14] are used in the LTE-A system to boost user performance in low signal-to-noise-ratio conditions, Space frequency coding suffers from PAPR and space time coding has reduced flexibility for the time domain encoding, both of these approaches have same performance at low speed. For resource allocation in macrocell-femtocell network a Genetic Algorithm is proposed by [12]. Femtocell is a low power, low cost, self-configurable wireless access point used to increase the coverage and capacity of the cellular network at the cell edge and indoor environment [17].
Organization: This paper is organized as follows: The notation and network utility function are defined in section II. The working of Efficient Bandwidth Distribution mechanism is presented in section III. Section IV is elaborating on the dynamic cell selection problem in LTE-femtocell network. We have shown various conditions that can be handled by EBD and DCS mechanism through illustration of numerical examples in section V. The simulation of EBD, DCS mechanism in NS3 and partial real time implementation using SDR with their numerical results are provided in section VI. At the end, we have concluded our research work with Section VII.
II. PROBLEMFORMULATION
In this section we explained all the mathematical models that we proposed for LTE-femtocell network scenario including our “Efficient Bandwidth Distribution” and “Dynamic Cell Selection” mechanism.
A. Notation and Terminology for LTE-femtocell network
Let the set of active users in an isolated LTE cell be denoted by N = {1, . . ., N} and Base Stations BS = {BS0, BS1,
. . ., BSM}. Where N is total number of users and M is the total number of base stations. Here, BS0 denotes the macro-cell Base Station and BSi, i ≠ 0, denotes the ith femto-cell Base Station. We consider the optimal resource allocation to the users in terms of OFDM sub-channels denoted by Sb = {S1,
S2, . . ., Sb}. All users can be associated to the macro-cell BS, whereas a subset of specific users is allowed access to a given femto-cell base station FBSi, i ≠ 0. Considered that FBSi ∩ FBSj
= Ø for i, j ∈ {1, . . ., M} and i ≠ j. This constraint is referred to as the “closed access” assumption. The outdoor users are considered as open access users and satisfy the constraint as (1).
(1) Where XBSidenote the users associated with base station
BSi and YBSi is the subchannel allocation to which each user in association ABSi is connected. The pair (XBSi, YBSi) denote the association (ABSi) between nth user and its allocated subchannel Sj. The vector XBSi is represented by notation (2) below. While the vector YBSi∈ (Sb) indicates the sub-channel to which each user in ABSi is associated shown by mathematical notation (3).
Where
(2)
(3)
Let us consider a function for the sub-channel index to which each user is connected (4).
(4)
B. Throughput Measurement
One of the objectives of our work is to maximize the total throughput in the microcell-femtocell network using dynamic cell selection and efficient bandwidth distribution mechanisms. The throughput is calculated using the well-known Shannon’s formula given as (5).
(5)
We considered the total orthogonal subcarriers SBS available at the base station, each with bandwidth W Hz. The SINR of a user j on subcarrier s is evaluated as (6) and (7).
(6)
where
(7)
The parameter PBS,s represents the transmit power of serving base station BS and Gj,BS,s represents the channel gain between user j and base station BS on subcarrier s. Similarly the parameter PBS’,s represents the transmit power of neighboring base station BS’ and Gj,BS’,s represents the channel gain between user j and neighboring base station BS’ on subcarrier s. The N0 is white noise power spectral density and ∆f represent subcarrier spacing. The channel gain G is represented by the path loss (PL) model based on the urban path-loss and given as (8).
(8)
Where PL is path loss between outdoor microcell users and a microcell base station PLm in dB is calculated by equation (8.1).
(8.1)
Where d is the distance between the transmitter and receiver. The variable S represents the outdoor shadowing and characterized as Gaussian distribution with standard deviation and zero mean. similarly, the path loss between an indoor femtocell users and femtocell base station PLf is computed in dB using equation (8.2). Where 0.7d shows the penetration loss of walls inside a house and d is the distance in a house.
(8.2)
III. EFFICIENT BANDWIDTH DISTRIBUTION (EBD) MECHANISM
This is our bench mark model, we proposed the mechanism for allocating the bandwidth to different applications of a user named efficient bandwidth distribution (EBD) mechanism. While distributing the bandwidth to active applications of a user we consider the dynamic priority of the applications according to user requirement. We classified all the applications broadly into 9 priority classes [18] as shown in Table I.
In EBD mechanism we proposed the bandwidth allocation from one active application to other active application depending on their required bandwidth and the priority. The priority of any application may change at any time by the user, it demands dynamic bandwidth allocation to all running applications. Our EBD mechanism allows to fetch extra bandwidth from lower priority application to the higher priority application and vice a versa explained in procedure Case-I of EBD mechanism. On the other hand, if high priority application has shortage of bandwidth then EBD allows to
fetch the allocated bandwidth from lower priority application to the higher priority application detailed in Case-II of EBD.
Table- I: QoS Classes of Applications
Prefer ence
Applications Examples Data Rate
1 NGBR_IMS IMS signaling 1mbps
2 GBR_CONV_
VOICE
Conversational voice
4-13 kbits/s
3 GBR_GAMIN
G
Real-time gaming
> 500 kbit/s
4 GBR_CONV_
VIDEO
live streaming (video
conferencing) 400 kbit/s
5 GBR_NON_C
ONV_
VIDEO
buffered streaming
20-384 kbit/s
6 NGBR_VIDE
O_
TCP_OPERA TOR
www 150
kbits/s
7 VOICE_VIDE
O
Video one-way 5-128 kbit/s
8 NGBR_VIDE
O_
TCP_REMAI NING
FTP < 384
kbit/s
9 NGBR_VIDE
O_
TCP_DEFAU LT
Email >4
kbit/s
Bandwidth Distribution Algorithm of Applications in LTE-Femtocell Network
Maximized
(9) subject to the constraint
(10)
Where xjl∈ [0,1], if application got the enough bandwidth
xjl is 1 else it is 0. The variable m is number of applications running on jth user at particular instance. We calculated the maximum bandwidth of a base station (BBSi) from system bandwidth B in terms of number of subcarriers Sb and |M| is as the number of base stations in network formulated as (11) and (12).
(11) Where
(12)
We considered XBSi as the number of active users at the base station BSi and let Bj is the total available bandwidth for the
jth user. Bajl is the bandwidth for lth application of the jth user and xjl is the weighting factor for the same application. The Bj represents bandwidth constraint for user j, which changes over time according to the active applications on it. The rate requirement (Rj) of user j, is calculated using the number of subcarriers, which can be estimated using the signal-to-interference-plus-noise ratio (SINR) as formulated below (13):
(13)
where Sj is number of subcarriers required for user j to achieve rate Rj. W denotes the bandwidth for each subcarrier. The parameter a is a constant for target bit error rate (BER) expressed by (14).
(14)
We assumed the SINR of each subcarrier is same, SINR1=SINR2=SINRSj=SINR. The number of subcarriers (Sj⸦ Sb) required by jth user can be calculated by following equations (15).
(15)
From these expressions (11 to 15) we can calculate the bandwidth (Bj) requirement of any user j as formulated in (16) with the constraint (17) on base station bandwidth BBSi.
XBSi is the number of users associated to base station BSi. BBSi is the bandwidth of a base station and W is the bandwidth of each subcarrier (15Khz) and Sj is number of subcarriers required by the user j.
(16)
subject to
(17)
Let the bandwidth allocated to the user is Bu, at a base station. It is computed as base station bandwidth (BBSi) divided by number of users |XBSi| associated to the base station in (18).
(18)
Let Bajl be the bandwidth allocated to different applications, calculated by their rate requirement at user. The rate requirement of an application (Rajl) is calculated in (19).
(19)
Where Rajl is the rate requirement for l th application of user j. There is the requirement of Pjlsubcarriers (Pjl⸦Sj) for gaining rate Rajl with subcarrier bandwidth of W. SINRjlis the signal-to-noise-plus-interference ratio of the connection between user and base station with respective to application l. The rate requirement of various application is specific hence their subcarrier allocation is varying. We have different values of subcarrier requirement Pjlaccording to number of running applications (l) computed as below (20).
(20)
If we consider the values of subcarriers for individual applications, we estimated the resultant vector for all running applications (l) as below (21).
(21)
Where
. . .
We calculated the bandwidth requirement of any application (Brjl) using following formula (22).
(22)
Estimating the bandwidth requirement of active applications on a user by (22), we allocated average bandwidth of applications to each active application at a user by (23).
(23)
The EBD mechanism allows high priority applications to fetch the extra bandwidth from one or more applications to fulfill its rate requirement.
Procedure EBD
The working of EBD is considered in two cases based on the extra bandwidth to any application and no application has extra bandwidth. Case I is executed if the sum of extra bandwidth of applications is not null, while case II is executed if the sum of extra bandwidth is null. In case I if the high priority application has less bandwidth than the required standard bandwidth then from one or more low priority application’s extra bandwidth is fetched and allocated to high priority applications and vice versa. In case II if the high priority application has shortage of bandwidth and there is no extra bandwidth for any application then bandwidth from the lower priority applications to the higher priority application is allocated. Our proposed Efficient Bandwidth Distribution mechanism is explained in detailed by procedure EBD, which calls cases I and II conditionally. In condition Case-I, we effectively handle the situation so that there is no blocking of applications, while in case-II we focus on minimizing blocking rate of low priority applications.
User may change the priority of any application during communication, so low priority application change to high priority and meets the bandwidth requirement according to our EBD mechanism. Thus, dynamically all applications have got a chance of issuing the enough bandwidth for completing their task. In case if user keep the priority same for longer period then the last few applications may be blocked during that particular time. This blocking of
applications is overcome by our EBD as soon as user changes the priority and make low priority application as high priority, blocking rate of applications is significantly reduced.
Procedure Case-I
Procedure Case-II
1.For a 1 to l do // each application 2.If Crj[a] < Rj[a] //Rj[a] required bandwidth
and Crj[a] current bandwidth
3. For r l to a by -1 do // each low priority application
4. If Exj[r] <= 0 //Add extra bandwidth of last application rth to ath application 5. If Crj[r]> (-Exj[a])
6. Crj[a] ← Crj[a]-Exj[a] //Add extra bandwidth of application rth to ath application
7. Crj[r] ← Crj[r]+Exj[a] // update current bandwidth of rth application 8. Exj[a] ← Exj[a]-Exj[a] // update extra
bandwidth of ath application
9. Exj[r] ← Crj[r]-Rj[r] // update extra bandwidth of rth application
10. Else r ← r -1 endif //step5 11. If Crj[a ]>= Rj[a]
12. Exit // for loop of a, goto step 19 13. Else r ← r -1
14. endif // of step 4 15. Else r ← r-1 16. Endif //of step 4 17. repeat step 3 18. Else a ← a+1 19. Repeat step 1 20. End Case-II 1.Initialize the l active applications on user j.
2.Consider the sequence of applications according to user priority.
3.Compute required bandwidth of active applications (Rj[l]= Brjl) using “(22)”.
4.Allocate the bandwidth to applications (Crj[l]=Bajl) using “(23)”.
5.Calculate the difference between required (Rj[l]) and allocated bandwidth of applications
Exj[l]←[Crj[l] – Rj[l]] //Exj[l] is extra bandwidth 6.Calculate Sum of above extra bandwidth
7.If Sum ← 0
8. then solution is optimal bandwidth distribution 9. Exit // goto step 17
10. elseif Sum ≥ 0
11. then call Case-I //near optimal solution 12. Exit //Goto step 17
13. elseif Sum < 0
14. then call Case-II //lowest priority applications may not get enough bandwidth 15. Exit //Goto step 17
16. endif
17. If user changed priority of any application repeat step 2
18. If number of active applications changed repeat step1
19. end EBD
1.For a 1 to l do // each application 2.If Crj[a] < Rj[a] //Rj[a] required bandwidth
and Crj[a] current bandwidth
3. For r l to 1 by -1 do // each low to high priority application
4. If (Exj[r] > 0 and (r ≠ a))
5. Crj[a] ← Crj[a]+Exj[r] //Add extra bandwidth of rth to ath application 6. Exj[a] ←Exj[a]+Exj[r] //update extra
bandwidth of ath application
7. Crj[r] ← Crj[r]-Exj[r] //update current bandwidth of rth application
8. Exj[r] ← Exj[r]-Exj[r] //update extra bandwidth of rth application
9. If Rj[a] ≤ Crj[a]
10. Exit //stop for ath application goto step 13
Bandwidth Distribution Algorithm of Applications in LTE-Femtocell Network
IV. DYNAMICCELLSELECTION(DCS) MECHANISM
In the LTE integrated with femtocell network we considered mobility to user. During the ongoing communication if a user moves from his current location to other location along a random path and observed the reduction in signal strength, it switches to other cell in its vicinity for resources, this process is called as handover. At the edge of base station user may receive signal from one or more neighboring base stations. Since the user equipment (UE) could not get the sufficient signal strength from the current base station the communication may be interrupted and unsuccessful. In such situation the UE need to select other base station from the neighboring base stations and perform handover to it. To select appropriate target base station, we used concept of dynamic depth first search method. We assumed that the user is moving randomly in particular direction instead of back and forth. For such situation the depth first search mechanism is very much suitable to identify the target cell. The advantage of depth first search over breadth first search is that the number of base stations is reduced for computation, which reduces the space and time complexity of cell selection method. Using the RSRQ measurement, channel state information of all neighboring cells is available at the UE. From this initial information user detects the suitable neighboring cells. The dynamic cell selection (DCS) mechanism puts the constraint on the required bandwidth and power parameters of cell. These parameter constraints contribute in the load balancing among base stations. Our dynamic cell selection mechanism is explained in detailed with procedure DCS.
Procedure DCS
The bandwidth utilization is calculated using the sum of bandwidths of all users on a particular base station. Suppose maximum bandwidth of a base station is BBSi according to “(11)” and the total bandwidth utilization of ith base station is
Bi. The number of users associated with ith base station are
XBSi, then the bandwidth utilization Bi is formulated as (24).
(24)
Hence the available bandwidth of a base station is calculated using (25).
(25)
Power function of base station is used to calculate the available power at base station at any instance with the constraint of total power (PBSi) of that base station. The consumed power is the sum of the powers of all users of that base station. The parameter XBSi is number of users associated to the base station, PBSi is the maximum power assigned to the base station by operator. Pi represents utilized power of base station computed as (26), Pj represents the power utilized by user j.
(26)
The unutilized power of ith base station is P(i) formulated as (27).
(27)
V. ILLUSTRATIONOFEBDANDDCSMECHANISM
In this section we focus on the numerical representation of our method through examples. We considered specific conditions to show that our mechanism works efficiently for these conditions by the solution of examples.
A. Illustration of EBD
We assume that for the given instance of applications on a user, the bandwidth distribution to applications is done using formula (23), which is considered as current bandwidth of applications. The extra bandwidth or less bandwidth is computed as difference between current bandwidth and required bandwidth of respective applications. To make the optimal bandwidth distribution of applications we apply EBD mechanism. To observed the behavior of EBD procedure at various conditions and their expected output, we created the specific situation and illustrated through numerical examples given below.
Example 1 is illustrated to represent the situation of bandwidth distribution from high priority to low priority application by case-I condition. The Example 2 shows that if there is more femtocells and more users in LTE than the capacity, the bandwidth distribution to user and to applications is insufficient. Hence the condition case-II satisfies and feasible solution of bandwidth distribution is computed by EBD mechanism.
//For a user assumed, source cell as u, target cell as v, neighbor cells are store in a queue w.
1.At each time interval t UE perform
measurement for the RSRQ of neighboring cells
2.The detected neighbor cells are stored in a queue w in nonincreasing order of RSRQ 3.For each cell v in queue w do
4.//Bu and Bv is maximum bandwidth of base station u and v respectively
5.//BW(.) is bandwidth function for base station 6.Calculate available bandwidth of
BW(u)≤BBSi(u) and BW(v) ≤BBSi(v) //by “(25)”
7. If BW(v) > BW(u) then
8. Do RSRP measurement of u and v 9.// P(.) is a power function for base station Ptu
total power of u, Ptv total power of v
10. Calculate P(u) ≤ Ptu and P(v) ≤ Ptv // using power function “(27)”
11. If P(v) > P(u)
12. Select v as target cell and perform handover from u to v
13. Exit // goto step 16
14. Else continue with source cell u
15. Else repeat step 3 for next neighbor v from w
Example 1. The five different active applications with their user priority, bandwidth requirement and application number are given below. Find the optimal bandwidth distribution of this instance using EBD mechanism on a user?
Priority 1 2 3 4 5
Application No. (a) 1 3 2 4 5
Required BW (R) 2 6 3 5 4
Solution 1.
Step 1: After considering the given values of required bandwidth of applications, further steps of EBD mechanism are used to calculated the current distribution (Cr) of bandwidth to each application by formula (23). The difference between required bandwidth and the current bandwidth is shown as extra bandwidth.
Current BW (Cr) 4 4 4 4 4
Extra BW (Cr-R) 2 -2 1 -1 0
Step 2: Knowing the extra bandwidth value, depending on the condition step 7 onwards of EBD algorithm, this instance satisfies case-I. Hence to solve the example we follow the case-I procedure iteratively as shown below. We observed that after iteration 4 extra bandwidth array for all applications is 0, it represents optimal bandwidth distribution to applications. In this example total bandwidth of user = 20 and bandwidth distributed to applications by EBD=20. It satisfies bandwidth utility function (10).
Priority 1 2 3 4 5
Application No. (a) 1 3 2 4 5
Required BW (R) 2 6 3 5 4
Iteration1 Enough bandwidth to 1st application
Current BW (Cr) 4 4 4 4 4
Extra BW (Cr-R) 2 -2 1 -1 0
Iteration2 -1 Case-I satisfies for 2nd application
Current BW (Cr) 4 4 5 4 3 4 4
Extra BW (Cr-R) 2 -2 -1 1 0 -1 0
Iteration2- 2 Case-I satisfies for 2nd application
Current BW (Cr) 4 2 5 7 3 4 4
Extra BW (Cr-R) 2 0 -1 1 0 -1 0
Iteration3 Enough bandwidth to 3rd application
Iteration4 Case-I satisfies for 4th application
Current BW (Cr) 2 7 6 3 4 5 4
Extra BW (Cr-R) 0 1 0 0 -1 0 0
Example 2. The five different active applications with their user priority, bandwidth requirement and application number are given below. Find the optimal bandwidth distribution of this instance using EBD mechanism on a user?
Priority 1 2 3 4 5
Application No. (a) 4 3 2 1 5
Required BW (R) 5 4 4 5 4
Here we consider the situation where case-II satisfies.
Solution 2.
Step 1: Similar to examples1 compute current and extra bandwidth of given applications.
Current BW (Cr) 4 4 4 4 4
Extra BW (Cr-R) -1 0 1 -1 0
Step 2: Here sum of extra bandwidth is less than zero so it satisfies the case-II condition of EBD and follow steps of case-II iteratively for given applications.
Priority 1 2 3 4 5
Application No. (a) 4 3 2 1 5
Required BW (R) 5 4 4 5 4
Iteration 1 Case-II satisfies for 1st application
Current BW (Cr) 4 5 4 4 4 4 3
Extra BW (Cr-R) -1 0 0 0 -1 0 -1
Iteration 2 Enough bandwidth for 2nd application
Iteration 3 Enough bandwidth for 3rd application
Iteration 4 Case-II satisfies for 4th application
Current BW (Cr) 5 4 4 4 5 3 2
Extra BW (Cr-R) 0 0 0 -10 -1 -2
Iteration 5 Application 5 cannot get enough bandwidth so it is block
In this example Total bandwidth of user = 20, bandwidth distributed to applications by EBD = 18. It satisfies bandwidth utility function (10) and we got the feasible solution, because last application is blocked.
B. Illustration of DCS
For the illustration of our bandwidth utility function (9) and (10) we considered more than one user with multiple applications running on them and solve the instance given in example 3.
Bandwidth Distribution Algorithm of Applications in LTE-Femtocell Network
Solution 3: Initially the bandwidth allocated to the active applications is done through procedure of EBD as:
Total bandwidth of base station (BBSi) = 90, number of users (|XBSi|) = 3.
Hence bandwidth to each user calculated by (18) is (Bu) = 90/3 = 30 mbps.
Hence the total bandwidth of each user is 30 mbps. i.e. B1= B2 = B3 = 30
Initial distribution of bandwidth by (23) to all active applications is done as:
(Bajl) = Bu/|l|= 30/3 = 10, for all l applications of each user. Hence Ba1l = {10, 10, 10}, Ba2l = {10, 10, 10},
Ba3l = {10, 10, 10},
The vector x is the solution vector for each user, and it is represented as 0 (bandwidth not allocated) or 1 (bandwidth allocated). When the Efficient Bandwidth Distribution algorithm is traced on this instance following values are obtained:
The solution vector for user 1 is x1l = {1, 1, 0} The solution vector for user 2 is x2l = {1, 1, 1} The solution vector for user 3 is x3l = {1, 1, 1} Using model (9)-(10) solution vector x for all users is used to calculate Total Bandwidth (T) of a system as:
T= (10*1+12*1+8*0) + (10*1+12*1+8*1) + 8*1+10*1+12*1)
Total Bandwidth = 82 <= 90 //True
Hence the optimal distribution of a system for this instance is 82 mbps.
With these problems we have illustrated our bench mark model (9) and (10) of EBD mechanism. Hence EBD satisfies the given constraints and distributes the available bandwidth efficiently to multiple active applications using dynamic programming method.
VI. IMPLEMENTATIONANDRESULTS
Our practical implementation includes simulation of our proposed EBD and DCS mechanism using NS3 software. We have shown through our experiment that Software Define Radio (SDR) platform is suitable to implement these kinds of mechanisms for performance analysis in real time, which we explained in following subsections.
A. Simulation of EBD and DCS in NS3
Because For practical consideration we use NS3 simulation software to implement our DCS and EBD mechanism. The DCS method is applied for the efficient handover procedure between femtocell to femtocell. The main focus of our proposed mechanism is to utilized the maximum available bandwidth among all active applications with user Quality of Service (QoS) and high system throughput. We consider a microcell including 4 femtocells with more than one user (≤5). Each user has multiple active applications. We show that user-3 is moving with constant velocity and perform handover from femtocell-1 to femtocell-2 with ongoing communication. The mobile user-3 used the DCS mechanism for efficient cell selection. The DCS evaluates the required bandwidth of all running applications on the user by the EBD mechanism. If the
[image:8.595.335.519.154.303.2]required bandwidth of a user calculated by bandwidth of all active applications on it and the available bandwidth of the target cell satisfies the criteria of enough bandwidth, handover takes place. Thus user-3 satisfies the criteria and perform the successful handover to the selected target femtocell-2. All other nonmoving users optimized the bandwidth of their applications by EBD mechanism. The simulation parameters are given in Table II.
Table- II: Simulation Parameters
Parameters Value
Total available bandwidth 200mbps eNB power transmission 46 dBm HeNB power transmission 22 dBm Adaptive modulation and
coding
best-effort
Number of mobile users 10
Number of femtocells 4
Epoch Duration 38 sec
Maximum data rate 100 Gbps
Maximum transmission units
1500
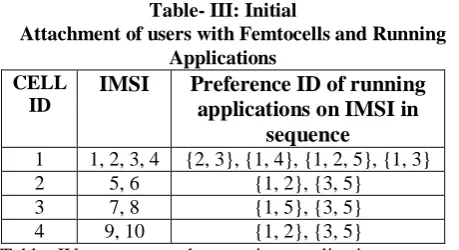
The multiple active applications on all users are shown in Table III. Table III shows the initial attachments of users to femtocell (Cell ID) and all running applications on each user (IMSI), the applications are represented according to their preference number given in the priority queue. Table III shows that row 1 has Cell ID 1, IMSI 1, 2, 3, 4 and running applications as {2,3}, {1,4}, {1,2,5}, {1,3} this means IMSI 1, 2, 3, 4 are attached to Cell ID 1. The IMSI 1 has application 2 and 3 as active application on it. Similarly, IMSI 2 has application 1 and 4 running on it and so on for all Cell IDs.
[image:8.595.315.545.503.628.2]Table III shows that row 1 has Cell ID 1, IMSI 1, 2, 3, 4 and running applications as {2,3}, {1,4}, {1,2,5}, {1,3} this means IMSI 1, 2, 3, 4 are attached to Cell ID 1. The IMSI 1 has application 2 and 3 as active application on it. Similarly, IMSI 2 has application 1 and 4 running on it and so on for all Cell IDs.
Table- III: Initial
Attachment of users with Femtocells and Running Applications
CELL ID
IMSI Preference ID of running applications on IMSI in
sequence
1 1, 2, 3, 4 {2, 3}, {1, 4}, {1, 2, 5}, {1, 3}
2 5, 6 {1, 2}, {3, 5}
3 7, 8 {1, 5}, {3, 5}
4 9, 10 {1, 2}, {3, 5}
Table- IV: Running Applications use in Simulation
Preference ID of Application
Application type
1 NGBR_IMS
2 GBR_CONV_VIDEO
3 GBR_GAMING (multi-player,
video)
4 GBR_NON_CONV_VIDEO
5 NGBR_VOICE_VIDEO_GAMING
(video)
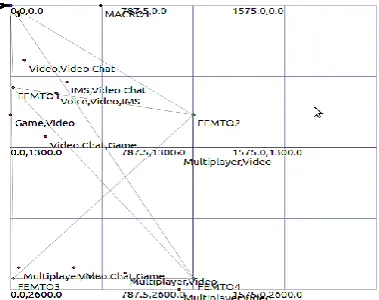
Table IV represents the running applications on user equipment during simulation. We have given preference ID to all applications, for our simulation we used first 5 applications running on different users as shown in Table III. The type of these 5 applications are given in Table IV, such as application having preference ID-1 is NGBR_IMS, preference ID-2 is GBR_CONV_VIDEO and so on. The initial scenario before handover of LTE-femtocell network is shown in Fig. 1. While the scenario after successful handover of the user is shown in Fig. 2. These are the screens captured during the simulation in Net-Anim.
Fig. 1. Scenario Before handover
The performance evaluation of the proposed algorithms DCS and EBD are done from the trace files generated using NS3 simulator. The following performance measurements are used in order to verify and compare proposed algorithms with 3GPP method. 1. Bandwidth usage, 2. System throughput, and 3. Users' satisfaction rate.
[image:9.595.339.525.60.282.2]1. Bandwidth usage Bu of the proposed system is given by the following formula (28). It is defined as the ratio of bandwidth used by all users to the total available bandwidth.
Fig. 2. Scenario After handover
(28)
The variable Bjis the bandwidth of individual user. There are
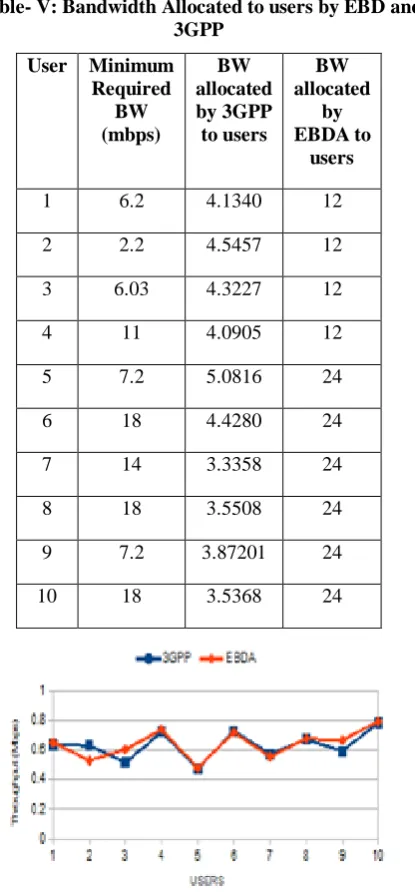
XBSi users in the system and B is the total available bandwidth of the system. The bandwidth allocation is done by EBD mechanism to maximize the objective function as given in (9). It gives better bandwidth usage than the 3GPP method. This is because the unutilized bandwidth is distributed to the needy applications using the EBD mechanism during communication. The bandwidths allocated to all users by 3GPP and the proposed algorithm EBD is shown in the Table V. The bandwidth achieved by EBD and 3GPP method is compare and shown in the Fig. 3. The average difference of bandwidth between 3GPP and EBD mechanism is 2.83292 mbps. Hence the average bandwidth allocated by the EBD is more, which increases the data rate of the users as compare to 3GPP.
Fig. 3. bandwidth comparison of 3GPP and EBD
[image:9.595.67.257.413.563.2] [image:9.595.323.534.476.608.2]Bandwidth Distribution Algorithm of Applications in LTE-Femtocell Network
Table- V: Bandwidth Allocated to users by EBD and 3GPP
User Minimum Required
BW (mbps)
BW allocated by 3GPP to users
BW allocated
by EBDA to
users
1 6.2 4.1340 12
2 2.2 4.5457 12
3 6.03 4.3227 12
4 11 4.0905 12
5 7.2 5.0816 24
6 18 4.4280 24
7 14 3.3358 24
8 18 3.5508 24
9 7.2 3.87201 24
10 18 3.5368 24
Fig. 4. Throughput comparison of 3GPP and EBD
3. User's Satisfaction rate R is given by the following formula (29), it is calculated as the ratio of sum of allocated bandwidth to demanded bandwidth of applications for user j.
(29)
Where R is the user's satisfaction rate, there are total N users in the system. Bu is the allocated bandwidth of user i and Bj is the bandwidth demand of user j. The graph of user satisfaction rate is shown in Fig. 5. for EBD and 3GPP comparison. The user satisfaction rate of EBD is calculated as 1.6531.
B. Real Time Experimental Set-Up using SDR
The Software Define Radio (SDR) platform can be used to analyze the performance of LTE-femtocell network. Hence, we used SDR to improve the LTE-femtocell network performance by Multiple Input Multiple Output (MIMO) antenna technique. MIMO is used to increase the data rate of the system so that data transmission become fast. We have done the real time experiment for the cell search and efficient cell selection using single femtocell (SDR) due to hardware
[image:10.595.306.524.86.418.2]limitations. The experimental set-up of SDR and the host machine is shown in Fig. 6.
Table- VI: Throughput of users by EBD and 3GPP User Thrpt-3GPP Thrpt-EBD
1 0.635274 0.651156
2 0.630184 0.527013
3 0.513192 0.603912
4 0.721435 0.736851
5 0.473719 0.478974
6 0.727808 0.719345
7 0.572496 0.553839
8 0.67103 0.676692
9 0.593121 0.665961
10 0.782927 0.791659
[image:10.595.313.527.437.574.2]Fig. 5. User satisfaction rate comparison of 3GPP and EBD
Fig. 6. Experimental set-up of SDR
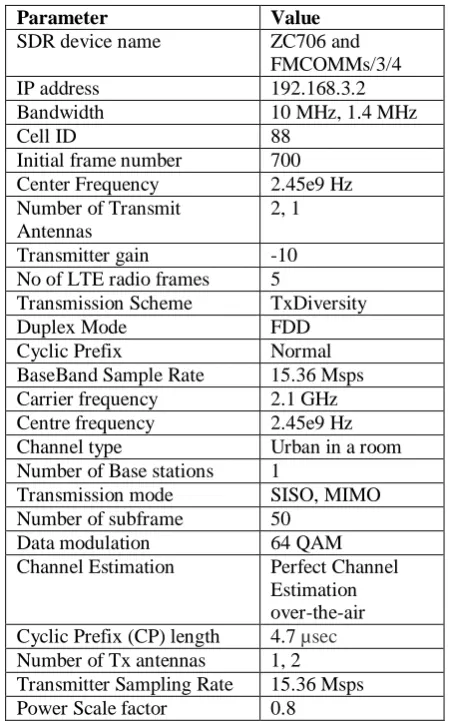
We use MATLAB communication tool box for interfacing SDR device to host machine. For the end-to-end communication using over-the-air transmission we installed the LTE System Toolbox, Communication System Toolbox support package for Xilinx Zynq-Based. We used Single Analog Device AD9361/AD9364 FMCOMMS2/3/4 and the Z-Board.
Table- VII: Experimental Set-Up Parameters for LTE-SDR
Parameter Value
SDR device name ZC706 and
FMCOMMs/3/4
IP address 192.168.3.2
Bandwidth 10 MHz, 1.4 MHz
Cell ID 88
Initial frame number 700
Center Frequency 2.45e9 Hz
Number of Transmit Antennas
2, 1
Transmitter gain -10
No of LTE radio frames 5
Transmission Scheme TxDiversity
Duplex Mode FDD
Cyclic Prefix Normal
BaseBand Sample Rate 15.36 Msps
Carrier frequency 2.1 GHz
Centre frequency 2.45e9 Hz
Channel type Urban in a room
Number of Base stations 1
Transmission mode SISO, MIMO
Number of subframe 50
Data modulation 64 QAM
Channel Estimation Perfect Channel
Estimation over-the-air Cyclic Prefix (CP) length 4.7 µsec Number of Tx antennas 1, 2 Transmitter Sampling Rate 15.36 Msps
Power Scale factor 0.8
For the experimental set up, first the basic information of the SDR device is configure as device information. The device information contains device name and the IP address of the device to check the connection with computer system. We use LTE System Toolbox of Matlab for interfacing with the hardware. The SDR device is connected to the computer using net cable and the loop back using USB connection. We configured the SDR card by selecting the correct Ethernet connection, and for xilinx zynq-based device for Matlab. For the end-to-end communication we set up the and tune the parameters of the transmitter and the receiver appropriately as mentioned below.
Transmitter Setup: We set the SDR transmitter parameters as shown in table VII. This application is configured to transmit and receive LTE MIMO on single Analog device for one-by-one and two-by-two antennas. To prepare the image file for transmission, read the data from image file scaled it and convert to a binary data stream. We scale it to form 5 LTE radio frames by scaling factor of 0.5. The binary data stream coded into multiple transport blocks to transmit in the Physical Downlink Shared Channel (PDSCH). Then the LTE baseband signal is generated using the parameter setting given in table VII. The baseband signal is scale for better power output, then it is casted to int16 which is the native format for the SDR device. The transmit antenna parameter is set 1 for 1x1 antenna scenario SDR-1 and 2 for 2x2 antenna scenario SDR-2 respectively, explained further. This LTE baseband is transmitted continuously using the transmit repeat function on the Zynq-Based Radio platform.
Receiver Setup: The sample rate of the receiver is 15.36MHz, which is a standard sample rate for capturing an LTE bandwidth of 50 resource blocks. The receiver parameters are configured similar to the transmitter. It is assumed that the transmitted PDSCH parameters are known. Using the blind cell search the MIB is decoded to get the actual cell-specific reference ports. Initially it was assumed as four (CellRefP = 4), because receiver do not have any knowledge about it. The number of resource blocks of the received waveform is obtained from the lookup table using the value of sampling rate. Channel configuration and estimation is performed using cell-specific reference signals. To minimize the noise effect a 9-by-9 averaging window is used in channel estimation. The type of pilot symbol averaging is set to ‘User Defined’, interpolation type is set to ‘Cubic’ with interpolation window type as ‘Cantered’ and the interpolation window size is set to 3. The LTE frames are captured over-the air and decoded for detailed information. By decoding the Master Information Block (MIB) correctly, system frame number is identified. Once the frame number has been determined, the PDSCH and DL-SCH are decoded and the equalized PDSCH symbols are shown. There is no data in subframe 5, therefore its captured data is ignored for decoding.
Scenario SDR-1: For 1x1 antenna
We perform end-to-end communication between 2 UEs in LTE-Femtocell Network using 1 by 1 antenna and 64 QAM modulation scheme. In this scenario UE1 is transmitting an image to UE2 using resources of femtocell (SDR device). The image is transmitted successfully by detecting the Cell ID 88 of the transmission correctly with bit error rate zero. Transmitted image is as shown in Figure 10. The received image is shown in Fig. 11.
Scenario SDR-2: For 2x2 antenna
This scenario considered end-to-end communication from UE1 to UE2 in LTE-Femtocell Network using MIMO 2 by 2 antenna and 64 QAM modulation scheme.
We used 2x2 MIMO for image transmission between UE1 and UE2, which are served by a femtocell (SDR device). We observed that the image is transmitted successfully over the air. Hence 2x2 MIMO has completed communication in this scenario gaining high data rate. The result shows that bit error rate is zero, that means it has corrected the frequency and time offset of the received signal correctly. It has detected transmitted Cell ID as 88 which we had set for the cell. Transmitted and received image is as shown in Fig. 10 and Fig. 12 respectively.
[image:11.595.56.283.77.438.2]Bandwidth Distribution Algorithm of Applications in LTE-Femtocell Network
(a). For 1x1 antenna
[image:12.595.74.537.23.725.2](b). For 2x2 antenna
Fig. 7. Spectrum Scope- Power Spectral Density of received LTE baseband signal
[image:12.595.70.269.50.340.2]
(a). 1x1 (b). 2x2
Fig. 8. Constellation diagram: Equalized PDSCH Symbols of 64 QAM
(a). 1x1
(b). 2x2
[image:12.595.368.493.53.157.2]Fig. 9. Channel estimation of frequency response for 64QAM
[image:12.595.313.537.54.660.2]Fig. 10. Transmitted image
Fig. 11. Received image 1x1
Fig. 12. Received image 2x2
Table- VIII: Comparison of Image Transmission Using 1x1 and 2x2 Antenna
No of Antenna
↓ Parameters 1 by 1 2by 2
BER 0.00 0.00
Number of bit errors 0 0
EVM Peak (%) 13.535 2.818
EVM RMS (%) 3.204 0.732
Frequency offset (Hz) 1.701430e+ 00
-7.888362e-0 1 Timing offset (no. of
samples)
24931 150580
No of transmitted bits 1179648 1179648
Occupied bandwidth 99% Ch-1 99%
Ch-2 99%
VII. CONCLUSION
[image:12.595.311.544.481.663.2]hoto
Through our research work we are able to (1) select the best target cell and perform handover, (2) optimally allocate the bandwidth resources among active applications, and (3) reduce the blocking rate of applications. From the simulation analysis, we observed that our algorithms are able to use 96% of the available bandwidth over 92% of the genetic algorithm (GA) based resource allocation and more than the 3GPP method. We are able to achieved better user satisfaction rate and the system throughput as compare to 3GPP method. The real time experiment has shown the successful image transmission over the air by channel estimation using MIMO antenna system. It has improved the bit error rate and utilized 99% bandwidth of the channel. Therefore, our proposed mechanisms outperform the 3GPP and GA in terms of bandwidth, user satisfaction rate and throughput of LTE integrated with femtocell networks.
REFERENCES
1. Uttara Sawant, Robert Akl, “Subcarrier Allocation in LTE Network Deployment with Mobility”, IEEE, 2017.
2. Anthony Busson, Iyad Lahsen-Cherif, Hindawi WiLer, “Impact of Resource Blocks Allocation Strategies on Downlink Interference and SIR Distributions in LTE Networks: A stochastic Geometry pproach”, Wireless Communications and Mobile Computing vol. 2018, June 2018. 3. Omid Namvar Gharehshiran, Alireza Attar, Vikram Krishnamurthy, “Collaborative Sub-Channel Allocation in Cognitive LTE Femto-Cells: A Cooperative Game-Theoretic Approach”, IEEE transactions on communications. Vol. 61, no1, January 2013.
4. Dae Kyu Shin, Wan Choi, and Takki Yu, “Statistically Controlled Opportunistic Resource Block Sharing for Femto Cell Networks”, Journal of Communications and Networks, vol. 15, No. 5 October 2013.
5. Rami Akeela, Behnam Dezfouli, “Software-defined Radios: Architecture, State-of-the-art, and Challenges”, Internet of Things Research Lab, Department of Computer Engineering, Santa Clara University, USA, March 2018.
6. K Fazel, S Kaiser, “Multi-Carrier and Spread Spectrum Systems from OFDM and MC-CDMA to LTE and WiMAX”, Second Edition, A John Wiley and Sons, Ltd, Publication, 2008.
7. Jessica Moysen, Lorenza Giupponi, “From 4G to 5G: Self-organized Network Management meets Machine Learning”, Project 5GNORM, Jan 2018.
8. Min chen, Yiming Miao, Xin Jain, Xiaofei Wang, Iztok Humar, “Cognitive-LPWAN: Towards Intelligent Wireless Services in Hybrid Low Power Wide Area Networks”, IEEE transactions on green communication and networking, 2018.
9. Kalle Ruttik, Riku Jantti, “LTE Transmit Diversity Techniques using Software-Defined Radios”, School of Electrical Engineering Thesis submitted for examination for the degree of Master of Science in Technology. Espoo 13.02.2017
10. Robert W. Stewart, Kenneth Barlee, Dale Atkinson, Louise Crockett, “Software Defined Radio using MatLab & Simulink and the RTL-SDR”, book, ACM Digital Library, 2015.
11. Gilberto Berardinelli, Troels B. Sorensen, Luis Angel Maestro Ruiz de Temino, Prebrn Mogensen, Kari Pajukoski, “Open Loop Transmit Diversity Solutions for LTE-A Uplink”, 18th European Signal Processing Conference 2010, Aalborg, Denmark, 2010.
12. Hanaa Marshoud, Hadi Otrok, Abdallah Jarray, Zbigniew Dziong, “Resource allocation in macrocell-femtocell network using genetic algorithm”, ResearchGate, Oct. 2012.
13. S. Caban, Ch. Mehlfuhler, M. Rupp, M. Wriliich, “Evolution of HSDPA and LTE”, John Wiley &Sons, 2012,
14. S. M. Alamouti, “A Simple Transmitter Diversity Scheme for Wireless Communications,” IEEE J. Select. Areas Communications, vol. 16, pp. 1451 – 1458, Oct, 1998.
15. Mohammad T. Kawser, Nafiz Imtiaz Bin Hamid, Md. Nayeemul Hasan, M. Shah Alam, and M. Musfiqur Rahman, “Downlink SNR to CQI Mapping for Different Multiple Antenna Techniques in LTE,” International Journal of Information and Electronics Engineering, Vol. 2, No. 5, September 2012.
16. Idin Motedayen-Aval, “Modeling a 4G LTE system in MATLAB”, Mathwork 2012.
17. Anita B. Jadhav, Y. S. Rao, “Double Threshold Handover Algorithm”, IEEE explorer 2015.
18. Ana Cristina Barreiras Kochem, Eliane Lucia Bodanese, “A Quality of Service Management Scheme over GPRS”, IEEE Southeast Con 2003. 19. “Quality of Service (QoS) and Policy Management in Mobile Data
Networks, Validating Service Quality to Ensure Subscriber Quality of Experience (QoE)”, white paper Ixia 915-2731-01, 2013.
AUTHORSPROFILE
Anita B. Jadhav has completed M.E. in Computer Engineering from Mumbai University. She has teaching experience more than 17 years. She is associated with UMIT SNDT Women’s University as Assistant Professor in Department of Information Technology. Currently she is perusing PhD from Mumbai University. Her area of interest is wireless communication, algorithm and complexity, numerical methods etc.