International Journal of Innovative Technology and Exploring Engineering (IJITEE) ISSN: 2278-3075,Volume-8 Issue-12, October 2019
Abstract The article discuss about designing a Raspberry Pi 3-Based OHP Temperature Calibrator. This device used to callibrate temperature measurement device with GUI-based (Graphic User Interface). The device has been programmed on Raspberry Pi 3 with Python programming language.
This research was done by and recycled over head projector (OHP), designing and conducting sensory characterization analysis and uncertainty analysis on temperature calibrator. The method used in this research is heuristic method, where this method is used in sensor characterization analysis. After the characterization done, obtaining the specifications of each sensor, temperature calibrator instrument then tested to determine the amount of uncertainty of the instrument that has been designed. The result of the homogeneity for fifth test points are 6 °C, 5 °C, 5 °C, 8 °C, and 16 °C. The results of the sensor characterization test show that the accuracy and precision of all sensors are more than 99%. The sensitivity values for the four sensors are 11.68 mV /°C, 12.34 mV /°C, 11.24 mV /° C, and 11.50 mV /° C. The correlations and linearity of all sensors are more than 97% also. And the response of time of the four sensors to the heat source are 1.61 °C/s, 1.13°C/s, 1.17 ° C / s, 1.00 °C/s. the uncertainties for sensor 1 are (132 ± 0.7)°C, sensor 2 (132 ± 0.6)°C, sensor 3 (132 ± 0.7)°C, and sensor 4 (132 ± 0.7)°C. Based on the research, it can be concluded that Raspberry Pi based temperature calibrator instrument has a good accuracy level, and the effective temperature for calibration is at maximum temperature, that is 132°C.
Keywords : temperature, callibrator, raspberry pi. I. INTRODUCTION
Temperature measurement is very important for all aspects of life, especially in industrial processes. Measuring instruments or instruments must have high accuracy and accuracy [1] – [6]. All measuring instruments are considered good if it has been proven by an instrument test, called a device calibration [7]. A standard calibration device is needed to determine the temperature value accurately.
Calibrator temperature measuring devices used in the calibration laboratory so far are dry block, dry well, and thermobath [8] – [12]. The calibrators have the same working principle, which is to produce heat at a certain calibration point and then display the temperature value on the LCD which is on one side of the calibrators, so that it can be
Revised Manuscript Received on October 05, 2019.
Iswanto, Department of Electrical Engineering, Universitas
Muhammadiyah Yogyakarta, Yogyakarta, Indonesia. Email:
Prisma Megantoro, Department of Electrical Engineering and
Information Technology, Universitas Gadjah Mada, Yogyakarta, Indonesia. Email: [email protected]
Devita Via Senzas, Department of Electrical Engineering and
Informatics, Universitas Gadjah Mada, Yogyakarta, Indonesia. Email: [email protected]
compared with the temperature value read on the test instrument that is on the input interchangeable [13] – [14]. Monitoring on the standard calibrator is still done manually, so the temperature measuring instrument calibration process will be less effective and efficient which can affect the results of the calibration device [15] – [18].
Based on these problems, it is necessary to design a temperature calibrator that serves as a reference analog measuring instrument / sensor that has an interface system and data that can be stored on the SD Card in .xls format.
II. METHOD
[image:1.595.308.547.364.424.2]The following is a block diagram of the Raspberry Pi 3-Based Temperature Calibrator Design system presented in Figure 1.
Fig. 1. Device block diagram.
The following is an explanation of the Block diagram of the Rasberry-Based Temperature Calibrator system that will be implemented. The temperature sensor is used to detect the temperature coming from the heat source of the halogen lamp in the calibrator box [19] – [25].
ADS1115 functions as an analog to digital converter (ADC), in this case the analog signal from the sensor is changed to a digital signal which is then forwarded to Raspberry Pi 3 for further processing [26].
Raspberry Pi functions as a System on Chip (SoC), which in this device functions to process the signal processing from ADS1115. Raspberry Pi also functions as a GUI so that the temperature readings from the calibrator can be displayed on monitor [24].
The LCD monitor functions as a Raspberry Pi interface, which displays temperature values on a Graphic User Interface. SD Card functions as a storage place for measurement data [21].
A. Hardware design
The design of the temperature calibrator hardware starts with testing each component to be used, then makes the design of the device, the design, and finally the working system of the measuring instrument to be made. In designing this device, the temperature sensor used is LM35. The calibrator box used is recycled from OHP to be utilized space inside and halogen lamps as a
source of heat [27] – [28].
Calibrator for Temperature Measurement
Device with Raspberry Pi-Based Interface
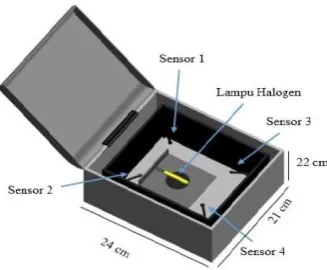
The surface shape in the OHP is irregular, so it needs to be given an additional wall to the inside of the glass so that it resembles a cube. Glass as an inner calibrator wall is coated with aluminum foil on the outside, to retain heat inside the glass and so that the light from the halogen lamp does not penetrate from the glass wall. The inner wall of the calibrator is 24.5 cm x 21 cm x 22 cm. the four sensors are placed in the order shown in the device scheme in Figure 2.
Fig. 2. Device design inside OHP.
[image:2.595.69.275.403.603.2]In designing the temperature sensor (LM35) calibrator device is connected to the module circuit contained on the PCB first. The module circuit for one sensor consists of 2 capacitors worth 1μF and 1 resistor worth 100 Ω. This circuit aims to refine the reading of the output voltage signal from the temperature sensor. Then the four temperature sensor modules are connected to ADS1115.
Fig. 3. Device schematic design.
Raspberry Pi does not have a component for signal digitization, so this component is very necessary. The ADS1115 is then connected to the Raspberry Pi using the GPIO Extension Board. The circuit scheme was created using Proteus 8.0 software which can be seen in Figure 3.
B. Software design
The design of Python for sensor testing is used to convert analog signals on temperature sensors into digital signals which will be processed using the Python program on Ranspberry Pi. The measurement results will then be displayed on a 20-inch LCD Monitor and stored on the SD card in the form of .xls file format. Next in Figure 4 is a Python program flowchart on the Raspberry Pi.
Fig. 4. System flow chart program
III. IMPLEMENTATION
To implement the device under actual conditions it is necessary to test the measurement or detection performance of the sensor and test the overall function.
[image:2.595.323.530.494.638.2]The design of temperature calibrators using Python on Raspberry Pi aims to display temperature measurement results in the UI. The results of the Python UI program in the design of the temperature calibrator can be seen in Figure 5.
Fig. 5. UI display on device operational.
International Journal of Innovative Technology and Exploring Engineering (IJITEE) ISSN: 2278-3075,Volume-8 Issue-12, October 2019
Next is the entry column "number of sampling" used to enter the sampling number of data collection that has been determined. The "Inteval Sampling" column is used to enter the number of sampling intervals for data collection with a minimum value of 1 and its multiple. If this column is filled with the number 0 (zero), then the program execution interval carried out by Raspberry Pi is dependent on the process run by Raspberry Pi. The fewer processes that are run, the faster the sampling interval will be. This is because the Raspberry Pi is not a Real Time Embedded System. Raspberry will not execute the next program when the first program is not finished. In this case, Raspberry Pi is more precisely called the System on Chip in the form of a Single Board Computer. Then the "fetch to" column functions as a display of the measurement number that is currently running. Standard temperature readings are done manually and then analyzed
using matlab and .xls. From the results of this test it can be concluded that the UI can function properly.
A. Static Character of Temperature Sensors
This test is conducted to determine the static and dynamic character of all sensors used. Static characters tested are; regression equations, accuracy, precision, sensitivity, correlation, linearity.
[image:3.595.230.508.276.498.2]Static character test results are presented in Table 1, showing that all sensors have good characters with a high enough value. The average value of all sensors for; accuracy, precision, sensitivitas, correlation, and linearity are; 99,5% , 99,9%, 11.69%, 98.55%, 99.84.
Table- I. Sensors static characters No.
sensor
Regression equation R2 Accuracy
(%)
Precision (%)
Sensitivity (mV/°C)
Corellation (%)
Linearity (%)
1 y = 0.0128x + 14.355 0.9847 99,54 99,97 11,68 98,95 99,86
2 y = 0.0121x + 14.379 0.9854 99,56 99,98 12,34 98,95 99,87
3 y = 0.0133x + 13.582 0.9799 99,49 99,98 11,24 98,45 99,84
4 y = 0.0131x + 16.608 0.9721 99,41 99,98 11,50 97,86 99,81
The following graph is the uncertainty presented in Figure 9.
B. Dynamic Character of Temperature Sensors
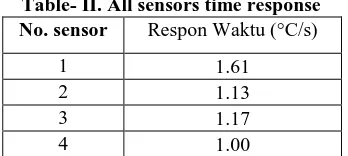
[image:3.595.88.262.594.672.2]Dynamic sensor characterization is done by testing the sensor response to a heat source during a specified time interval. Response time analysis aims to determine the response of each sensor in detecting heat within a certain time. Sensor testing for response time is done by reading the temperature on the sensor when the halogen lamp is turned off in a certain time interval as t0 or initial time. In this test the time interval for t0 is 11 seconds. Then the halogen lamp is turned on until the sensor reads at the desired temperature point as the settling time. The maximum temperature of the test response time used in this test is 78 °C, after that the temperature is conditioned to be stable in 78 °C for approximately 11 seconds. The data obtained is then processed so as to produce response times for each sensor as in Table 2.
Table- II. All sensors time response No. sensor Respon Waktu (°C/s)
1 1.61
2 1.13
3 1.17
4 1.00
All sensors show different temperature readings when the temperature of the halogen lamp is below 100 ° C and sensor 1 always shows the highest temperature reading, but at the final testing point when the temperature of the halogen lamp is maximum, all sensors show linear results with thermocouple.
A graph stating the relationship between the measurement number and temperature is presented in Figure 6.
Fig. 6. Time response of all temperature sensors. Based on the graph in Figure 6 it can be seen that sensor 1, sensor 2, sensor 3, and sensor 4 have a precise response time.
Based on the characterization test using the heuristic method, it can be seen that the sensor temperature and thermocouple temperature will be the same when the temperature of the calibrator reaches its maximum point. At the beginning, the temperature sensor and thermocouple showed significantly different values up to 15 °C. Thus, the optimal point for the temperature of the calibrator to calibrate the temperature is when the temperature in the calibrator reaches a maximum point of 132 °C.
C. Error and Uncertainty
IV. CONCLUSION
Based on the results of research using the heuristic method by devising of Raspberry Pi-based temperature calibrators made by the author, it can be concluded that:
1) The working principle of the temperature calibrator using the OHP-based Raspberry Pi 3 recycle in general, comparing the results of the calibrator temperature reading with the temperature reading of the k-type thermocouple device, with the heat source used is the OHP halogen lamp, then the temperature reading results are displayed on UI that can be saved in .xls format. 2) The results of this study can be seen that the temperature
calibrator that has been designed has an inhomogeneous value for test point 1, test point 2, test point 3, test point 4 and test point 5 namely 6 °C, 5 °C, 5 °C, 8 °C, and 16 °C. The accuracy value of the four sensors is 99.54%, 99.56%, 99.49%, and 99.41%. The precision values are 99.97%, 99.98%, 99.98% and 99.98%. The sensitivity values for the four sensors are 11.68 mV/°C, 12.34 mV/°C, 11.24 mV/°C, and 11.50 mV/°C. correlation of the four sensors is 98.95%, 98.95%, 98.45,% 97.86%. the linearity of the four sensors is 99.86%, 99.87%, 99.84% and 99.81%. And the response time of the four sensors to the heat source is 1.61 °C/s, 1.13 °C/s, 1.17 °C/s, 1.00 °C/s.
3) Raspberyy Pi-based temperature calibrator have extended uncertainty at the maximum test point for sensor 1 which is 0.7 °C, sensor 2 which is 0.6 °C, sensor 3 which is 0.7 °C and for sensor 4 which is 0.7 °C. so the uncertainty can be reported for sensor 1, i.e. (132 ± 0,7) °C, sensor 2 (132 ± 0,6) °C, sensor 3 (132 ± 0,7) °C, dan sensor 4 (132 ± 0,8) °C.
REFERENCES
1. Djatmiko, Wisnu,, 2017, Prototipe Resistansi Meter Digital, Jurnal Penelitian, Universitas Negeri Jakarta, Jakarta.
2. Fraden, Jacob, 2004, Handbook of Modern Sensors third Edition, Springer, USA
3. Halvacree, Gareth,, 2016, Raspberry Pi User Guide 4th edition, John Wiley & Sons, UK.
4. Howart, Preben dan Fiona, Redgrave., 2005, Metrologi: Sebuah Pengantar, Edisi ke-2, (Diterjemahkan oleh: A. Praba Drijarkara dan Ghufron Zaid) Pusat Penelitian Kalibrasi Puslit KIM-LIPI, Tangerang Selatan.
5. Karvinen, Kimmo dan Tero Karvinen, 2014, Getting Start With Sensors, Maker Media, California
6. Kurniawan, Agus,, 2016, Getting Started with Raspberry Pi 3, PE Press, Berlin.
7. Kurniawan, Deni,, 2008, Regresi Linier, R Developement Core Team, Austria.
8. Morris, Alan , 2001, Measurement and Instrumentation Principles, (Third Edition), Butterworth-Helnemann, India.
9. Murti, Sri,, 2017, Pembuatan Dan Analisis Alat Ukur Arus - Tegangan Listrik Dc Beserta Data Logger Berbasis Arduino Uno Pada Sistem Kontrol Turbin Angin Plth Pandansimo, Tugas Akhir, Sekolah Vokasi, Universitas Gadjah Mada, Yogyakarta.
10. P., Albertus Ade Bagus, 2016, Pembuatan Termostat pada Ruang Berbasis LM35 dan Arduino MEGA, Tugas Akhir, Sekolah Vokasi, Universitas Gadjah Mada, Yogyakarta,
11. Perkasa, Therzian Richard,, Helmi, Widyantara, dan Pauladie Suanto, 2014, Rancang Bangun Pendeteksi Gerak Menggunakan Metode Image Subtraction pada Single Board Computer (SBC), Journal of Control and Network Systems, No, 2, vol 3 90-97, STMIK STIKOM, Surabaya 12. Raghavendra, N, V,, dan L, Khrisnamurthy, 2013, Engineering
13. Santoso, Sigih, 2009, Panduan Lengkap Menguasai Statistik dengan SPSS, Elex Media Komputindo, Jakarta.
14. Sayuti, Achmad,, 2015, Perancangan Sistem Monitoring Suhu Menggunakan Raspberry Pi Berbasis Web Dan Android Pada Ruang Server Universitas Darma Persada, Skripsi, Fakultas Teknik, Universitas Darma Persada, Jakarta.
15. Shafiudin, Sofyan,, Fida, Jazilatur Rohma, dan Abdilla, Eka Prasetya,, 2016, Pemantauan Ruang Inkubator Penetasan Telur Ayam dengan Berbasis Telemetri Menggunakan Arduino Uno R3, Fakultas Teknik, Universitas Negeri Surabaya, Surabaya.
16. Sofyan, Muhammad,, Andjar, Puji,, dan Syaifuddin,, 2016, Alat Kalibrasi Suhu dengan Thermocouple dilengkapi Thermohygrometer, Tugas Akhir, Fakultas Teknik Elektromedik, Politeknik Kesehatan Kementrian Kesehatan Surabaya, Surabaya.
17. UU No. 2 Tahun 1981 Tentang Metrologi Legal.
18. Wulandari, Yunike., 2015, Rancang Bangun Sistem Monitoring Suhu, Kelembaban Relatif, dan Intensitas Curah Hujan Secara Real Time Berbasis Mini PC, Tugas Akhir, Fakultas Teknologi Informasi, Universitas Andalas, Padang
19. Iswanto, S. Suripto, F. Mujahid, K. T. Putra, N. P. Apriyanto, and Y. Apriani, “Energy Harvesting on Footsteps Using Piezoelectric based on Circuit LCT3588 and Boost up Converter,” Int. J. Electr. Comput. Eng., vol. 8, no. 6, 2018.
20. Iswanto, A. Maarif, O. Wahyunggoro, and A. I. Cahyadi, “Artificial Potential Field Algorithm Implementation for Quadrotor Path Planning,” Int. J. Adv. Comput. Sci. Appl., vol. 10, no. 8, pp. 575–585, 2019.
21. A. N. N. Chamim, M. E. Fawzi, I. Iswanto, R. O. Wiyagi, and R. Syahputra, “Control of Wheeled Robots with Bluetooth-Based Smartphones,” Int. J. Recent Technol. Eng., vol. 8, no. 2, pp. 6244–6247, Jul. 2019.
22. Iswanto, J. Syaftriadi, A. Nur, N. Chamim, R. O. Wiyagi, and R. Syahputra, “LED and Servo Motor Control Via Bluetooth Based on Android Applications,” Int. J. Recent Technol. Eng., vol. 8, no. 2, pp. 6227–6231, Jul. 2019.
23. K. Purwanto, Iswanto, T. K. Hariadi, and M. Y. Muhtar, “Microcontroller-based RFID, GSM and GPS for motorcycle security system,” Int. J. Adv. Comput. Sci. Appl., vol. 10, no. 3, 2019. 24. D. Hardiyanto, I. Iswanto, D. A. Sartika, and M. Rojali, “Pedestrian
Crossing Safety System at Traffic Lights based on Decision Tree Algorithm,” Int. J. Adv. Comput. Sci. Appl., vol. 10, no. 8, pp. 375–379, 2019.
25. I. Iswanto, K. Purwanto, W. Hastuti, A. Prabowo, and M. Y. Mustar, “Smart Smoking Area based on Fuzzy Decision Tree Algorithm,” Int. J. Adv. Comput. Sci. Appl., vol. 10, no. 6, pp. 500–504, 2019.
26. A. Maarif, A. I. Cahyadi, S. Herdjunanto, Iswanto, and Y. Yamamoto, “Tracking control of higher order reference signal using integrators and state feedback,” IAENG Int. J. Comput. Sci., vol. 46, no. 2, 2019. 27. Iswanto, A. Nurjanah, I. Prasojo, F. Anindiyahadi, and N. M. Raharja,
“Application of Nurse Calling Device at Sewon 1 Health Cente,” Int. J. Innov. Technol. Explor. Eng., vol. 8, no. 11, pp. 2721–2723, Sep. 2019. 28. I. Iswanto, W. S. Agustiningsih, F. Mujaahid, R. Rohmansyah, and A. Budiman, “Accumulator Charging Control with Piezoelectric Based on Fuzzy Algorithm Scheduling,” TELKOMNIKA (Telecommunication Comput. Electron. Control., vol. 16, no. 2, p. 635, Apr. 2018
AUTHORSPROFILE
Iswanto was born in Sleman, Yogyakarta, Indonesia, in
1981. He received the B.S degree and M.Eng degree from Universitas Gadjah Mada, Yogyakarta, Indonesia in 2007 and 2009. Now, he is on Phd Program at Universitas Gadjah Mada. He has been a Lecturer and Researcher in the Electrical Engineering Department at Universitas Muhammadiyah Yogyakarta since 2010. His current research is focused on formation control, path planning and Control UAV.
Prisma Megantoro was born in Sukoharjo, Central
International Journal of Innovative Technology and Exploring Engineering (IJITEE) ISSN: 2278-3075,Volume-8 Issue-12, October 2019