Abstract: Changes in land cover are inevitable phenomena that occur in all parts of the world. Land cover changes can occur due to natural phenomena that include runoff, soil erosion and sedimentation besides man-made phenomena that include deforestation, urbanization and conversion of land covers to suit human needs. Several works on change detection have been carried out elsewhere, however there were lack of effort in analyzing the issues that affect the performance of existing change detection techniques. The study presented in this paper aims to detect changes of land covers by using remote sensing satellite data. The study involves detection of land cover changes using remote sensing techniques. This makes use satellite data taken at different times over a particular area of interest. The data has resolution of 30 m and records surface reflectance at approximately 0.4 to 0.7 micrometers wavelengths. The study area is located in Selangor, Malaysia and occupied with tropical land covers including coastal swamp water, sediment plumes, urban, industry, water, bare land, cleared land, oil palm, rubber and coconut. Initially, region of interests (ROI) were drawn on each of the land covers in order to extract the training pixels. Landsat satellite bands 1, 2, 3, 4, 5 and 7 were then used as the input for the three supervised classification methods namely Support Vector Machine (SVM), Maximum Likelihood (ML) and Neural Network (NN). Different sizes of training pixels were used as the input for the classification methods so that the performance can be better understood. The accuracy of the classifications was then assessed by analyzing the classifications with a set of reference pixels using a confusion matrix. The classification methods were then used to identify the conversion of land cover from year 2000 to 2005 within the study area. The outcomes of the land cover change detection were reported in terms quantitative and qualitative analyses. The study shows that SVM gives a more accurate and realistic land cover change detection compared to ML and NN mainly due to not being much influenced by the size of the training pixels. The findings of the study serve as important input for decision makers in managing natural resources and environment in the tropics systematically and efficiently.
Keywords: Change detection, classification accuracy, land cover, remote sensing, and supervised classification.
Revised Manuscript Received on October 05, 2019
* Correspondence Author
Asmala Ahmad, Hamzah Sakidin, associate professor , Fakulti Teknologi Maklumat Dan Komunikasi (FTMK), Universiti Teknikal Malaysia Melaka (UTeM) located in Melaka, Malaysia.
Hamzah Sakidin, senior lecturer , Department of Fundamental and Applied Sciences, Universiti Teknologi Petronas (UTP) located in Perak, Malaysia.
Suliadi Firdaus Sufahani, senior lecturer , Faculty of Applied Science and Technology, Universiti Tun Hussein Onn (UTHM) located in Johor, Malaysia.
Abd Rahman Mat Amin, senior lecturer, Faculty of Applied Science, University Technology Mara, Terengganu, Malaysia.
I. INTRODUCTION
Change detection can be defined as the process of identifying differences in the state of an object or phenomenon by observing it at different times. The process is usually applied to the Earth's surface because Earth surface is changing constantly in many ways. It is very important to know how land cover has changed over time, in order to assess changes in soil structure or urban development because it provides quantitative analysis of the spatial distribution of the population of interest. It involves comparing datasets taken at different times. Remote sensing is a data acquisition tool that provides a unique perspective from which to observe large regions and global monitoring is possible from nearly any site on Earth [1]. In other words, remote sensing refers to the activities of recording, observing and perceiving objects or events at faraway places. In change detection perspective, this method is using several data of the same region in different periods to detect changes in land covers. The primary aim of the study is to determine land cover changes using multispectral dan multitemporal remote sensing satellite data. This involves investigating land covers changes based on of satellite data with medium resolution that recorded surface reflectance at approximately 0.4 to 0.7 micrometers wavelength. The satellite data consists of data measured in different spectral wavelengths. For the purpose of change detection satellite data recorded at different times for a specific place are to be used. The main outcome of this study is change detection map of different land covers. The change detection map is expected to provide information to the end-user about the degree of land or object changes in a period. This will greatly assist decision makers, especially in town planning sectors, in monitoring and planning rapidly developed urban areas.
II. LITERATUREREVIEW
A. Remote Sensing
Remote sensing can be easily understood as a technology for acquiring information about an object in a distance [2]. Remote sensing is also referred as a technology for identifying, observing and measuring an object without coming into direct contact with it. This process involves detection and measurement of radiation of different wavelengths reflected or
Monitoring Land Cover Changes in the Tropics
using Satellite Remote Sensing Data
emitted from distant objects or materials, by which they may be identified and categorized by type, substance and spatial distribution. Remote sensing uses sensors to record information by means of the radiation that is reflected from the Earth. These sensors are mounted on satellite platforms and can be either passive or active. Passive sensors respond to external stimuli. They record radiation that is reflected from Earth’s surface, usually from the sun. Because of this, passive sensors can only be used to collect data during daylight hours. In contrast, active sensors use internal stimuli to collect data about the Earth.
B. Related Works
Studies on land cover classification and change detection using satellite data has been carried out by several researchers involving different techniques in various applications.
Abd and Alnajjar [3] performed maximum likelihood classification for land covers and then implemented mapping and change detection in Johor, Malaysia. The work was carried out to detect expansion of urbanization that leads to the social and environmental problems. The outcomes were intended to help in monitoring land cover changes to control unplanned urban development Maximum Likelihood technique was used to classify south of Johor into five areas; urban area, water bodies, vegetative area, barren land and unknown area from 1995 to 2011. The supervised method was performed guided by the topographic map and Google Earth. The classification accuracy of the both data is 84.14% and 89.11%. The changes of land cover were identified by the statistical report of both data. The analysis shows that urban area has been increased by 3%, vegetative area has been decreased by 12% and barren area remained constant. Nevertheless, the number of land covers considered is only five and therefore the effectiveness of Maximum Likelihood classification for other land covers is still questionable. However, the justification of using Maximum Likelihood to detect land cover changes is not elaborated. Furthermore, since Maximum Likelihood is very much dependent on the training pixels, there is also a need to discuss such issue to better understand the performance of the Maximum Likelihood classifier.
In Turkey, Kavzoglu and Colkesen [4] studied the effects of training set size on Support Vector Machines (SVM) and Decision Trees (DT) accuracy. The methods were applied to produce land cover thematic map of the study area in Turkey for 2005. Various sizes of training data set were use in the experiment. The performance was measured using overall classification accuracy and Kappa coefficient derived from the error matrix. SVM that use radial basis functions was identify as the robust method compared to DT in the case of limited training samples. Based on the result the classification performances of SVM and DT were improved until a certain level and the difference in classification accuracy was statistically significant when training samples are limited. However, the effects of training sample size on other frequently used satellites such as Landsat may differs and are not addressed.
Jimenez et al. [5] analyzed land cover changes in the Metropolitan area of Tepic-Xalisco in Mexico from 1973 to 2015 using Landsat satellite data. The aim of the study is to
determine the best classification technique among Maximum Likelihood (ML), Support Vector Machines (SVM) and Artificial Neural Networks (ANNs) to be used in analyzing land use and cover changes. The results were validated using ground control points by means of a confusion matrix. The best results were obtained from the SVM method with Kappa coefficient above 85%. The outcome of the study indicated that urban land has grown significantly during 42 years, increasing 62 km2 and replacing agricultural areas at a rate of 1.48 km2 per year. Nevertheless, there are no further analysis to justify the reason for the superiority of SVM over ML and ANN.
Choudhury et al. [6] carried out land cover change detection in Asansol-Durgapur Development Region, India to be linked to land surface temperature (LST). Landsat 4–5 TM satellite data over the period of 1993, 2009 and 2015 were used. For Landsat 4-5 TM, band 1, 2, 3, 4, 5 and 7 were selected while band 6 which is a thermal band was omitted. For Landsat 8 OLI band 1 to 7 were chosen. Maximum Likelihood (ML) supervised classification was used to classify nine land covers within the area. Accuracy assessment of the classification was carried out by means of a confusion matrix. The overall accuracy (%) for classified images are for the year 1993 is 92.80, for the year 2009 is 90.13 and for 2015 is 91.08. The reliability of the result was derived with the help of Kappa coefficient and the values of Kappa coefficient are 0.92, 0.89 and 0.90 for the years 1993, 2009 and 2015 respectively.
III. METHODOLOGY
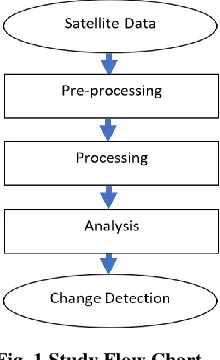
[image:2.595.376.486.516.696.2]The study area was Klang in Selangor, Malaysia, which covers approximately 540 km2 and located in the tropics within longitude 101° 10’ E to 101°30’ E and latitude 2°99’ N to 3°15’ N. Figure 1 shows the flowchart of the study. The five phases involved were satellite data as input, pre-processing, processing, analysis and change detection.
Fig. 1. Study Flow Chart.
Initially, the input were Landsat data from the year 2000 and 2005. The data were ensured to be the least contaminated by clouds and containing the land covers intended to be studied. Next, in the pre-processing phase, the data were pre-processed to ensure they were
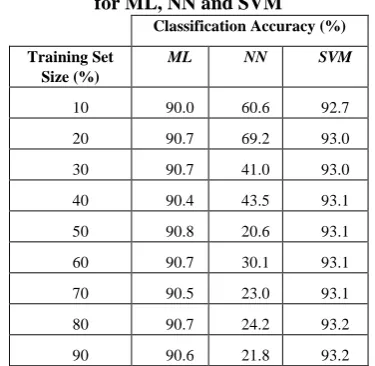
radiometric inconsistency, atmospheric effects and geometric distortion [7]. Subsequently, in the processing phase, three supervised classification methods namely Maximum Likelihood (ML), Neural Network (NN) and Support Vector Machine (SVM) were executed and evaluated [8]. In doing so, the classifiers were trained using training pixels in which were sampled based on stratified random sampling technique. This was done by dividing the entire classification image into homogeneous subgroups and then taking a simple random sample in each subgroup. 11 sets of training pixels with different sizes were extracted from the subgroups, i.e. 10%, 20%, 30%, 40%, 50%, 60%, 70%, 80% and 90% [9]–[10]. These training sets were later fed into each of the ML, NN and SVM classifiers consecutively. Classification analysis was then carried out to evaluate the classification accuracy for each method as the training set size changes. Table-I shows the training set sizes and the resulting classification accuracy for ML, NN and SVM.
Table- I: Training set size and classification accuracy for ML, NN and SVM
Classification Accuracy (%)
Training Set Size (%)
ML NN SVM
10 90.0 60.6 92.7
20 90.7 69.2 93.0
30 90.7 41.0 93.0
40 90.4 43.5 93.1
50 90.8 20.6 93.1
60 90.7 30.1 93.1
70 90.5 23.0 93.1
80 90.7 24.2 93.2
90 90.6 21.8 93.2
In the analysis phase, change detection analysis was performed quantitatively and qualitatively. Finally, change detection analysis outcomes in terms of land cover area (km2) for individual year and land cover area changes (km2) were produced as output [11]. The results for the classification analysis (phase 3) and change detection analysis (phase 4) are discussed in detail in the following sections.
IV. CLASSIFICATIONANALYSIS
In order to determine the classification performance analysis was carried out [12]-[13]. Nine sets of training pixels sampled were 10% through 90% from the original training pixels of all land covers. The classification results for 10% through 90% training set size were evaluated by using confusion matrices to assess the capability of SVM, ML and NN in classifying the 11 predefined land covers. Figure 2 shows the classification result by applying ML, NN and SVM method for two extreme cases 10% (the smallest) and 90% (biggest) training set sizes. Visually, based on qualitative visual analysis of the land cover color distribution, it is obvious that ML and SVM are capable to classify the more land covers compared to NN for both cases. For 10% training set size, NN recognizes most land covers as oil palm in which is not the case. Similarly, for 90% training set size, NN
[image:3.595.318.547.444.581.2]recognizes most land covers as rubber. For ML, it is noticeable for both cases, coconut are found far too abundant along the seaside areas and encroaches markedly towards the inland areas in which likely to be an ambiguous case. In other words, it is likely that misclassification occurs between oil palm and coconut in ML classification. It is likely that these results are due to the similarities of spectral properties between oil palm and coconut. It is also found that there is a discrepancy between the far abundant coconuts near the dryland forest for the 10% compared to the 90% training pixel. For SVM, it can be seen that the distribution of classes is rather consistent for the 10% and 90% training pixels indicating that the performance of SVM is not much influenced by the training set size. In terms of quantitative analysis, for both (10%, 90%) training set sizes, SVM (92.67%, 93.16%) has the highest overall accuracy, followed by ML (89.98%, 90.61%) and NN gives the lowest accuracy (60.64%, 21.78%). SVM and ML has a similar performance trend where the classification accuracy for 90% is higher than the 10% training set size however the performance is vice versa for NN. The accuracy differences of the extreme cases for SVM, ML and NN are found to be 0.49%, 0.62% and 38.87% respectively. This shows that SVM has higher stability when making use relatively small numbers of training data points compared to ML and NN. ML can be signified as the method that depends much on the accuracy and sufficiency of the training pixels. NN has been known as a method that does the classification not only depends on training pixels or learning the rules but its process also affluence by the network topology that encompasses the hidden layer and interconnections.
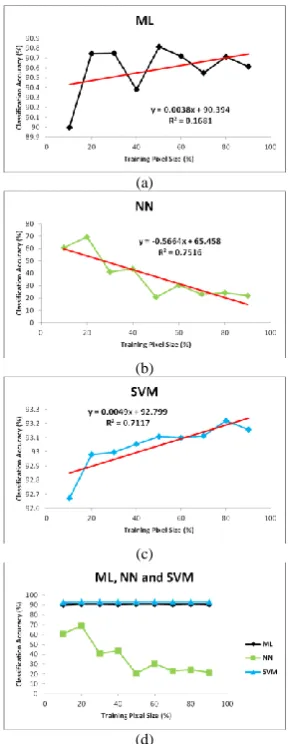
Fig. 2. Land Cover Classification using ML, NN and SVM Classification that Made Use 10% and 90% Training Set. All the results were then transformed into plots of classification accuracy versus training set size, as shown in Figure 3(a) ML, (b) NN, (c) SVM and (d) combination of a, b and c. To understand the trend further, linear regression analysis was applied to all classifications. Figure 3(a) shows plot of classification accuracy versus training set size for ML. Although fluctuating, there is somewhat an increasing trend when classification accuracy is plotted against training set size. The linear regression analysis gives R2 of 0.1681 indicating weak positive correlation between the classification accuracy and training set size. Figure 3(b) shows plot of classification accuracy versus training set size for NN. It can be seen there is a decreasing trend between classification accuracy and
analysis gives R2 of 0.7516 indicating a somewhat strong negative trend between the classification accuracy and training set size. Figure 3(c) shows plot of classification accuracy versus training set size for SVM. There is a noticeable increasing trend between classification accuracy and training set size. The regression analysis gives R2 of 0.7117 indicating a rather strong positive correlation between the classification accuracy and training set size. Figure 3(d) shows plot of classification accuracy versus training set size for ML, NN and SVM. Clearly, SVM and ML have the higher stability compared to NN in which the accuracy drops drastically as training size increases. However, SVM noticeably outperforms ML due to much higher R2 besides has the least difference in classification accuracy as training set size increases.
(a)
(b)
(c)
(d)
Fig. 3. Relationship Between Training Set Size and Classification Accuracy for (a) ML, (b) NN, (c) SVM and
(d) the Combination of ML, NN, SVM.
V. CHANGEDETECTIONANALYSIS
In this section, change detection analysis in terms of land cover area (km2) for individual year and land cover area changes (km2) between 2000 and 2005 are presented [14]–[15]. Figure 4 shows area in km2 classified using SVM for the year 2000 and 2005. In the year 2000, oil palm and bare land the largest area while industry, rubber and coconut have the smallest area. The most notable increase from the year 2000 to 2005 is experienced by urban while bare land experiences the most noticeable decrease. This is due to the
[image:4.595.334.530.136.251.2]conversion from bare land to urban due to rapid economic development [16]. This involved particularly development of residential and shop premises. Not much changes are experienced by rubber and coconut compared to oil palm due to the priority status in market. As expected, not much changes are experienced by water.
[image:4.595.101.246.236.609.2]Fig. 4. Classified area in km2 using SVM for the year 2000 and 2005.
Figure 5 shows changes in land covers area classified using SVM for the year 2000 to 2005. The points above x-axis indicate an increase in area while the points below the x-axis indicate a decrease in area. Urban increases the most while bare land decreases the most from 2000 to 2005. The decrease in bare land area is slightly more than the increase Om urban area. This is due to the fact that not all bare land areas are converted to urban since some of them are also converted to priority agriculture particularly oil palm [14].
Fig. 5. Changes in land covers area classified using SVM for the year 2000 to 2005.
[image:4.595.335.518.393.496.2]Fig. 6. Classified area in km2 using ML for the year 2000 and 2005.
[image:5.595.82.265.336.431.2]Figure 7 shows area change in km2 classified using ML for the year 2000 to 2005. Similarly, the points above x-axis indicate an increase in area while the points below the x-axis indicate a decrease in area. As discussed before, Urban and oil palm increase the most while bare land and coconut decrease the most from 2000 to 2005. The increase in urban area is more that the oil palm area while bare land and coconut decrease at about the same rate. The drastic drop in coconut from the year 2000 to 2005 seems questionable since in the actual scenario, coconut is not planted as much as being captured by ML. This is likely due to the sensitivity of ML to the selection of training pixels in which can lead to ambiguous outcome.
[image:5.595.340.524.427.521.2]Fig. 7. Changes in land covers area classified using ML for the year 2000 to 2005.
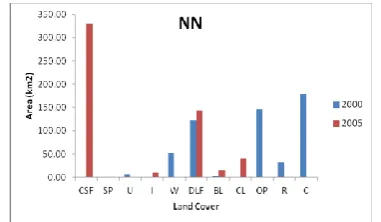
Figure 8 shows area in km2 classified using NN for the year 2000 and 2005. In the year 2000, coconut, oil palm and dryland forest are among the largest area while sediment plumes, bare land and urban are among the smallest area. For the year 2005, coastal swamp forest and dryland forest have the largest area while sediment plumes, urban, water, cleared land, oil palm, rubber and coconut have the smallest area. The outcome contradicts that of SVM and ML, as well as opposes the real situation since built-up areas were being developed substantially where forest, agricultural and unoccupied land areas are converted to urban and industrial rapidly in line with Malaysian Vision 2020.
Fig. 8. Classified area in km2 using NN for the year 2000 and 2005.
Figure 9 shows the changes of land covers area classified using NN for the year 2000 to 2005. At a glance, it can be seen that there is a considerable increase in area change for coastal
swamp forest and almost unchanged for urban and industry in which give a clearer picture of the unrealistic land cover change detection when using neural network. This is consistent with the instability of NN classification accuracy when the training pixels were varied as been revealed in the previous study.
Fig. 9. Changes in land covers area classified using ML for the year 2000 to 2005.
Figure 10 shows land cover changes from 2000 to 2005 using SVM, ML and NN. It can be clearly seen NN is noticeably discriminated from SVM and ML. SVM and ML differs main on coconut where the reduction of coconut from 2000 to 2005 is quite significant in ML compared to SVM. Based on the time series data obtained from Selangor Agricultural Department, the drop of coconut from the year 2000 to 2005 is only about 11 km2 in which closer to SVM (0.76 km2) compared to ML (67 km2). This is realistic since the time series data is meant for the whole Klang district with total area of 630 km2 whereas for this study the total area considered which is only 490 km2.
Fig. 10. Land cover changes from 2000 to 2005 using SVM, ML and NN.
VI. CONCLUSION
In this study, 11 land covers namely coastal swamp forest, dryland forest, oil palm, rubber, industry, cleared land, urban, coconut, bare land, sediment plumes and water have been considered for change detection analysis. The land covers have been classified by performing ML, NN and SVM classification where different sizes of training pixels have been used. The performance of the classifications has been evaluated using a confusion matrix by making use classified pixels and reference pixels as inputs.
SVM has been found to be the most stable even when the training set sizes varies. Subsequently, change detection based on ML, NN and SVM classification have been performed and analyzed quantitatively and qualitatively. Change detection based on
[image:5.595.78.269.611.722.2]outcome compared to ML and NN particularly for the least being affected by different sizes of training pixels. The findings of the study would serve as important inputs for decision makers in managing natural resources and environment in the tropics systematically and efficiently.
ACKNOWLEDGMENT
The authors are grateful to Universiti Teknikal Malaysia Melaka (UTeM) for providing the research funding through the UTeM Zamalah Scheme to the student involved and fully supporting this study.
REFERENCES
1. Richards, J.A. Jia, X., 2006. Remote Sensing Digital Image Analysis: An Introduction. New York, USA: Springer-Verlag Berlin Heidelberg. 2. Lillesand, T., Kiefer, R.W. and Chipman, J., 2015. Remote Sensing and
Image Interpretation. 7th Edition. New Jersey, USA: Wiley.
3. Abd, H.A.A. and Alnajjar, H.A., 2013. Maximum Likelihood for Land-Use / Land-Cover Mapping and Change Detection Using Landsat Satellite Data : A Case Study of South Johor. International Journal of Computational Engineering Research, 3(6), 26–33.
4. Kavzoglu, T. and Colkesen, I., 2012. The Effects of Training Set Size For Performance of Support Vector Machines and Decision Trees. In:
Proceeding of the 10th International Symposium on Spatial Accuracy Assessment in NaturalResources and Environmental Sciences, 10–13 July 2012, Florianopolis-SC, Brazil, pp. 1–6.
5. Jimenez, A.A., Fernando F.V., Oyolsi, N.G. and Susana M. L.M.F., 2018. Analysis of the Land Use and Cover Changes in the Metropolitan Area of Tepic-Xalisco (1973–2015) through Landsat Images.
Sustainability, 10(1860), pp. 1–15.
6. Choudhury, E., Das, K. and Das, A., 2019. Assessment Of Land Use Land Cover Changes And Its Impact on Variations of Land Surface Temperature in Asansol-Durgapur Development Region. The Egyptian Journal of Remote Sensing and Space Science, 22(2), pp. 203–218. 7. Ahmad, A. and Quegan, S., 2012. Cloud Masking for Remotely Sensed
Data Using Spectral and Principal Components Analysis. ETASR - Engineering, Technology & Applied Science Research, 2(3), pp. 221–225.
8. Ahmad, A., Hashim, U.K.M., Wahid, R.A., Sakidin, H., Sufahani, S.F, Amin, A.R.M., Abdullah, M.M and Quegan, S., 2019. Implementation of Land Cover Change Detection Based on Supervised Classifications of Multispectral Satellite Data For Leveraging Internet of Things. ARPN Journal of Engineering and Applied Sciences, 14(10), pp. 1863-1870. 9. Hashim, U.K.M and Ahmad, A., 2014. The Effects Of Training Set Size
On The Accuracy Of Maximum Likelihood, Neural Network And Support Vector Machine Classification. Science International-Lahore, 26(4), pp. 1477–1481.
10. Taufik, A., Ahmad, S.S.S. and Ahmad, A., 2016. Classification of Landsat 8 Satellite Data Using NDVI Thresholds. Journal of Telecomunication Electronic and Computer Engineering, 8(4), pp. 37–40.
11. Jensen, J.R., 2015. Introductory Digital Image Processing: A Remote Sensing Perspective. 2nd ed. New Jersey: Pearson Prentice Hall. 12. Jimenez, A.A., Fernando F.V., Oyolsi, N.G. and Susana M. L.M.F.,
2018. Analysis of the Land Use and Cover Changes in the Metropolitan Area of Tepic-Xalisco (1973–2015) through Landsat Images.
Sustainability, 10(1860), pp. 1–15.
13. Kafi, K.M., Shafri, H.Z.M. and Shariff, B.M., 2014. An Analysis of LULC Change Detection Using Remotely Sensed Data; A Case Study of Bauchi City. IOP Conference Series: Earth and Environmental Science, 20, pp. 12056.
14. Vadivelu, S., Ahmad, A. and Huoy, C.Y., 2014. Remote Sensing Techniques For Oil Palm Age Classification Using Landsat-5 TM Satellite. Science International (Lahore), 26(4), pp. 1547–1551. 15. Kumaravel, S., Ramkumar, T., Gurunanam, B., Suresh, M. and
Dharanirajan, K., 2013. An Application of Remote Sensing and GIS Based Shoreline Change Studies – A Case Study in the Cuddalore District, East Coast of Tamilnadu, South India. International Journal of Innovative Technology and Exploring Engineering (IJITEE), 2(4), pp. 211–215.
16. Dasu, M.V., Reddy, P.V.N. and Reddy, S.C.M., 2019. Classification of Landsat-8 Imagery Based on PCA and NDVI Methods. International Journal of Innovative Technology and Exploring Engineering (IJITEE), 8(10), pp. 4321–4325.
AUTHORSPROFILE
Ummi Kalsom Mohamad Hashim graduated with Bachelor of Computer Science in Artificial Intelligence from the Universiti Teknikal Malaysia Melaka (UTeM), Malaysia and currently is enrolling MSc in ICT at the same university. She is a member of the Optimization, Modelling, Analytic and Simulation (OptiMAS) research group under the Centre for Advanced Computing Technology (C-ACT) which is located at Fakulti Teknologi Maklumat Dan Komunikasi (FTMK), UTeM.
Asmala Ahmad graduated with PhD in Applied Mathematics from the University of Sheffield, United Kingdom and MSc in Land Surveying (Remote Sensing) from the Universiti Teknologi Malaysia (UTM), Malaysia. His research interests include remote sensing, image processing and artificial intelligence. He has authored and co-authored more than 80 articles in various publication platforms. He holds a professional membership from the Institution of Geospatial and Remote Sensing Malaysia (IGRSM) and is also a member of the Institute of Electrical and Electronics Engineers (IEEE). He is currently the manager of the Centre for Advanced Computing Technology (C-ACT) and an associate professor at the Fakulti Teknologi Maklumat Dan Komunikasi (FTMK), Universiti Teknikal Malaysia Melaka (UTeM) located in Melaka, Malaysia.
Hamzah Sakidin graduated with PhD and MSc in Mathematics from the Universiti Putra Malaysia (UPM), Malaysia. His research interests include applied mathematics and mathematical modelling. He holds a professional membership from the Malaysia Board of Technologists (MBOT). He is currently a senior lecturer at the Department of Fundamental and Applied Sciences, Universiti Teknologi Petronas (UTP) located in Perak, Malaysia.
Suliadi Firdaus Sufahani graduated with PhD in Mathematics from the Universiti Teknologi Malaysia (UTM) and MSc in Statistics from the University of Nottingham, United Kingdom. His research interests include mathematics, statistics and operational research. He holds a professional membership from the Malaysia Board of Technologists (MBOT). He is currently a senior lecturer at the Faculty of Applied Science and Technology, Universiti Tun Hussein Onn (UTHM) located in Johor, Malaysia.