Parallel Data Mining on Multicore Systems
Xiaohong Qiu[email protected] Research Computing, UITS Indiana University Bloomington Geoffrey C. Fox, Huapeng Yuan, Seung-Hee Bae
[email protected] [email protected] [email protected] Community Grids Laboratory, Indiana University Bloomington
George Chrysanthakopoulos, Henrik Frystyk Nielsen
[email protected] [email protected] Microsoft Research Redmond WA
Abstract
The ever increasing number of cores per chip will be accompanied by a pervasive data deluge whose size will
probably increase even faster than CPU core count over the next few years. This suggests the importance of parallel
data analysis and data mining applications with good multicore, cluster and grid performance. This paper considers
data clustering, mixture models and dimensional reduction presenting a unified framework applicable to
bioinformatics, cheminformatics and demographics. Deterministic annealing is used to lessen effect of local minima.
We present performance results on 8-core systems identifying effects from cache, runtime fluctuations,
synchronization and memory bandwidth. We discuss needed programming model and compare with MPI and other
approaches
1. Introduction
There are many important trends influencing scientific computing. One is the growing adoption of the eScience
paradigm which emphasizes the growing importance of distributed resources and collaboration. Another is the data
deluge with new instruments, sensors, and the Internet driving an exponential increase of data and the associated
data information knowledge wisdom pipeline which itself derives more bytes to worry about as in the results of
the improved architectures and increasing clock speed of the last 15 years has allowed dramatic performance
increase within a well established fixed (sequential) programming paradigm [2-4]. Understanding the data deluge is
an important problem in all areas of computing from eScience to the commodity computing such as home PC’s that
are the main driver of the semiconductor industry. Thus we posit that it is important to look at data analysis and data
mining and derive efficient multicore implementations. We would like these to be relevant for both eScience and
commodity applications. The former could involve data from high throughput instruments used in Life Sciences.
The latter includes the analysis of environmental and surveillance monitors or the data fetched from the Internet that
could characteristic a user’s interests. The RMS (Recognition, Mining, Synthesis) analysis from Intel [5, 6]
identified data mining and gaming as critical applications for multicore chips. Scientific data is likely to be so
voluminous that we need any implementation to work well on clusters of multicore chips with preferably the same
programming model for the inter-chip as well as the intra-chip parallelism. On the other hand commodity
applications might well not need cluster implementations but probably would prefer thread-based runtimes involving
managed code – Java or C#. In most cases the data is likely to be distributed and so good Grid compatibility is an
important requirement. High performance (scientific) computing has never had very sophisticated programming
environments as the field is not large enough to support a major commercial software activity. Multicore could
change the situation because of its broad importance but we then need a scientific computing programming model
that is based on one applicable to commodity systems.
Table 1. Machines used
AMD4: HPxw9300 workstation, 2 AMD Opteron CPUs Processor 275 at 2.19GHz, L2 Cache 2x1MB (for each
chip), Memory 4GB, XP Pro 64bit and Server 2003
Intel8a: Dell Precision PWS690, 2 Intel Xeon CPUs E5320 at 1.86GHz, L2 Cache 2x4M, Memory 8GB, XP Pro 64bit
Intel8b:Dell Precision PWS690, 2 Intel Xeon CPUs x5355 at 2.66GHz, L2 Cache 2X4M, Memory 4GB,
Vista Ultimate 64bit and Fedora 7
Intel8c:Dell Precision PWS690, 2 Intel Xeon CPUs x5345 2.33GHz, L2 Cache 2X4M, Memory 8GB, Redhat
Intel2a: Dell PowerEdge 860, Single CPU Dual‐Core Intel Xeon 3050 2.13 GHz, Memory 2GB, Windows Server
2003 Enterprise x64 Edition (part of 8‐node cluster)
AMD8: Dell PowerEdge 2970, 2 Quad Core Opteron 2356 at 2.3GHz, 4x512KCache, Memory 16GB, Server 2003
Our work is performed on a variety of multicore systems defined in table 1 with a total of 4 or 8 cores (summed over
chips in node) and running variants of Linux and Windows operating systems. In the following section we briefly
discuss our programming model and refer the reader to other papers [10-12] for more details. In section 3, we
discuss the data mining algorithms investigated and give some overall performance results. In section 4, we identify
parallel programming approaches. The performance is investigated in more detail in the following sections, 5 for
cache and 6 for memory bandwidth effects. Section 7 extends the results to clusters and compares thread and process
based parallelism. Section 8 has conclusions.
2. Programming Model
The trends discussed in the introduction motivate the SALSA (Service Aggregated Linked Sequential Activities) [7]
at the Community Grids Laboratory. SALSA is exploring a set of data mining applications implemented in parallel
on multicore systems. This is implemented in managed code C# with parallel synchronization from a runtime CCR
(Concurrency and Computation Runtime) developed at Microsoft Research [13, 14]. CCR supports both MPI style
synchronization and the dynamic threading essential in many concurrent commodity applications. Further there is a
service model DSS (Decentralized System Services) built on top of CCR [15]. CCR is a possible choice of runtime
that could bridge between scientific and commodity applications as it supports the key concurrent primitives used in
both of them. SALSA proposes that one builds applications as a suite of services [8, 9] rather than traditional
subroutine or class libraries. The service model allows one to support integration within grid, cluster and inter-chip
environments. Thus SALSA is exploring a possible future application (data mining) on multicore chips using a
programming model that could be used across a broad set of computer configurations and could be the basis of a
programming model that links scientific computing to commodity applications. We note that we program in a low
level style with user responsible for explicit synchronization in the fashion that is familiar from MPI. There certainly
could be general or domain specific higher level environments such as variants of automatic compilation, OpenMP,
PGAS or even the new languages from Darpa’s HPCS program [6, 16]. Our work can still be relevant as it uses a
runtime that is a natural target for such advanced high-level environments.
A critical question for any system that spans multiple different domains is performance; integration of
multiple paradigms is not so helpful unless the performance is reasonable in each paradigm. In previous papers
[10-12], we have discussed CCR and DSS and given some core performance measurements that are encouraging. Here
we focus on a broader set of applications and discuss in more detail their structure and performance. We see they
have a classic loosely synchronous structure [26] and require synchronization similar to that provided by MPI. We
explicitly compared [12] the performance of CCR with MPI for a typical “exchange” pattern where each thread
(process for MPI) exchanges information with its neighbors in a ring topology. In our implementations, we are
use of cache but allows good use of shared memory and link to familiar commodity programming models. We note
that our work uses Windows operating systems with Linux only used for (MPI) comparisons [11, 12]. We briefly
note how our results extend to Linux and other languages besides C# in section 7.
3. Data mining
In this paper we focus on a set of data mining algorithms given by a common formalism, which is defined by a
function F given in Equation (1) in terms of N data points X(x) labeled by x.
Eqn. (1) covers clustering [17-19], Gaussian mixtures [22, 23] with or without annealing and the GTM
(Generative Topographic Mapping) dimensional reduction
method. We look at clustering with deterministic annealing
(DA) and GTM in this paper. F is either directly a cost
function C to be minimized (negative of log likelihood) or in
annealing methods C-TS, the “free energy” where T is a
temperature and S is the Shannon Entropy [19]. Unlike
simulated annealing, DA involves no Monte Carlo but rather
optimizes (1) iteratively as temperature T is varied from high
to low values. DA improves on the well known K-means
clustering algorithm [20]. For DA clustering, the variables in
(1) are given by:
a(x) = 1/N, g(k)=1, s(k) = 0.5 (2) and T is temperature decreased to 1 by some schedule.
DA finds K cluster centers Y(k) where K is initially 1 and is incremented by algorithm as T decreases.
In this paper we also look at a second class of algorithms given by (1); namely dimensional scaling or the
derivation of a set of vectors vi in a metric space where the distance between vectors i and j is given by a known
discrepancy function ij. Here ij may come from the distance between points i and j in another vector space or be a
discrepancy derived from an algorithm like BLAST comparing sequences in bioinformatics. In particular, we look at
a powerful algorithm GTM developed in [21] and often used to map from high dimensional spaces to two or three
Figure 1. GTM Projections for 2 clusters found by DA in
space of 155 Chemical Properties labeled as . or + 1
2 1
( ) ln ( ) where (1)
( ) ( ) exp[ 0.5( ( ) ( )) / ( ( ))]
N x
K k
F T a x Z x
Z x g k X x Y k Ts k
dimensions for visualization. This is illustrated in fig. 1 showing the 2D GTM projection of a cheminformatics
problem with two different labels showing the mapping of two deterministic annealing clusters found by applying
(2) implemented in parallel (for DA and GTM) to points x corresponding to different chemical compound defined by
properties in 155 dimensions. GTM is closely related to SOM (Self Organizing Maps) and one of several
dimensional scaling algorithms whose parallel implementation we will discuss in further papers. In equation (1),
GTM corresponds to: 1
2 2
( ) ( ( )) with fixed (3)
( ) exp( 0.5( ) / ) (4)
M m m m
m m
Y k W
L k
a(x) = 1; g(k) = (1/K)( /2)D/2 where space D dimensional; s(k) = 1/ ; T = 1 and and Wm are varied for fixed K,
L(k), and M below. L(k), and m are vectors in the latent (2D) space.
The solution of (1) is implemented by a variation of the Expectation Maximization (EM) algorithm [22]:
written for the case of DA clustering (GTM is similar
but more complicated) where new values of cluster
centers Y(k) are calculated iteratively from probabilities
of x belonging to cluster C(k). Note these algorithms are
attractive as they combine the guaranteed decrease of F
each iteration characteristic of EM with the avoidance of
local minima coming from DA. The annealing in
temperature corresponds to a multiscale approach with
T1/D as a distance scale. The formalism described above
involves several well understood algorithms but we
believe that their integration and parallelization is novel.
Further the value of annealing which determines the
number of clusters or the number of mixture components as a function of T is not very broadly recognized.
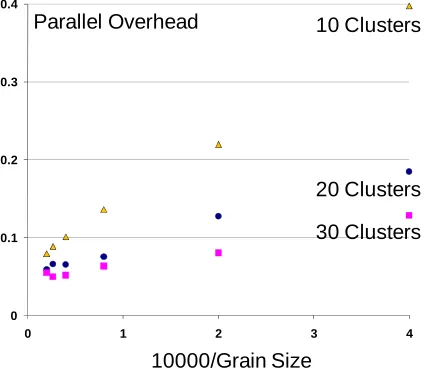
Initial results on the parallel performance of DA clustering are shown in fig. 2 for runs on the 8 core Intel
machine labeled Intel8b in table 1. The figure shows that DA has a parallel overhead [18] that decreases
1 1
2
( ) ( ) Pr[ ( ) ( )] / Pr[ ( ) ( )] (5)
Pr[ ( ) ( )] exp[ 0.5( ( ) ( )) / ] / ( ) (6)
N N
x x
Y k X x X x C k X x C k
X x C k X x Y k T Z x
[image:5.612.79.291.331.518.2]
Figure 2. Parallel Overhead for GIS 2D DA Clustering on Intel8b using C# with 8 threads (cores) and CCR Synchronization. We use three values (10, 20,30) for the number of clusters and plot against the reciprocal of the number of data pointsper thread
0 0.1 0.2 0.3 0.4
0 1 2 3 4
Parallel Overhead 10 Clusters
20 Clusters
10000/Grain Size
asymptotically like 1/grain size as the data set increases. Here grain size n is the dataset size N divided by the
number of processors (cores) which is here 8. Putting T(P) as the execution time on P cores, we can define:
Overhead f = (PT(P)-T(1))/T(1) (7)
Efficiency = 1/(1+f) = Speed up S(P)/P (8)
Thus the overhead of 0.05 seen for large n in fig. 2
corresponds to an excellent speedup of 7.6. The results
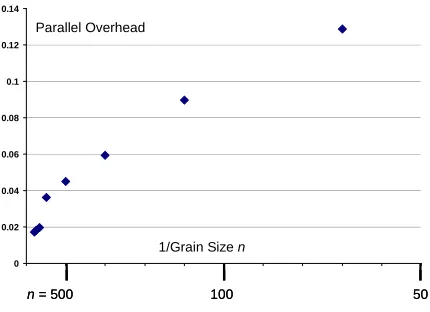
for GTM in fig. 3 show even smaller overheads even at
small grain size due to the substantial additional
computation (matrix multiplication and equation solving)
in this case. In section 5, we emphasize that much of the
critical overhead in multicore parallel code is not
synchronization but rather due to interference between cores in the memory subsystem.
4. Application structure
The algorithms illustrated in equations (1-6) have a structure familiar from many scientific computing areas [6,
24-26]. There is an iteration – in this case over the annealing schedule for T and the steps needed for the EM method to
converge. Synchronization is needed at the end of each iteration. Further looking into more detail, we find that the
iteration consists of sums like Equations (5) and (6) calculating vector and matrix elements combined with linear
algebra [28]. The latter is identification of principal directions for DA clustering and matrix multiplication and linear
equation solution for GTM. The sums themselves are first calculated in the memory of thread and then after
synchronization, accumulated into “global” variables. This strategy assures good use of cache with negligible false
sharing (see section 5). Thus we see that all these algorithms have a “loosely synchronous” structure where the
parallel algorithm consists of “compute-synchronize” stages where synchronization typically implies all cores reach
a barrier [6, 26]. CCR supports the loosely synchronous paradigm with modest overheads analyzed in detail in
earlier papers. Although CCR supports messaging like MPI we only use CCR for synchronization with the shared
memory allowing data to be shared. This allows us highly efficient implementation of primitives such as the
formation of global sums from those calculated locally; such primitives are some of the compute stages that our
algorithms need. The results in figs. 2 and 3 sum over all synchronizations and the overhead is proportional to 1/n
0 0.02 0.04 0.06 0.08 0.1 0.12 0.14
1/Grain Size n
n= 500 100 50
Parallel Overhead
0 0.02 0.04 0.06 0.08 0.1 0.12 0.14
1/Grain Size n
n= 500 100 50
[image:6.612.80.295.127.283.2]Parallel Overhead
as the dominant compute phase is the calculation of sums like (5) and (6) and these are directly proportional to n =
N/P.
Comparing our multicore implementations with traditional parallel programming, we see that we are using
essentially the same programming model with domain decomposition breaking up the application into parallel
components that execute in a loosely synchronous fashion. However, the implementation of this model is different
on multicore and clusters. On multicore we minimize memory bandwidth and maximize cache re-use; on clusters we
need ingenious communication patterns (the MPI collectives) to move data around.
This paper has focused on multicore performance as this is less well studied than traditional MPI and
openMP approaches. We are using exactly the same decomposition that would be used in a traditional MPI approach
but implementing communication more efficiently using the shared memory of the multicore node. Note the
performance model of equations (7) and (8) used for our CCR results was originally developed for explicit
messaging approaches like MPI [24-26]. We will present explicit performance results comparing CCR, MPI and
MapReduce (Hadoop) [9] with this identical decomposition and performance model but the different communication
approaches used for shared memory, tightly coupled and distributed systems respectively [27]. Each mapping in
MapReduce can either correspond to a complete execution of one of our algorithms or more interestingly to one
iteration step so MapReduce provides all needed internal synchronization for parallel algorithm. Efficient distributed
execution requires larger grain size than either the CCR or tightly coupled MPI approaches. The common
decomposition model suggests that PGAS (Partitioned Global Address Space) compilers [16] could support a
common expression of the parallelism but map efficiently to the different runtimes.
5.
Cache Effects on Performance
We found it quite hard to get reliable timing and identified two sources – cache addressed here and runtime
fluctuations described in [12]. The largest effect which is straightforward to address comes from the nature of the
cache on all machines listed in table 1. If different cores access different variables but those are stored in the same
cache line, then wild execution time fluctuations can occur. These are documented by a simple computation that
calculates concurrent summations and stores them in an array element A(i) for thread i. The summation used a
random number generator to avoid being compiled away and can be downloaded from our web site [7]. This natural
implementation leads to an order of magnitude increase in run time over an implementation that stores results in
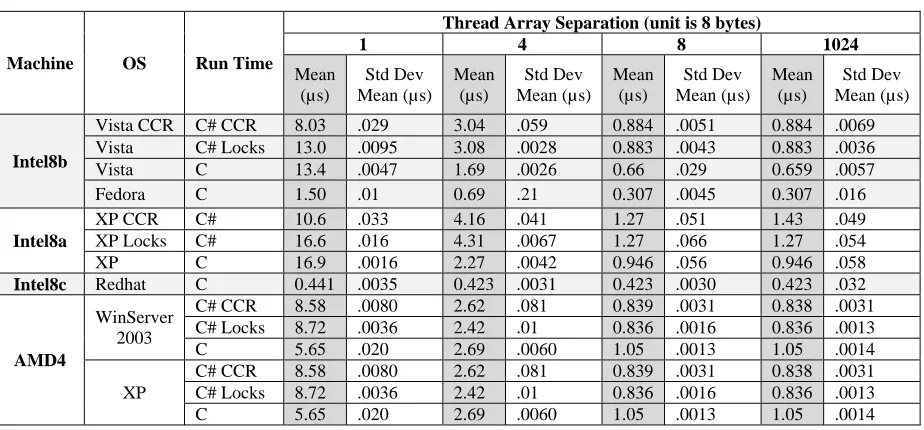
results are documented in Table 2 that records the execution time as a function of S and as a function of several
machine and operating system choices. One sees good performance with modest fluctuations as long as S
corresponds to a separation of 64 bytes or more. On the other hand in most cases the performance is dreadful and
fluctuations sometimes large for separations S less than 64 bytes (the columns labeled 1 and 4 in units of double
variables – 8 bytes – in Table 2). This effect is independent of synchronization used (compare CCR and Locks in
Table 2) and is presumably due to the cache design on these modern multicore systems. Looking at the separation
of 8 or 1024 doubles in Table 2, one can see that with compilers we used, C was much faster than C# and Linux
faster than Windows. Most remarkably the Redhat Linux results do not show the degradation of performance seen
for Windows for separation of 1 or 4 doubles. The Fedora Linux results on Intel 8b lie in between those of Windows
and Redhat in Table 2 showing a factor of 5 difference between separation 1 and 8. Redhat has only a 5% effect
[image:8.612.77.539.361.576.2]while Windows varies widely with an up to a factor of 15 effect.
Table 2: Cache Line Computation Times
Although the cache hardware architecture produces the effect of table 2, its impact is very systems software
dependent. We are obviously able to program around this feature but it is unfortunate as using A(i) to store results
from thread i is surely a natural strategy. This effect is in fact well known [29, 30] but its implications are often not
properly implemented. For example the C# sdk version 2.0 math random number generator uses such an array and
so has unnecessarily poor performance.
Machine OS Run Time
Thread Array Separation (unit is 8 bytes)
1 4 8 1024
Mean (µs)
Std Dev Mean (µs)
Mean (µs)
Std Dev Mean (µs)
Mean (µs)
Std Dev Mean (µs)
Mean (µs)
Std Dev Mean (µs)
Intel8b
Vista CCR C# CCR 8.03 .029 3.04 .059 0.884 .0051 0.884 .0069 Vista C# Locks 13.0 .0095 3.08 .0028 0.883 .0043 0.883 .0036 Vista C 13.4 .0047 1.69 .0026 0.66 .029 0.659 .0057 Fedora C 1.50 .01 0.69 .21 0.307 .0045 0.307 .016
Intel8a
XP CCR C# 10.6 .033 4.16 .041 1.27 .051 1.43 .049 XP Locks C# 16.6 .016 4.31 .0067 1.27 .066 1.27 .054 XP C 16.9 .0016 2.27 .0042 0.946 .056 0.946 .058
Intel8c Redhat C 0.441 .0035 0.423 .0031 0.423 .0030 0.423 .032
AMD4
WinServer 2003
C# CCR 8.58 .0080 2.62 .081 0.839 .0031 0.838 .0031 C# Locks 8.72 .0036 2.42 .01 0.836 .0016 0.836 .0013 C 5.65 .020 2.69 .0060 1.05 .0013 1.05 .0014 XP
All the methods need parallelism in different stages. Dominant is the calculation of formulae like those in
equations (5) and (6) and this is called the kernel in section 6. However there is linear algebra used to solve
equations or in clustering algorithm to calculate correlation matrix to decide whether or not to split clusters. The
latter uses the usual power method to find the leading eigenvector and easily parallelizes. However GTM has more
extensive need for linear algebra with matrix multiplication as the most computationally demanding part. We
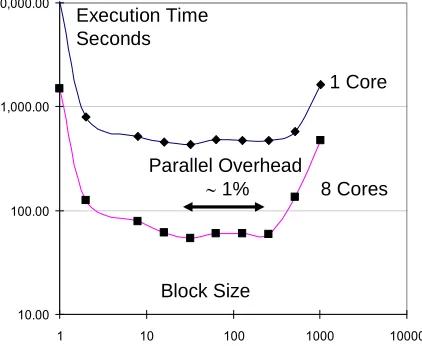
implemented this as usual with blocking to lessen memory
bandwidth needs and to make good use of cache. In fig. 4,
we plot the execution time as a function of block size. At
small block sizes, cache is not used well and the memory
bandwidth demands are highest. At large block sizes, the
performance declines as the primitive block matrix
computation will not fit into cache. This effect is seen first
for the fully parallel case as cache is shared. Excellent 1
and 8 core performance is seen for block sizes between 32
and 256; we used block size 32 in GTM results of fig. 3.
Note that parallel matrix multiplication has essentially zero synchronization overhead as each block of the result
matrix can be calculated independently. Thus we assign blocks to cores in a block scattered fashion and achieve load
balance with no synchronization needed except at the end of the full computation. We stress that these results use
straightforward C# code and have not been optimized for floating point performance with specialized kernels.
We used some simple principles to ensure reasonable use of cache. Variables being updated frequently
(such as those in equations 5 and 6 updated for each data point x) are stored locally to each thread i.e. to each core.
This for example includes the blocks of matrix C in multiplication C = A B. Variables that are only read such as the
matrices A and B, are not copied locally but accessed directly from shared memory. Variables are padded if needed
to avoid the cache interference effects of table 2. As explained in introduction, we choose C# for our algorithms so
we can get results relevant for commodity deployments but of course C will show similar effects to those presented
here. 10.00 100.00 1,000.00 10,000.00
1 10 100 1000 10000
Execution Time Seconds
Block Size
1 Core
8 Cores Parallel Overhead
1%
10.00 100.00 1,000.00 10,000.00
1 10 100 1000 10000
Execution Time Seconds
Block Size
1 Core
8 Cores Parallel Overhead
[image:9.612.76.287.195.368.2]1%
6. Memory Bandwidth Effects
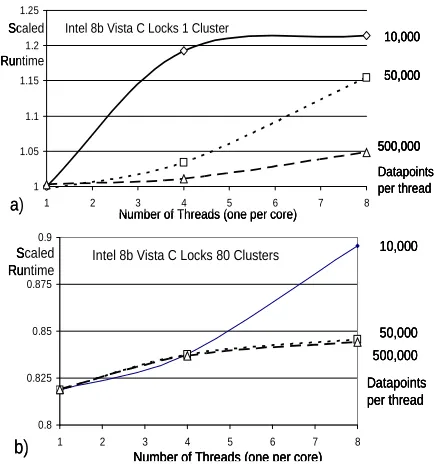
In figs. 5, 6 and 7 we isolate the kernel of the DA clustering algorithm of section 3 and examine its performance as a
function of grain size n, number of clusters and number of cores. We measure thread dependence at three fixed
values of grain size n (10,000, 50,000 and 500,000) where all results are divided by the number of clusters, the grain
size, and the number of cores and scaled so the 10,000 data point, one cluster, one core result becomes 1. These
figures then immediately allow us to identify key features of the computation as deviations from 1. We display cases
for 1 cluster (figs. 5(a) 6(a) 7(a)) where memory bandwidth effects could be important and also for 80 clusters (figs.
5(b) 6(b) 7(b)) where such effects are small as one performs 80 floating point operations on every variable fetched
from memory. The three figures have typical results covering respectively Windows and C# (fig. 5), Windows and
C (fig. 6) and finally Linux and C (fig. 7). Always we use threads not processes and C uses locks and C# uses CCR
synchronization. Data is stored so as to avoid any of cache line effects discussed in the previous section. Further we
do not include synchronization costs in these plots as we have considered these separately. Here we want to isolate
the impact of runtime fluctuations on performance.
1 1.1 1.2 1.3 1.4 1.5 1.6
1 2 3 4 5 6 7 8
Number of Threads (one per core) Intel 8b Vista C# CCR 1 Cluster
500,000 50,000 10,000 Scaled Runtime Datapoints per thread a) 1 1.1 1.2 1.3 1.4 1.5 1.6
1 2 3 4 5 6 7 8
Number of Threads (one per core) Intel 8b Vista C# CCR 1 Cluster
500,000 50,000 10,000 Scaled Runtime Datapoints per thread a) 0.8 0.85 0.9 0.95 1
1 2 3 4 5 6 7 8
Number of Threads (one per core) Intel 8b Vista C# CCR 80 Clusters
500,000 50,000 10,000 Scaled Runtime Datapoints per thread b) 0.8 0.85 0.9 0.95 1
1 2 3 4 5 6 7 8
Number of Threads (one per core) Intel 8b Vista C# CCR 80 Clusters
500,000 50,000 10,000 Scaled Runtime Datapoints per thread 0.8 0.85 0.9 0.95 1
1 2 3 4 5 6 7 8
Number of Threads (one per core) Intel 8b Vista C# CCR 80 Clusters
[image:10.612.316.533.99.332.2]500,000 50,000 10,000 500,000 50,000 10,000 Scaled Runtime Datapoints per thread b)
Figure 5. Scaled Run time on Intel8b using Vista and C# with CCR for synchronization on Clustering Kernel for three dataset sizes with 10,000 50,000 or 500,000 points per thread(core). Each measurement involved averaging over at least 1000 computations separated by synchronization whose cost is not included in results (see text)
1 1.05 1.1 1.15 1.2 1.25
1 2 3 4 5 6 7 8
Number of Threads (one per core) Intel 8b Vista C Locks 1 Cluster
500,000 50,000 10,000 Scaled Runtime Datapoints per thread a) 1 1.05 1.1 1.15 1.2 1.25
1 2 3 4 5 6 7 8
Number of Threads (one per core) Intel 8b Vista C Locks 1 Cluster
500,000 50,000 10,000 Scaled Runtime Datapoints per thread 1 1.05 1.1 1.15 1.2 1.25
1 2 3 4 5 6 7 8
Number of Threads (one per core) Intel 8b Vista C Locks 1 Cluster
500,000 50,000 10,000 500,000 50,000 10,000 Scaled Runtime Datapoints per thread a) 0.8 0.825 0.85 0.875 0.9
1 2 3 4 5 6 7 8
Number of Threads (one per core) Intel 8b Vista C Locks 80 Clusters
500,000 50,000 10,000 Scaled Runtime Datapoints per thread b) 0.8 0.825 0.85 0.875 0.9
1 2 3 4 5 6 7 8
Number of Threads (one per core) Intel 8b Vista C Locks 80 Clusters
500,000 50,000 10,000 Scaled Runtime Datapoints per thread 0.8 0.825 0.85 0.875 0.9
1 2 3 4 5 6 7 8
Number of Threads (one per core) Intel 8b Vista C Locks 80 Clusters
500,000 50,000 10,000 Scaled Runtime Datapoints per thread b)
[image:10.612.72.293.99.322.2]The results for one cluster clearly show the
effect of memory bandwidth with scaled run time
increasing significantly as the number of cores used is
increased. In this benchmark the memory demands scale
directly with number of cores. Indeed a major concern
with multicore system is the need for a memory
bandwidth that increases linearly with the number of
cores. In fig. 6 we see a 50% increase in the run time
with 8 cores with a grain size of 10,000. This is for C#
and Windows and the overhead is reduced to 22% for C
on Windows and 13% for C on Linux. Further we note
that naively the 10,000 data point case should get
excellent performance as the dataset can
easily fit in cache and minimize memory
bandwidth needs. We do not observe this
which illustrates that the current multicore
hardware and software cache architecture
is not optimized for the style of
application discussed in this paper. We
need to explore the cache behavior of
more applications to quantify the
architecture-algorithm relationship.
We get modest overheads for 80
clusters in all cases which is in fact why
the applications of section 3 run well.
There are no serious memory bandwidth
issues in cases with several clusters and it
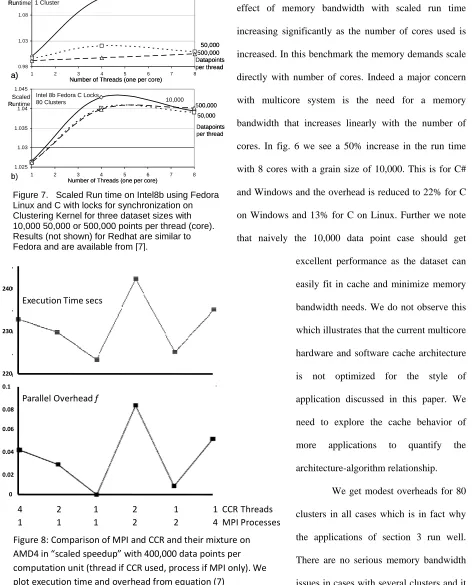
[image:11.612.81.300.78.275.2]this case that dominates the computation. This is usual parallel computing wisdom; real size problems run with good Figure 7. Scaled Run time on Intel8b using Fedora
Linux and C with locks for synchronization on Clustering Kernel for three dataset sizes with 10,000 50,000 or 500,000 points per thread (core). Results (not shown) for Redhat are similar to Fedora and are available from [7].
0.98 1.03 1.08 1.13
1 2 3 4 5 6 7 8
Number of Threads (one per core) Intel 8b Fedora C Locks
1 Cluster 500,000 50,000 10,000 Scaled Runtime Datapoints per thread a) 0.98 1.03 1.08 1.13
1 2 3 4 5 6 7 8
Number of Threads (one per core) Intel 8b Fedora C Locks
1 Cluster 500,000 50,000 10,000 Scaled Runtime Datapoints per thread a) 1.025 1.03 1.035 1.04 1.045
1 2 3 4 5 6 7 8
Number of Threads (one per core) Intel 8b Fedora C Locks
80 Clusters 500,000 50,000 10,000 Scaled Runtime Datapoints per thread b) 1.025 1.03 1.035 1.04 1.045
1 2 3 4 5 6 7 8
Number of Threads (one per core) Intel 8b Fedora C Locks
80 Clusters 500,000 50,000 10,000 Scaled Runtime Datapoints per thread b)
Figure 8: Comparison of MPI and CCR and their mixture on
AMD4 in “scaled speedup” with 400,000 data points per
computation unit (thread if CCR used, process if MPI only). We
plot execution time and overhead from equation (7)
Execution Time secs
4 2 1 2 1 1 CCR Threads Parallel Overhead f
[image:11.612.74.546.93.678.2]efficiency as long as there is plenty of computation. [6, 24-26] The data mining cases we are studying (Clustering,
EM based Mixture models, Hidden Markov Models, Support Vector Machines) satisfy this and will run well on
machines that naturally extend current Intel and AMD mainline multicore systems with 100’s of cores and memory
bandwidth needs that are modest for large problems (such as many clusters to be determined)
7. Comparison of MPI and CCR on Clusters
In figures 8-10, we support both MPI and
CCR for the full deterministic annealing
clustering problem. Interestingly MPI uses
mainly MPI_Allreduce or MPI_Bcast and
elegantly implements needed
synchronization. As we are using C# we
chose the new MPI.NET implementation
from Indiana [31] which performed
excellently. All our runs are on Windows
machines. We use the single AMD4
machine running all combinations of CCR
and MPI in results reported in figure 8 and a
cluster of eight Intel2 machines for figure 9;
figure 10 uses a cluster of four AMD8
machines. Note from comparing the top and
bottom of figure 8, that parallel overhead is
just presenting execution time in a
normalized fashion. We always use MPI for
synchronization across nodes. Internal to the
node, we implement the 2 (Intel2a), 4
(AMD4), 8 (AMD8) way parallelism using
either CCR threads or MPI processes. In
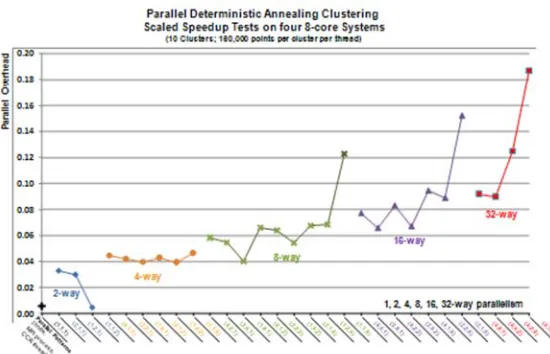
[image:12.612.72.340.193.359.2]each case, we used the scaled speedup approach of fixed number of data points per computation unit. This is a Figure 9: Comparison of MPI and CCR and their mixture on
Intel2a in “scaled speedup” with 1,600,000 data points per computation unit (thread if CCR used, process if MPI only). We plot the parallel overhead from equation (7)
Parallel Overhead f
2 2 2 2 1 1 1 1 1 1 1 1 CCR Threads per process
8 4 2 1 8 4 2 1 16 8 4 2 MPI Processes
0.075
0.05
[image:12.612.69.344.423.600.2]0 0.025
thread if CCR used or a process if only MPI. When an MPI process has 2 CCR threads, it corresponds to two
computational units with twice the data set size. So execution time should be independent of the MPI/CCR scenario
if there are no parallel overheads and more precisely we can use the overhead defined in equation (7). Our results
show a maximum overhead of 0.2 and efficiencies that are always greater than 80%. Our results show somewhat
higher overheads for CCR than MPI on AMD4 and AMD8 and a detailed analysis shows this is due to higher
runtime fluctuations for threads than processes on that machine.
8. Conclusions
We have looked at a class of interesting data mining algorithms and shown efficient parallel implementations with
speedups on large “production” problems of greater than 7.5 on an eight core system. We do not believe parallel
studies of these algorithms have been discussed previously. Although the parallelism used familiar data parallel
techniques, it was not trivial to get good multicore performance in face of the memory, cache and fluctuation
overheads discussed here. We are currently tackling applications with millions of data points (PubChem for example
has 18 million chemical compounds) each with thousands of properties (dimension D in equations 1-6); the data
deluge will only increase the challenge! Simple approaches like K-means and the basic EM approach often find
local minima. Here we are developing a suite of robust data mining algorithms that can be applied to large problems
and use techniques like annealing to mitigate the local minima issue.
We believe our initial results are encouraging and show that managed code can deliver high performance
algorithms. In the future we will investigate further algorithms and apply them with collaborators to interesting
applications. This will hopefully contribute to e-Science and quantify the important programming principles for
multicore systems. We will also extend our work to cover larger clusters of multicore systems and compare with
both MPI and popular distributed programming paradigms like MapReduce [9]; early results can be found in ref.
[32]. Our current results are focused on C# for Windows but the basic message is valid for other languages and the
Linux O/S. In fact as seen in sections 5 and 6, Linux shows typically less overhead than Windows. We note that
Windows is expected to be important in future architectures for client side data mining (naturally on Windows)
perhaps supported by a cloud of Windows machines to off load problems that exceed the capacity of a client.
Further the comparison between CCR and MPI illustrates the differences between thread and process-based
implementation. We expect use of threads for cores inside a node and traditional process-based MPI between nodes
References
[1] Tony Hey and Anne Trefethen, The data deluge: an e-Science perspective in “Grid Computing: Making the Global Infrastructure a Reality” edited by Fran Berman, Geoffrey Fox and Tony Hey, John Wiley & Sons, Chicester, England, ISBN 0-470-85319-0, February 2003
[2] Jack Dongarra Editor The Promise and Perils of the Coming Multicore Revolution and Its Impact, CTWatch Quarterly Vol 3 No. 1 February 07,
[3] David Patterson The Landscape of Parallel Computing Research: A View from Berkeley 2.0 Presentation at Manycore Computing 2007 Seattle June 20 2007
[4] Annotated list of multicore Internet sites http://www.connotea.org/user/crmc/
[5] Pradeep Dubey Teraflops for the Masses: Killer Apps of Tomorrow Workshop on Edge Computing Using New Commodity Architectures, UNC 23 May 2006
[6] Geoffrey Fox tutorial at Microsoft Research Parallel Computing 2007: Lessons for a Multicore Future from the Past February 26 to March 1 2007. See http://www.infomall.org for this and other cited Indiana University papers. [7] Home Page for SALSA Project at Indiana University http://www.infomall.org/salsa.
[8] Dennis Gannon and Geoffrey Fox, Workflow in Grid Systems Concurrency and Computation: Practice & Experience 18 (10), 1009-19 (Aug 2006), Editorial of special issue prepared from GGF10 Berlin
[9] Jeffrey Dean and Sanjay Ghemawat, MapReduce: Simplified Data Processing on Large Clusters, OSDI'04: Sixth Symposium on Operating System Design and Implementation, San Francisco, CA, December 2004
[10]Xiaohong Qiu, Geoffrey Fox, and Alex Ho Analysis of Concurrency and Coordination Runtime CCR and DSS, Technical Report January 21 2007
[11]Xiaohong Qiu, Geoffrey Fox, H. Yuan, Seung-Hee Bae, George Chrysanthakopoulos, Henrik Frystyk Nielsen High Performance Multi-Paradigm Messaging Runtime Integrating Grids and Multicore Systems, published in proceedings of
eScience 2007 Conference Bangalore India December 10-13 2007
[12] Xiaohong Qiu, Geoffrey C. Fox, Huapeng Yuan, Seung-Hee Bae, George Chrysanthakopoulos, Henrik Frystyk Nielsen Performance of Multicore Systems on Parallel Data mining Services Technical report November 19 2007,
[13]Microsoft Robotics Studio is a Windows-based environment that includes end-to-end Robotics Development Platform, lightweight service-oriented runtime, and a scalable and extensible platform. For details, see
http://msdn.microsoft.com/robotics/
[15]Henrik Frystyk Nielsen, George Chrysanthakopoulos, “Decentralized Software Services Protocol – DSSP” http://msdn.microsoft.com/robotics/media/DSSP.pdf
[16]Internet Resource for HPCS Languages http://crd.lbl.gov/~parry/hpcs_resources.html
[17]Geoff M. Downs, John M. Barnard Clustering Methods and Their Uses in Computational Chemistry, Reviews in Computational Chemistry, Volume 18, 1-40 2003
[18]Kenneth Rose, Eitan Gurewitz, and Geoffrey C. Fox Statistical mechanics and phase transitions in clustering Phys. Rev. Lett. 65, 945 - 948 (1990)
[19]Rose, K. Deterministic annealing for clustering, compression, classification, regression, and related optimization problems, Proceedings of the IEEE Vol. 86, pages 2210-2239, Nov 1998
[20]K-means algorithm at Wikipedia http://en.wikipedia.org/wiki/K-means_algorithm
[21]Bishop, C. M., Svensen, M., Williams, C. K. I. GTM: The generative topographic mapping. Neural Comput. 1998, 10, 215-234.
[22]Dempster, A.P., Laird, N.M., & Rubin, D.B. (1977). Maximum-likelihood from incomplete data via the EM algorithm. J. R. Statist. Soc. Ser. B (methodological), 39, 1–38.
[23]Naonori Ueda and Ryohei Nakano Deterministic annealing EM algorithm Neural Networks Volume 11, Issue 2, 31 March 1998, Pages 271-282
[24]“The Sourcebook of Parallel Computing” edited by Jack Dongarra, Ian Foster, Geoffrey Fox, William Gropp, Ken Kennedy, Linda Torczon, and Andy White, Morgan Kaufmann, November 2002.
[25]G. Fox, M. Johnson, G. Lyzenga, S. Otto, J. Salmon, D. Walker Solving Problems in Concurrent Processors-Volume 1, Prentice Hall, March 1988
[26]Fox, G. C., Messina, P., Williams, R., “Parallel Computing Works!”, Morgan Kaufmann, San Mateo Ca, 1994. [27]Geoffrey Fox “Messaging Systems: Parallel Computing the Internet and the Grid”, EuroPVM/MPI 2003 Invited Talk
September 30 2003.
[28]J Kurzak and J J Dongarra, Pipelined Shared Memory Implementation of Linear Algebra Routines with arbitary Lookahead - LU, Cholesky, QR, Workshop on State-of-the-Art in Scientific and Parallel Computing, Umea, Sweden, June 2006
[29]T. Tian and C-P Shih Software Techniques for Shared-Cache Multi-Core Systems Intel Software Network http://softwarecommunity.intel.com/articles/eng/2760.htm
[30]How to Align Data Structures on Cache Boundaries, Internet resource from Intel,
http://www.intel.com/cd/ids/developer/asmo-na/eng/dc/threading/knowledgebase/43837.htm