RIT Scholar Works
Theses Thesis/Dissertation Collections
4-1-1987
The effect of solid ink density on shifts in hue in
gray component replacement
Hans P. Kellogg
Follow this and additional works at:http://scholarworks.rit.edu/theses
This Thesis is brought to you for free and open access by the Thesis/Dissertation Collections at RIT Scholar Works. It has been accepted for inclusion in Theses by an authorized administrator of RIT Scholar Works. For more information, please [email protected].
Recommended Citation
School of Printing
Rochester Institute of Technology Rochester, New York
CERTIFICATE OF APPROVAL
MASTER'S THESIS
This is to certify that the Master's Thesis of
Hans P. Kellogg
Hans P. KelloggWith a major in Printing Technology
has been approved by the Thesis Committee as satisfactory for the thesis requirement for the Master of Science degree at the convocation of
Hay 1987 date
Thesis Committee:
Joseph L. Noga
-=---Thesis Advisor
Joseph L. Noga
Graduate Program CoordinatorON SHIFTS IN HUE
IN GRAY COMPONENT REPLACEMENT
I, Hans P. Kellogg, hereby grant permission to the Wallace Memorial Library, of Rochester Institute of Technology, to reproduce my thesis in whole or in part. Any reproduction will not be for commercial use or profit.
IN GRAY COMPONENT REPLACEMENT
by
Hans P. Kellogg
A thesis submitted in partial fulfillment of the requirements for the degree of Master of Science in the School of Printing Management and Science
in the College of Graphic Arts and Photography of the Rochester Institute of Technology
April, 1987
away 3,
education inspired me to pursue my own. His presence is
greatly missed.
A note of thanks is given to the following people for their help in the completion of this thesis.
Franz Sigg, Research Associate at the Technical and
Education Center for the Graphic Arts at Rochester Institute
of Technology, Rochester, New York, was of assistance in the design of the press form used for this research. His
comments and ideas are appreciated.
Dr. John Campbell, Assistant Professor of Biology, Northwest Community College, Powell, Wyoming, for his persistent work and assistance in the completion of the statistical work for
this thesis.
Claude Dotson, Assistant Professor of Data Processing, Business, and Office Administration, Northwest Community College, Powell, Wyoming, was a helpful in the areas of editing and proofreading. His expertise is greatly
appreciated.
Cheryl H. Kellogg, Instructor of Medical Laboratory
Technology, Northwest Community College, Powell, Wyoming, receives a special thanks for her understanding. As the
wife of a graduate student, she has struggled along with me
throughout this process. I love her dearly.
LISTS OF FIGURES vi
LIST OF TABLES ix
ABSTRACT 1
Chapter 1, INTRODUCTION 1
The GCR Color Process 1
COLOR THEORY 2
Additive Color Theory 3
Subtractive Color Theory 3
Observation of Color 4
Reproduction Processes 6
Contaminations of Real Inks 10
Chapter 2, LITERATURE REVIEW 16
BACKGROUND 19
Statement of Purpose 20
HYPOTHESIS 20
Chapter 3, METHODOLOGY 21
Color Groupings 26
Chapter 4, CONCLUSIONS 31
Instrumentation 31
Implications 40
Chapter 5, Recommendations 42
BIBLIOGRAPHY 43
Figure 1. Colors resulting from mixing equal portions of
the additive primaries 3
Figure 2. Colors resulting form overlap of equal portions
of any two subtractive primaries 5
Figure 3. Reflectances of white light from yellow,
magenta, and cyan ink 5
Figure 4. Bar graph depicting the different amounts of
yellow, magenta, and cyan ink required to reproduce a
printed reproduction of a red apple 7
Figure 5. Gray component of a reproduction of a red apple 9
Figure 6. Absorption and reflectance of white light from
the substrate using pure inks (taken from Kodak
Publication, Basic Color for the Graphic Arts, Q-7) . 10
Figure 7 . Absorption and reflectance of white light by
real Inks (taken from Kodak Publication, Basic Color
for the Graphic Arts, Q-7) 11
Figure 8. Percent dot area of yellow, magenta, cyan, and
black ink in a normal chromatic reproduction of olive
green (taken from Achromatic Synthesis, marketing
information. Hell Graphics, Dr.-Ing. Rudolf Hell,
Gmbh, Kiel, Germany, 1983) 12
Figure 9. Expected GCR reproduction (taken from Achromatic
Synthesis, marketing information, Hell Graphics,
Dr.-Ing. Rudolf Hell, Gmbh, Kiel, Germany, 1983) .... 13
Figure 10. Actual GCR reproduction (taken from Achromatic
Synthesis, marketing information. Hell Graphics, Dr.-Ing. Rudolf Hell, Gmbh, Kiel, Germany, 1983) 14
Figure 11. Division of the gray component from the hue in
a normal chromatic color reproduction of red apples . 14
Figure 12. Shifts of hue during variation in SID of LPC in
the GCR process 15
Figure 14. A example of the segmented color test patches
depicting 4 color, 3 color, and black only 21
Figure 15. Layout of the thesis printing form 23
Figure 16. Graphs depicting variations of yellow, magenta,
and cyan ink for color patch #16 for the normal
chromatic, 60% GCR, and the 100% GCR color process. . 33
Figure 17. Examples of color patch #16 with standard
densities and decreasing densities of the yellow ink for the 100% GCR, 60% GCR, and the normal chromatic
processes 35
Figure 18. Examples of color patch #16 with standard densities and increasing densities of the yellow ink for the 100% GCR, 60% GCR, and the normal chromatic
processes 36
Figure 19. Statistical comparison between A and B processes
and the A and C processes of the neutral gray color
grouping 37
Figure 20. Statistical comparison between A and B processes
and the A and C processes of the process/overprint
color grouping 38
Figure 21. Statistical comparison between A and B processes
and the A and C processes of the hard to print color
grouping 38
Figure 22. Statistical comparison between A and B processes
and the A and C processes of the all colors .... 40
Figure 23. Graphs depicting variations of yellow, magenta,
and cyan ink for color patch #1 for the normal
chromatic, 60% GCR, and the 100% GCR color process. . 45
Figure 24. Graphs depicting variations of yellow, magenta,
and cyan ink for color patch #2 for the normal
chromatic, 60% GCR, and the 100% GCR color process. . 46
Figure 25. Graphs depicting variations of yellow, magenta,
and cyan ink for color patch #4 for the normal
chromatic, 60% GCR, and the 100% GCR color process. . 47
Figure 26. Graphs depicting variations of yellow, magenta,
and cyan ink for color patch #5 for the normal
chromatic, 60% GCR, and the 100% GCR color process. . 48
for
chromatic, 60% GCR, and the 100% GCR color process. . 49
Figure 28. Graphs depicting variations of yellow, magenta, and cyan ink for color patch #7 for the normal
chromatic, 60% GCR, and the 100% GCR color process. . 50
Figure 29. Graphs depicting variations of yellow, magenta, and cyan ink for color patch #8 for the normal
chromatic, 60% GCR, and the 100% GCR color process. . 51
Figure 30. Graphs depicting variations of yellow, magenta, and cyan ink for color patch #9 for the normal
chromatic, 60% GCR, and the 100% GCR color process. . 52
Figure 31. Graphs depicting variations of yellow, magenta, and cyan ink for color patch #10 for the normal
chromatic, 60% GCR, and the 100% GCR color process. . 53
Figure 32. Graphs depicting variations of yellow, magenta, and cyan ink for color patch #13 for the normal
chromatic, 60% GCR, and the 100% GCR color process. . 54
Figure 33. Graphs depicting variations of yellow, magenta,
and cyan ink for color patch #14 for the normal
chromatic, 60% GCR, and the 100% GCR color process. . 55
Figure 34. Graphs depicting variations of yellow, magenta, and cyan ink for color patch #15 for the normal
chromatic, 60% GCR, and the 100% GCR color process. . 56
Figure 35. Graphs depicting variations of yellow, magenta, and cyan ink for color patch #17 for the normal
chromatic, 60% GCR, and the 100% GCR color process. . 57
Figure 36. Graphs depicting variations of yellow, magenta, and cyan ink for color patch #18 for the normal
chromatic, 60% GCR, and the 100% GCR color process. . 58
Figure 37. Graphs depicting variations of yellow, magenta, and cyan ink for color patch #19 for the normal
chromatic, 60% GCR, and the 100% GCR color process. . 59
Figure 38. Graphs depicting variations of yellow, magenta, and cyan ink for color patch #21 for the normal
chromatic, 60% GCR, and the 100% GCR color process. . 50
Figure 39. Graphs depicting variations of yellow, magenta, and cyan ink for color patch #22 for the normal
Table 1. Data obtained from variations of yellow, magenta,
and cyan ink for the A process, neutral gray color
grouping 62
Table 2. Data obtained from variations of yellow, magenta,
and cyan ink for the B process, neutral gray color
grouping 65
Table 3. Data obtained from variations of yellow, magenta,
and cyan ink for the C process, neutral gray color
grouping 68
Table 4. Data obtained from variations of yellow, magenta,
and cyan ink for the A process, process/overprint
color grouping 71
Table 5. Data obtained from variations of yellow, magenta,
and cyan ink for the B process, process/overprint
color grouping 74
Table 6. Data obtained from variations of yellow, magenta,
and cyan ink for the C process, process/overprint
color grouping 77
Table 7. Data obtained from variations of yellow, magenta,
and cyan ink for the A process, hard to print color
grouping 80
Table 8. Data obtained from variations of yellow, magenta,
and cyan ink for the B process, hard to print color
grouping 83
Table 9. Data obtained from variations of yellow, magenta,
and cyan ink for the C process, hard to print color
grouping 86
With advances in computer storage and electronic dot
generation scanners a new color separation process has
become possible. Although in theory the Gray Component
Replacement (GCR) process has been possible since the early
twenties, it has only recently been available through
contemporary color separation methods.
GCR is the process by which the gray component of a par
ticular color reproduction is removed from the reproduction
and replaced with black ink. The gray component is defined
as specific combinations of the least predominant color and
the other remaining inks.
A printing form was designed to include three different
color reproduction processes: the 100% GCR, 60% GCR, and
normal chromatic. A standard color transparency used for
color evaluation was included with a series of 24 color test
patches. A colorimeter was used as the test instrument, and
the color patches provided ease in measurement using the
instrument.
and samples obtained, ink densities of the other units were
selectively varied to provide a shift in hue.
A colorimeter was used to obtain a value of Delta hue from
the selected press sheets. Each standard color press sheet
was measured and recorded as a standard with successive
readings measured in terms of Delta hue. The color test
patches were divided into groupings of neutral gray, hard to
print, process/overprint, and all colors. Each Delta hue
measurement was recorded and grouped into the specific
categories.
The variations of the normal chromatic and the 100% GCR
separations were compared, as well as the variations of the
normal chromatic and the 60% GCR process. This is to say
that the neutral gray color grouping compared the measure
ments of the 100% GCR to the measurements of the normal
chromatic process. These same measurements were taken for
each variation within each color grouping.
Delta hue readings for each of the color groupings was used
to calculate a t-value and test the significance of the
difference between the different processes. If there was
indeed a difference between the different processes then a
comparisons. The GCR does reduce shifts of hue on the
lithographic press. This reduction in shifts of hue should
INTRODUCTION
The GCR Color Process
Advances in computer storage and electronic dot generating
scanners have opened up new areas for the printing industry.
Although the theory was conceived long ago, it is only now
possible to produce the gray component replacement (GCR)
process. It is uncertain whether GCR is the process that
will become the major color separation method of the future,
for as a whole, the printing industry is hesitant to embrace
new technology before it has proven itself.
Claims for the GCR process include many advantages,1
ranging from decreased ink consumption, increased color
brightness, reduced trapping problems, to ease of control on
the lithographic press. The disadvantages such as retrain
ing of color separators, dot etchers, platemakers, and press
crews seem insignificant when considering all the reputed
1 Programmed and Complementary Color Reduction, Dr.
Eggert Jung, Dr. -Ing. R. Hell Gmbh, Germany, Technical
tion process in the printing industry today is presented
with the following questions. Does the result of this
process support these claims? Will this process take over
80% of the future color printing market?3
Or is GCR's only
claim the ability to provide special applications for
selected areas of the printing market?
The commercial printing industry has been interested in
answers to these questions but has found it difficult to
take the time to conduct research. Much of the research and
development has been conducted by the scanner manufacturers.
It is not surprising that these manufacturers are interested
in a process that allows them to offer unique advantages and
increase equipment sales. Their work provides an important
service, but there is also a need to pursue research from an
unbiased position.
COLOR THEORY
To understand the advantages of the GCR printing process, an
2 Ibid., p. 136
3 "Investigation into the Application of Achromatic
Synthesis to the Printing Industry," Dr. Abdel Ghany Saleh, Technical Association for the Graphic Arts, Proceedings of
portion of the electromagnetic spectrum that produces
visible light is composed of individual wavelengths of 380
to 750 nanometers. When combined, these wavelengths provide
the visual sensation of white light.
Additive Color Theory
If white light were to pass through a prism and shine on a
surface, the entire portion of the visual light spectrum
would be broken into its many components. The red, green,
and blue portions of light contribute the largest part of
the light spectrum. These three major colors are considered
red + blue = magenta
red + green = yellow
blue + green =
cyan
Figure 1. Colors resulting from mixing equal portions of
the additive primaries
the primary colors of the additive color process, the
production of colors by mixing colored lights. Addition of
all three primary colors produces white light; equal
portions of any two of the primaries produce a third color.
The printing industry, however, uses the subtractive color
process. Magenta, cyan, and yellow are the subtractive
primaries used in the color inks. Each individual trans
parent ink acts as a filter to "subtract"
a portion of white
light. A yellow ink appears yellow because of the reflec
tance of red and green light from the substrate. As the
white light strikes the surface, the blue portion of the
light spectrum is absorbed. The remaining portions of
visible light, red and green, reflect from the substrate to
produce the yellow color. Combinations of any two of the
subtractive primaries produce the colors that are the
primary colors of the additive process. (Figure 2)
If blue, green, and red light are reflected from an object,
the object's perceived color is white. If an object absorbs
100% of the three portions, then its perceived color would
be black.
Observation of Color
cyan + yellow = green
magenta + yellow = red
cyan + magenta = blue
Figure 2. Colors resulting form overlap of equal portions of any two subtractive primaries.
When a red apple is illuminated by "white"
light, the blue
and green portions of the light spectrum are absorbed by the
surface of the apple and the red is reflected. We perceive
8 <J R & R R ?> & R- & ORB G fj
Yellow Ink Magenta Ink Cyan Ink
Figure 3. Reflectances of white light from yellow, magenta, and cyan Ink
the apple is red because red is the color of light that is
reflected to the viewer.
A reproduction of an apple produced by the subtractive
red. Magenta absorbs the green portion of the spectrum, and
the yellow absorbs the blue. The red portion is reflected
back to the eye, and the color of the reproduction of the
apple appears red in color. (Figure 3)
Reproduction Processes
A bar graph depicting the amount of ink used in a normal
chromatic reproduction of an apple would indicate a small
portion of cyan ink. This cyan ink would darken the hue or
the color of the apple. An ink contributing the smallest
amount to the hue of the reproduction will be considered the
least predominant color (LPC) . (Figure 4) With the 10% cyan
determined to be the least predominant color, a combined
portion of 10% cyan, 10% magenta, and 10% yellow could be
considered a neutral gray or gray component.
In the GCR printing process this gray component is replaced
with black ink. As in the normal chromatic process, the
neutral gray is identified as the LPC combined with equal
amounts of the other two color inks. Black is used to
replace the gray component, and the hue of an object is thus
determined by two of the remaining colored inks. The black
ink acts only as a darkening factor to the hue of the
Y = 50% loo
M = 75%
is
C = 10%
v
K = 0% 0
Figure 4. Differing amounts of yellow, magenta, and cyan
ink required to reproduce a printed reproduction of a red
apple.
Two primary methods have been explained to this point:
normal chromatic reproduction and the GCR process. A third
alternative is a combination of the two. In the previously
explained GCR process, the LPC was completely removed and
replaced with black. Expressed as percentages, this GCR
process would be considered 100% GCR from a result of the
complete removal of the LPC. The normal chromatic process,
as previously stated, represents the absence of the removal
of the LPC. For ease of explanation, the process will be
considered 0% GCR. Any point between these extremes would
entail partial reduction of the LPC. When the use of GCR
reaches 100%, shadow areas of the reproduction are re
produced entirely by the black printer. Used by itself, the
density of the black printer lacks the depth that is
possible by printing the 3 process colors plus black.
dens-black can reach densities of 2.00.3 If 100 % GCR is used,
the shadows will lack the contrast that is currently
possible with normal chromatic reproduction processes.
Because of this lack of shadow density, limits have been
recommended in the use of the amount of GCR in a repro
duction.
To alleviate the lack of density present in the dark
shadows, another control is used. When high percentages of
GCR are used, under color addition (UCA) adds the LPC back
to the reproduction. This addition differs from smaller
percentages of GCR in that the UCA only affects the neutral
areas. This effect is the complete opposite of the under
color removal (UCR) , which has been used for many years in
the color separation trade. Where UCR removes color from
the neutrals to alleviate density problems, UCA adds color
to the neutrals to increase density.
Apparently, no advantages exist for the use of the GCR
process in the pre-press area. The claims of reduced ink
consumption, reduced trapping, increased color saturation,
or reduced study picking relate to the press and finishing
areas. This paper will focus on the reduction of shifts in
3 Miles Southworth, Color Separation Techniques, 2nd
As stated earlier, wherever three transparent color inks
overlap, the two predominant inks produce the hue of the
color, and the third or LPC ink produces the graying or
darkening factor of the color.7
The LPC can be combined
with equal amounts of the other inks to form an achromatic
Hue of the red apple Gray component of the apple
65% MAGENTA 10% MAGENTA
40% YELLOW 10% YELLOW
0% CYAN 10% CYAN
Figure 5. Gray component of a reproduction of a red apple
or gray component. In a color reproduction of a red apple,
if the color red was composed of 75% magenta, 50% yellow,
and 10% cyan, the cyan would be defined as the LPC. Further
removal of the gray component would yield the results as in
Figure 5:
This explanation considers the inks as if they were produced
6 Gunter Keppler, "PCR-Programmed Colour Removal,
Klischograph 1982, (1982), Dr. -Ing. R. GmbH, Kiel, Germany,
p. 22.
7 jUng, Technical Association of the Graphic Arts,
from pure pigments, absorbing 1/3 and
reflecting 2/3 of the
visible spectrum.8
(Figure 6) No allowance has been made
for the natural contamination of the process printing inks.
Real process inks produce slightly different results because
of apparent contaminations.
cyan absorbs red, reflects blue and green
yellow absorbs blue, reflects green and red
magenta absorbs green, reflects red and blue
Figure 6. Absorption and reflectance of white light from
the substrate using pure inks (taken from Kodak Publication,
Basic Color for the Graphic Arts, Q-7)
Contaminations of Real Inks
The unavailability of pure inks requires the printing
industry to use inks that react as if they contain unwanted
contaminates. These contaminates produce added absorptions
of other portions of the light spectrum. Cyan not only
absorbs the red portion but also absorbs certain amounts of
the green and blue portions. Magenta absorbs the green
portion but produces unwanted absorption of the blue
portion. The yellow ink is the most pure of the three, with
little if any unwanted absorption.9 (Figure 7)
One criteria for quality color reproduction is the ability
to reproduce a neutral gray color with the three process
color inks. In theory, this should be possible with equal
dot percentages of all three inks, i.e., 50% yellow, 50%
magenta, and 50% cyan. In fact, slightly increased amounts
INK ABSORPTION
CYAN
70% CYAN
20% MAGENTA
10% YELLOW
MAGENTA
60% MAGENTA
30% YELLOW
10% CYAN
YELLOW
100% YELLOW
(almost perfect)
Figure 7. Absorption and reflectance of white light by real
Inks (taken from Kodak Publication, Basic Color for the
Graphic Arts, Q-7)
of cyan should be used to produce the neutral gray effect
due to the lack of color correction in the neutral areas of
the reproduction. The removal of the gray component should
include the proper gray balance for the particular ink set
that is used. Gray balance and the unwanted absorptions of
real inks can make the replacement of the gray component
difficult to understand. In reality, the replacement
process does not define the gray component by a simple
reduction of equal portions of the three process colors. An
olive green color will display the possible complications
that surround the GCR process.10
A normal chromatic color
reproduction of olive green should produce the results shown
in Figure 8.
The theoretical GCR process replaces the gray component with
black ink and reduces by 50% the amount of ink that deter
mines the hue. (Figure 9)
In the actual GCR process, this 50% reduction would not
occur. With the unwanted absorptions of the process colors
and the need to reduce the magenta and yellow ink to achieve
Y
M
C
K
100%
100-50% 7^~
So
60%
zs
0% o_
M
Figure 8. Percent dot area of yellow, magenta, cyan, and black ink in a normal chromatic reproduction of olive green
(taken from Achromatic Synthesis, marketing information.
Hell Graphics, Dr.-Ing. Rudolf Hell, Gmbh, Kiel, Germany, 1983)
10 Saleh, Technical Association for the Graphic Arts,
Y = 50% loo
M = 0% 75
5o__
C = 10% <\S
K = 50% o 1 1
M
Figure 9. Expected GCR reproduction (taken from Achromatic
Synthesis, marketing information, Hell Graphics, Dr.-Ing.
Rudolf Hell, Gmbh, Kiel, Germany, 1983)
gray balance, the GCR reproduction would yield different
results as in Figure 10.11
Kueppers, et al. , claim GCR allows more variation in ink
levels with reduced shifts in color on the lithographic
offset press.12
If the LPC has an increase or a decrease in
solid ink density (the measurement of a solid ink film
through a reflection densitometer) , the color produced from
the combinations of the three inks will not experience a
shift in hue. This follows logically because an increase in
the LPC would not affect an ink combination from which it
had been removed. Adjustment of the solid ink density (SID)
of the cyan would not change the particular hue.
The previous example of the red apple defines the gray
component by a representation of a dotted line. This line
11 Ibid, p. 140,
12 Harald Kueppers, An Atlas for Color Mixing, p. 150,
Y = 95% loo
M = 15% 7iT
So
C = 0%
is
K = 65% 0
M
Figure 10. Actual GCR reproduction (taken from Achromatic
Synthesis, marketing information, Hell Graphics, Dr.-Ing. Rudolf Hell, Gmbh, Kiel, Germany, 1983)
identifies the gray component as a combination of 10% of
cyan, magenta, and yellow. The portion of the color that is
above the dotted line identifies the hue of the color.
(Figure 11.)
Y = 50% loo
M = 75%
75 .
,fo
C = 10%
V
K = 0% n
-HUL
i_l
GRAYCOMPONENT M
Figure 11. Division of the gray component from the hue in a
normal chromatic color reproduction of red apples
Although the LPC may increase or decrease in SID, with the
100% GCR the hue will stay the same. A slight shift in hue
will result from the 60% GCR due to the minimal amounts of
[image:29.521.33.466.264.523.2]HUE.
U l I 1
HUE
!
!
I l~lHUE
i 1
1
Y Nf\ C K Y M, C K \ M C K
Figure 12. Shifts of hue during variation in SID of LPC in the GCR process
reduces the shifts of hue when compared to normal chromatic
reproductions. (Figure 12)
The normal chromatic reproduction will experience a shift in
hue with the increase or decrease of the LPC. (Figure 13)
HUE
7
Y M C
HUE
T
HUE
Y NN C V M C
Chapter 2
LITERATURE REVIEW
In Color Atlas, A Practical Guide for Color Mixing, Harald
Kueppers credits Wilhelm Ostwald with the first accounts of
GCR in 1921 in the German magazine Die Farbe [Color] . The
process was first described in the United States in 1948.
Arthur C. Hardy and F. L. Wurzburg presented a set of
equations that would utilize a scanner to produce a set of
separations that look "unlike those to which the art is
accustomed."1
Further, they explained "if a gray scale is
included with the subject, it is not reproduced at all by
the color plates but only by the black plate."
To achieve
this result requires the separation of the darkening area,
or gray component, from the reproduction. Other papers
written by Hardy and Wurzburg described the theoretical
basis for such a "scanning machine."2
Hardy and Wurzburg
added that "only with the use of electronics could such
complex color correction calculations be performed with
1 A. C. Hardy and F. L. Wurzburg Jr., "Color Cor
rection in Color Printing," Journal of the Optical Society
of America, vol. 38, no. 4, April, 1948, p. 300.
2 A. C. Hardy, F. L. Wurzburg Jr., "An Electronic
Method for Solving Simultaneous Equations," Journal of the Optical Society of America, vol. 38, no. 4, April, 1948, p,
sufficient speed to make such a theory feasible."3 In the
1954 TAGA proceedings, Phil Tobias repeated the idea of a
scanner machine and again discussed the question of reducing or replacing the gray component.4
It was only a matter of
time before the technology would make such a process
feasible.
Harald Kueppers'
Color Atlas presented some of the first
examples of actual GCR processing.9
Using screen tints to represent the properties of the GCR process, Kueppers
produced a color guide for both the chromatic and achromatic
color processes. Side by side, these charts showed the
advantages of the GCR process. When Kueppers'
book was
published, his "new" color process could only be mech
anically assembled. With recent advances in color separa
tion, electronic scanners are now capable of this process. Increasingly, industry now considers GCR a possibility.
Corporate research and development departments have been
persistent in pursuing the production of the GCR process. This increased interest has resulted in many recent pub
lications. At the 1984 TAGA meeting, Dr. Eggert Jung of Dr.
3 Ibid., p. 308
4 Philip E. Tobias, "A Color Correction Process," Edward Stern and Company, Inc., Technical Association for the Graphic Arts, 1954, p. 85.
-Ing. R. Hell Gmbh, Keil, Germany, explained the GCR
processing of the Hell scanners manufactured by his firm.6
Hell has two different versions available, programmed color
removal (PCR) and the complementary color reduction (CCR) .
CCR is Hell's terminology for gray component replacement and
is an option on many of their new scanners. PCR is the GCR
process that uses digital transformation tables programmed
into their Chromacom pagination system.7
Dr. Abdel Ghany Saleh presented a more general explanation
of the achromatic synthesis at the 1984 TAGA meeting.8 Dr.
Abdel Ghany Saleh's diagrams have been used to explain the
theory behind the GCR process in this research.
Mike Bruno, editor of Technology and Trends, helped intro
duce the concept of the GCR process in trade journals.9 His
article "Achromatics, Four-Color Printing that
Isn't" in
American Printer explained the concepts of this new color
printing process to the general printing public. Bruno
explained the advantages and reasoning underlying this
6 Jung, Technical Association for the Graphic Arts,
Proceedings of the Thirty-Sixth Annual Meeting, p. 136.
7 Ibid., p. 136
b saleh, Technical Association for the Graphic Arts,
Proceedings of the Thirty-Sixth Annual Meeting, p. 157.
9 Mike Bruno, Achromatics, Four Color Printing that
complicated and
technologically advanced color system,
BACKGROUND
Advanced research in the GCR process first took place in
Europe, where German researchers coined the term
"unbunt-au-fbau,"
a direct translation of which produces the word
"achromatic"
or "with-out color."
Webster's New World
Dictionary defines achromatic as "1. colorless 2. refracting
white light without breaking it up into its component
colors."10
To use an optical term that describes the
absence of color and apply it to a color reproduction
process was inappropriate. Franz Sigg, researcher at the
Technical and Education Center for the Graphic Arts at
Rochester Institute of Technology, polled people in both
education and industry for input to determine a new term.
He derived "Gray Component Replacement,"
a more apt defini
tion than achromatic for a process that removes the gray
component of a color and replaces it with black.11
10 Webster's New World Dictionary, 2nd
ed., World Publishing Co., Inc., Cleveland, New York, p. 11.
11 Franz Sigg, "On Second
Though, Let's Call It Gray-Component Replacement"
T+E Center Newsletter, Technical and
Statement of Purpose
If the GCR process does indeed reduce shifts in hue then the
advantage of using this process should be promoted. Much of
the waste in the lithographic press is a result of varia
tions of color or shift of hue. The elimination of waste
can be viewed as a direct reduction of costs.
HYPOTHESIS
If variations of SID are encountered, tendency for the press
sheet to shift in hue will be reduced with the GCR process
Chapter 3
METHODOLOGY
Testing the hypothesis required the design of a special
printing form. Each of the three different color reproduc
tion processes normal chromatic, 60% GCR, and 100% GCR/50%
UCA were represented through the printing of a photograph
and a series of 24 color patches. Each color patch was
divided diagonally so that every square of color would
provide sample segments depicting the 4 color, 3 color, and
black used in the reproduction. This allowed a visual
comparison of the gray component that was removed in each of
the three, color printing processes. (Figure 14)
Black
4 Color
3 Color
Figure 14. A example of the segmented color test patches
depicting 4 color, 3 color, and black only.
The photographic examples provided three sets of separations
to be used in the research. The normal chromatic
reproduc-tion-SWOP specifications (Specifications for Web Offset
not exceed 280%^ The other separations were the 60% GCR-0%
UCA and 100% GCR-50% UCA. These were designated A, B, and C
respectively and positioned from left to right near the tail
edge of the form.
The SWOP standard is used in conjunction with publications
printing to alleviate the excessive amounts of ink printing
in one area of the press sheet. Reduction of the maximum
printing dot was accomplished with the use of UCR, the
reduction of the three process color inks with the replace
ment of black.2 Only the neutral areas of the reproduction
are reduced with the sole purpose of reducing inking
problems associated with excessive ink coverage on the
lithographic press. UCR has no significant visual effect on
the reproduction.
The varied reproductions of the segmented color test patches
were placed towards the lead edge of the press sheet for
precise control on the lithographic press. Numbering
allowed simple identification of the different processes and
test patches. Thus, color patch B-18 represented a repro
duction of the 18th color patch for the 60% GCR/0% UCA
process.
1 Miles Southworth, "New SWOP Publication," The
Quality Control Scanner, vol. 1, no. 3, (1981), p. 2
2 J, A. Yule, Principles of Color Reproduction, p.
Variation in density control across the press cylinder
required that the corresponding hues align around the
cylinder. Hence, the color patches were divided into groups
of corresponding hues. Under the
photograph of the normal
chromatic reproduction were the color patches A 1-8, B 1-8,
and C 1-8. Similar groups of patches A, B, and C 9-16 and
A, B, and C 17-24 were placed under the photographs of the
other two reproduction processes (60% GCR/0% UCA and 100%
GCR/50% UCA) . (Figure 15)
Color Patches
PROCESiA PROCESS B
A, 5-8 B, 5-8 C, 5-8
ODD ??? ??? ???
???
???
DDDD ? ?no ??nn ? ??? ????
DDDD
???
? ?
?? ?
~
?? ?a
a ??
??? "DP an
Figure 15. Layout of the thesis printing form
The transparency selected for reproduction was a standard 4
x 5 Ektachrome used by the Electronic Color Imaging Labora
tory at Rochester Institute of Technology. A "standard"
transparency is defined as suitable for color evaluation in
the separation process. The transparency included fruit,
vegetables, wood, and plants to represent memory colors and
the transparency. Each color reproduction process was
scanned twice, once for the complete image of the trans
parency and again to include an enlarged area of the McBeth
Color Checker. The area of the transparency that included
the color checker produced the different "color patch"
separations.
A RIT Color Control Strip was included with the separations,
as was a RIT Symmetrical Test Target and a UGRA Plate
Control Wedge. These devices provided a method of mon
itoring and controlling the different stages of production.
The form including the test targets was assembled onto flats
and exposed to plates, and the plates were mounted on the
press. During the pressrun, the press controls were
adjusted to have the printing form match the proof.
Matching was done subjectively by visually comparing the
photographic image of the press sheet and proof. When a
match was accomplished, sample press sheets were gathered to
provide a set of
"standard"
densities. These samples
provided a base from which to judge the variation in hue on
the lithographic press.
After the standard samples were gathered, the press crew
selectively increased and then decreased the ink feed of the
press. Each printing unit was varied individually for each
bulk during each press adjustment, and the prescribed
variations of SID were sorted at a later date. The in
creases and decreases in ink feed were adjusted until a
shift in hue was visibly noticed. When this was accomp
lished, the press was returned to the standard density
settings. The same sequence was followed for the each press
unit. The collection of pressheets provided densities which
varied from the standard by -.10, -.20, -.30 and +.10, +.20,
+.30 units of density. The increases and decreases in
intervals of density values of .10 were figured on the
standard run itself. For example, the run was stabilized at
+/-0.05 of the standard, and the samples were sorted at an
average .10 intervals above and below that standard not to
exceed +/-.30 density value.
The instrument that was used for testing the press sheets
was a Hunter Lab Scan LS-12015 spectrocolorimeter. Use of
this instrument was important because it closely matches the
spectral sensitivity of the human eye. If shifts of hue are
to be the subject of this paper, then the instrument chosen
must be able to measure the variable in question. The Lab
Scan has the ability to store a color measurement as a
"standard,"
with the following readings measured as a
"trial."
Each color patch from the standard sheets was
measured considering it the
"standard"
hue, with other
colors measured in terms of change of hue, or more
specif-ically, Delta hue. Delta hue is defined as the change of
hue as calculated by the Hunter Lab Scan colorimeter.
Color Groupings
For statistical testing the color patches in the McBeth
Color Checker were grouped into four distinct categories
that define particular problems or different variables that
surround the color printing. These four color groups were
neutral grays, process and overprint colors, hard to print
colors, and all colors.
The neutral gray color was chosen because of the importance
of gray balance. Gray balance is the ability to print a
neutral gray color with the three process colors. This
ability is extremely important in the control of
high-quality color printing. If gray balance is obtained, it is
expected that a balance of the other colors should also be
maintained.
The process and overprint color patches include repro
ductions of the colors yellow, magenta, cyan, blue green,
and red. Although the process color printing inks are used,
the process color patches were reproduced through combina
are in turn reproduced with major portions to the two
process inks with smaller quantities of the third color of
ink. An example would be the color blue, which theoretical
ly would be reproduced with equal amounts of cyan and
magenta. In reality, this would not be correct. The color
blue would have a small amount of an LPC or the third color
included. The smallest variation between the three dif
ferent color processes should occur with the process/over
print colors.
The hard to print colors are defined as combinations of
light and dark skin tones with several dark tertiary colors.
The dark tertiary colors are defined as having a large
amount of gray component compared to the amount of ink that
would define the hue. An excellent example is the previous
ly diagrammed olive green color. This group should ex
perience the greatest variation between the three reproduc
tion processes.
The last grouping is all three groups of color patches
combined. If indeed there is a reduced shift in hue during
variations of SID then the combined color patches of all
three groups should reflect this hypothesis.
Shifts in hue are not the only things that are affected by
effect. With increases in SID, dot size also increases.
Dot gain is defined as the increase in dot size as a
halftone image travels from films to the printed sheet. If
the lithographic press was to experience a increase in SID,
then an increase in dot gain would also be experienced.
The elimination of a press run was attempted in this
research project. It was reasoned that the use of a DuPont
ATM (Automatic Toning Machine) Chromalin processor could
satisfactorily simulate the increase and decrease of SID of
the lithographic press. To simulate SID and dot gain on the
Chromalin processor, increases in toner densities were
created by adjusting the processor speed. Though increases
and decreases of .50-.55 in SID occurred, the standard 18%
dot gain was only increased by 4%.3
The increases and de
creases of SID could be simulated, but the change or
variations of dot gain could not. This increase in dot gain
does not represent an accurate account of the actions of the
SID and dot gain on the lithographic press.
The use of spacer material to increase dot spread might have
been an alternative to an actual pressrun if a negative
chromalin system was accessible. The spacers would cause
light scatter during exposure, which in turn accounts for
3 Pre-test, Electronic Color Imaging Laboratory,
dot growth. If spacers were to be used in the available
positive system, a reversing affect of changing dot size
(dot sharpening) would result. Dot sharpening is the
reduction of dot size as the halftone image travels to the
printed sheet. The high correlation between dot gain and
SID and correlations between dot gain and shifts in hue can
not be ignored. It was necessary to include a press run to
incorporate the variability of the lithographic offset
press.
With an increase in SID, the trap will also change.
Trapping is the application of one ink film on top of
another film of ink, which can have a pronounced affect of
the shifts of hue on the lithographic press. If the SID of
the second down color is greater than that of the first down
color, the hue of that two-color overprint will tend to run
closer to the second down color.4
An example would be a
cyan trapping over a magenta. If the SID of the second down
color "overtraps" then the color will be "bluish red."
By definition, the first color down can be either wet or dry
when the second color is applied. A dry trap would be more
practical for eliminating the effect of trapping entirely.
If a sheet fed press was used and the sheets were allowed to
4 George W. Jorgensen, "Control of Color on Press:
Overprints"
dry between colors, the dry trap would be possible.
However, the variability of multi-color offset presses
includes trapping along with dot gain. These problems need
to be included with the ease of variability on the offset
lithographic press. To put the GCR process to a realistic
test requires a press run that closely approximates pro
duction conditions.
Slight discrepancies between the normal chromatic and GCR
reproduction exist. The variation between the processes is
a problem the scanner manufacturer's themselves continue to
research. This variation did not affect this particular
study. What this research project attempts to compare is
the variation between the standard densities and variations
of densities of a particular process. The A, B, and C
processes were compared to a variation of themselves.
Although slight discrepancies may be objectionable in
comparing a GCR reproduction and an original normal chro
matic separation, it does not play a major role in this
Chapter 4
CONCLUSIONS
The objective of this paper was to test the hypothesis that
with variations of SID on the lithographic press, the GCR
process reduces shift in hue over the normal chromatic color
process. The McBeth Color Checker was reduced to four
distinct and separate color groupings neutral grays,
process/overprint colors, hard to print colors, and all
colors to evaluate of the different areas of reproduction
affected by the GCR process.
Instrumentation
Each of the color patches within the different groups was
measured with a Hunter Lab Scan spectrocolorimeter. The
first instrument reading was of the standard color patch,
and X, Y, and Z color coordinates were stored as such. As a
trial color patch was measured, changes in the X, Y, and Z
coordinates were recorded and calculated to provide readings
of Delta chroma. Delta lightness, and Delta hue. The
measurements continued with each new color patch. The
coordinates were obtained. Measurements of corresponding
"variation"
color patches provided X, Y, and Z coordinates
whose combined calculation produced a Delta hue reading.
These color patches were the variations of SID within each
color process. That is to say that standard process color
patch C4 was measured and the measurements stored. Cor
responding color patches of C4 representing variations of
SID were measured against the standard C4 reading and Delta
hue values resulted. This procedure was repeated until all
of the color patches 1-24 and each of the processes A, B,
and C had corresponding Delta hue readings. This study
focused on the shifts of hue on the lithographic press, so
the Delta hue was selectively utilized.
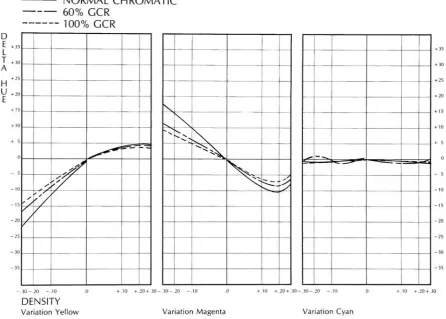
A semi-log graph was created to plot changes in Delta hue
against variations in SID and to provide a visual exami
nation of the results. Using the x, y axis of a coordinate
system, the x axis denoted the deviations of Delta hue and
the y axis the logarithmic changes in SID. Both density and
Delta hue values began at zero with positive and negative
values resulting. The x axis of the graph paper moved out
from the center in increments of +/- .10, .20, and .30
change in SID. The y axis moved out from the center in
increments of +/- 0 to 40 units of Delta hue.
normal chromatic, 60% GCR, and 100% GCR color processes as
they relate to an ink adjustment of a particular color
patch. If a particular process experienced reduced shifts
in hue, its curve would be drawn closer to the y axis than
the other processes. Thus, the three different reproduction
processes could be compared.
Visual analysis of each graph included information on a
specific color patch and that color patch's relationship to
NORMAL CHROMATIC 60% GCR
100% GCR
D E +3
L T +3
A
+2
H U +2
E
\ \
N
N
SNA
^^""*
sg^
^
-.30-.20 -.10
DENSITY
VariationYellow
+.10 +.20 +.30-.30 -.20 -.10 +.10 +.20 +.30-.30-.20 -.10
VariationMagenta Variation Cyan
+35
+30
+.10 +.20 +.30
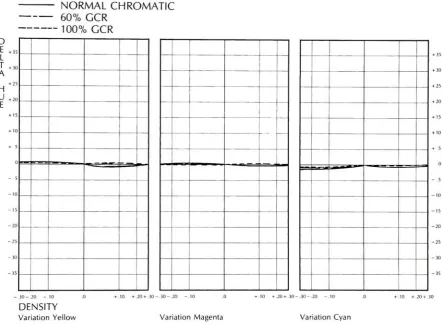
Figure 16. Graphs depicting variations of yellow, magenta,
and cyan ink for color patch #16 for the normal chromatic,
[image:48.521.37.482.271.599.2]the other color printing processes. In Figure 16, for
example, the graph represents color patch #16, which is the
color green foliage.
The comparison of the different processes and densities of
each process provide a judge of reduced variation with the
GCR color process. Variations of the magenta and cyan inks
produced somewhat reduced effects, but the results appear to
be the same.
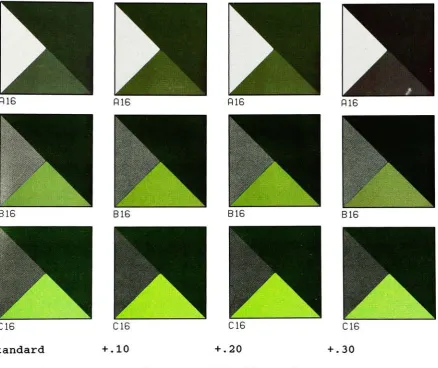
The actual color swatches for the variation yellow of color
#16 reinforce the information listed in the graphs in Figure
16. The specific color patches for the yellow variation
are mounted in Figure 17 and 18. Examination of the color
patches for the 100% GCR, 60% GCR, and the normal chromatic
process show that the GCR process does indeed reduce shifts
in hue.
In all, 18 individual color patches were examined. With a
visual comparison, it appeared that the 100% GCR was indeed
a more stable process than the normal chromatic process, but
what was more interesting is that the 60% GCR was noticeably
more stable than the normal process. It is this research
er's opinion that from the graphs alone, the GCR (both the
100% and the 60%) are more stable than the normal chromatic
This data does not quantify the difference between the color
processes. A quantitative difference was accomplished
through the use of a t-test. To determine statistically the
significance of the variation in hue, an average of the
total Delta hue readings was determined for each color
grouping. This is to say that a mean value of Delta hue
readings for the chromatic neutral gray was calculated as
B16
C16 C16 C16 C16
Standard -.10 -.20 -.30
Figure 17. Examples of color patch #16 with standard
densities and decreasing densities of the yellow ink for the
well as a mean for the 60% neutral gray and the 100% GCR
neutral gray color grouping. The neutral gray color
grouping was the first to be evaluated. The test of
variation between the two groups was accomplished with the
use of a t-test, measuring the difference between two means
The t-test number of significance is based on the number of
R16
BIG
P.16
B16
R16
B16
R16
B16
Figure 18. Examples of color patch #16 with standard
[image:51.521.48.487.228.596.2]degrees of freedom. With the total number of replicants
over 200 a infinite number of degrees of freedom was
utilized. This particular test require a t-number higher
than 1.65 to prove significance at the .05 confidence level
The neutral gray color grouping provided the greatest level
of significance of any of the groups tested. Both the 60%
process and the 100% process significantly reduced shift of
hue when compared to the normal chromatic process.
t-value % offreedom Ax Bx
A/B Process Comparison H.^9 Z.\H t>L 1.50
t-value %offreedom Ax CX
A/C Process Comparison fo.OO m Z.9/L 1.10
Figure 19. Statistical comparison between A and B processes
and the A and C processes of the neutral gray color grouping
As expected the importance of gray balance in the repro
duction of neutral gray tones can not be over emphasized
with the use of the normal chromatic color process. Gray
balance, the ability to print a neutral gray color with the
three process inks, does no apply with a process that
reproduces an original with only two colors plus black.
With the increase use of UCA and decreasing percentages of
The second grouping was the process/two color overprint
colors. The two color overprint colors were the blue.
t-value % offreedom Ax Bx
A/B Process Comparison 1.7^ l\H 5.06 <i.0b
t-value % offreedom Ax Cx
A/C Process Comparison 3.01 Z\H 5T06 3.39
Figure 20. Statistical comparison between A and B processes
and the A and C processes of the process/overprint color
grouping
green, and red. The comparison between the normal chromatic
and the 100% GCR was significant with the normal and the 60%
GCR comparison only slightly significant. This result was
to be expected with the process/overprint color comparison.
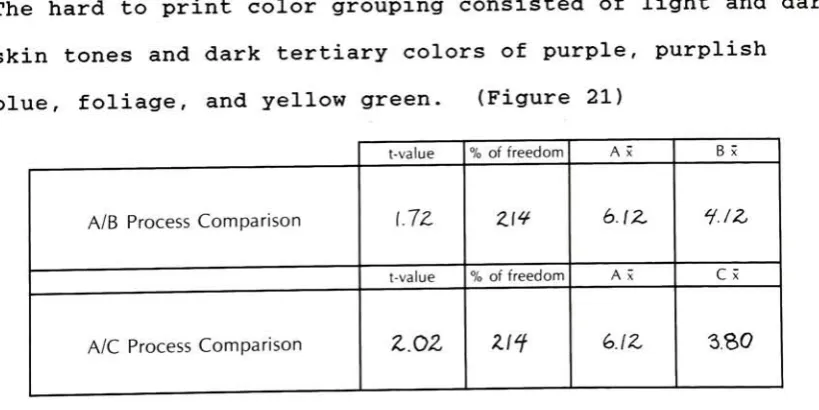
The hard to print color grouping consisted of light and dark
skin tones and dark tertiary colors of purple, purplish
blue, foliage, and yellow green. (Figure 21)
t-value % offreedom Ax Bx
A/B ProcessComparison 1.7z zw 6.12, 1.1z
t-value %offreedom A x Cx
A/C Process Comparison z.oz 2/f G.IZ 3.S0
Figure 21. Statistical comparison between A and B processes
and the A and C processes of the hard to print color
[image:53.521.45.455.449.654.2]The hard to print color grouping consisted of light and dark
skin tones and dark tertiary color of purple, purplish blue,
foliage, and yellow green. This group experienced the
smallest variation of all the groups. Though both compar
isons were significant, the normal/60% comparison was only
slightly significant. These results came as a surprise
considering the large variations expected with the hard to
print color grouping. The hard to print color grouping was
defined as large amount of gray component compared to the
amount of ink that defines the hue.
Certain color patches may have skewed the results to
produce a low significance to the hard to print grouping.
It seems unlikely a group that would provide low results of
significance could be effectively used as the visual eval
uation in this research. The color patch, foliage green used
as the visual comparison between the different processes
provided a strong example of the reduction in shift in hue
of the GCR process. This color patch seems to contradict
the result obtained in the statistical testing. It is this
researchers opinion that the color of purplish blue (#7) ,
light skin (#8) , and yellow green (#9) were incorrectly
added to the hard to print color grouping and decreased the
level of significance in this study.
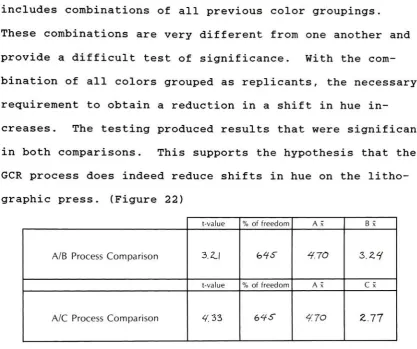
includes combinations of all previous color groupings.
These combinations are very different from one another and
provide a difficult test of significance. With the com
bination of all colors grouped as replicants, the necessary
requirement to obtain a reduction in a shift in hue in
creases. The testing produced results that were significant
in both comparisons. This supports the hypothesis that the
GCR process does indeed reduce shifts in hue on the litho
graphic press. (Figure 22)
t-value % offreedom Ax Bx
A/B Process Comparison 3.2J <o1S 1.70 z.zy
t-value %offreedom Ax CX
A/C Process Comparison V.33 bIS no Z.1T
Figure 22. Statistical comparison between A and B processes
and the A and C processes of the all colors
Implications
The results of research have begun to provide insight into
the applications of the use of GCR in the printing industry.
As color separators acquire equipment capable of GCR, the
[image:55.521.37.455.64.413.2]continued research broadening the understanding of the GCR
process.
Though the 100% GCR process is not recommended because of
the lack of sufficient density in the dark shadow areas,
there was some question of the processes ability to reduce
shifts in hue with reduced percentages of GCR. Through this
testing it has been shown that even with the reduced
percentages of GCR there are significant reductions in
shifts of hue on the lithographic press. The reduction in
shifts in hue are greater with the 100% process but the
advantages of the smaller percentages of GCR outweigh its
use.
Shifts in hue were the focus of this research but the
implications of the reduction in shift is hue are many fold.
As speeds of printing press, the cost of printing substrate,
and the need for shorter makereadies continues the GCR
process gains strength. The use of the GCR process will not
only decrease makeready but reduce down-time relating to
color variation. These advantages provide reduced costs and
Chapter 5
Recommendations
Through the course of this research questions have surface
concerning the GCR process. Limits of time and the scope of
the study has made it impossible to address questions
outside the original hypothesis. These questions will be
listed below in hope that they may provide direction for
persons interested in further research on the GCR process.
These questions currently remain while others are asked as
the GCR process gains popularity.
1. What percentage of GCR is the most efficient in terms of
shifts in hue? With the understanding of the limitations
in the use of the 100% GCR process what amount of GCR
should be recommended for the printing industry.
2. How can UCA be best utilized with the changes in the
amounts of GCR? What would be the recommendation to a
standard setting for UCA be used with the recommended GCR
BIBLIOGRAPHY
General References
Billmeyer, Fred W. Jr. Saltzman, Max. 1976. Principles of
Color Technology. John Wiley and Sons.
Bruno, Mike. 1985. "Achromatics, Four Color Printing that
isn't."
American Printer. Jan. vol 194.
Hardy, A. C, Wurzburg, F. L. Jr. 1948. "Color Correction in Color Printing."
Journal of the Optical Society of
America, vol 38.
Jorgensen, George W. "Control of Color on Press: Over
prints."
GATF Research Project Report, no. 118. p. 3.
Keppler, Gunter. 1982. Klischograph. Dr. -Ing. R. Gmbh. Kiel, Germany.
Kueppers, Harald. 1982. The Basic Law of Color Theory. Barron's. Woodbury, New York
Kueppers, Harald. 1982. Color Atlas, A Practical Guide to Color Mixing. Barron's. Woodbury, New York
Phillips, John L. 1982. Statistical Thinking. W. H. Freeman
and Company
Sigg, Franz. 1984. "On Second Thought, Lets Call it Gray
Component Replacement."
T+E Newsletter, vol. 12. no. 6.
Technical Association for the Graphic Arts. 1954. Proceeding
of the Sixth Annual Meeting. ""A Color Correction
Process."
Technical Association for the Graphic Arts.
1984. Proceeding of the Thirty-Sixth Annual Meeting.
"Programmed and Complementary Color Reduction."
Technical Association for the Graphic Arts. 1984. Proceeding
of the Thirty-Sixth Annual Meeting. "Investigation into the Application of Achromatic Synthesis to the Printing
Industry.
Southworth, Miles. 1981. Color Separation Techniques. 2nd
Southworth, Miles. 1981. "Quality Control Scanner. Graphic
Arts Publishing. Livonia, New York
Yule, J. A. 1967. Principles of Color Reproduction. John
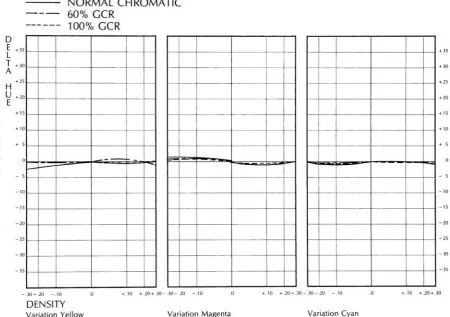
APPENDIX A
Graphs depicting variations of yellow, magenta, and cyan ink
for color patches used in comparing the normal chromatic,
60% GCR, and the 100% GCR color process.
NORMAL CHROMATIC
60% GCR
100% GCR
+3*,
+30
+?s
+?n
+1S
+10
+ s
n
_ s
-in
-Vi
-.30-.20 -.10 DENSITY
Variation Yellow
+10 +.20 +.30-.30 -.20 -.10 .10 +.20 +.30-.30 -.20 -.10
+30
+25
-.10 +.20 +.30
VariationMagenta Variation Cyan
Figure 23. Graphs depicting variations of yellow, magenta,
and cyan ink for color patch #1 for the normal chromatic,
[image:60.521.39.482.212.536.2]NORMAL CHROMATIC
60% GCR
100% GCR D
E +35 L ' +30 A
+25
H
b
+15
+10
+ 5
0
:=r==~
-5
^
^^
'=rz~
'*/ /// ///
/
' //
y
/
\\.
^N ^^s.
^^^C-,
_
-.30 -.20 -.10
DENSITY
VariationYellow
+.10 +.20 +.30-. 30-. 20 -.10 .10 +.20 +.30-.30 -.20 -10 +.10 +.20 +.30
VariationMagenta Variation Cyan
Figure 24. Graphs depicting variations of yellow, magenta,
and cyan ink for color patch #2 for the normal chromatic,
[image:61.521.35.482.219.531.2]NORMAL CHROMATIC
60% GCR 100% GCR
D E +3
L T +3
A
+2
H U +2
E
-30
-35
-V
^CNOn &*
_^
y/
V
,',
s/ ^
^.
" -?
s
''''
/
/
-.30-.20 -.10 DENSITY
Variation Yellow
10 +.20 +.30-.30 -.20 -.10 +.10 +.20 +.30-.30 -.20 -.10 +.10 +.20 +.30
Variation Magenta VariationCyan
Figure 25. Graphs depicting variations of yellow, magenta, and cyan ink for color patch #4 for the normal chromatic,
[image:62.521.35.482.216.535.2]NORMAL CHROMATIC
60% GCR
100% GCR
L) E +35
L
' +30
A
+25 H
U +,0 b
0
+30
+25
-.30-.20 -.10 DENSITY
Variation Yellow
.10 +.20 +.30-.30-.20 -.10 +.10 +.20 +.30-. 30-. 20 -.10 +.10 +.20 +.30
VariationMagenta VariationCyan
Figure 26. Graphs depicting variations of yellow, magenta,
and cyan ink for color patch #5 for the normal chromatic,
[image:63.521.32.483.214.531.2]